Sample Category Title
RBA’s Hunter cautious on further rate cuts, Treasurer warns of trade war’s indirect impacts
RBA Chief Economist and Assistant Governor Sarah Hunter reinforced the central bank’s cautious stance on further rate cuts. She emphasized in a speech today that while the February cut was deemed an appropriate time to "take some restrictiveness away", the Board were "more cautious than the market about prospects for further easing".
Hunter highlighted that US policy settings and their impact on the global economy as "one of the things we are focused on right now".
She added that policy decisions are always made in uncertain environments, where the baseline forecast is just one of many possible scenarios rather than a strict roadmap for future moves. The link between economic forecasts and rate decisions is "not mechanical".
Separately, Australian Treasurer Jim Chalmers acknowledged that the direct impact of US tariffs on Australia is "concerning, but manageable". But he warned that the larger risk lies in a broader global trade war. He described the current environment as a “new world of uncertainty”, where the spillover effects from rising trade tensions could have far-reaching consequences for Australia’s economy.
Gold Eyes Fresh Highs—Further Rally May Be Imminent
Key Highlights
- Gold started a fresh surge and traded to a new record high above $3,000.
- It broke a major bearish trend line with resistance at $2,920 on the 4-hour chart.
- Bitcoin is still struggling to clear the $85,000 resistance zone.
- EUR/USD is eyeing more gains above the 1.0950 resistance zone.
Gold Price Technical Analysis
Gold prices started a fresh rally above the $2,920 resistance. The bulls pumped the price above the $2,950 level and the price traded to a new record high.
The 4-hour chart of XAU/USD indicates that the price remained in a positive zone above $2,950, the 100 Simple Moving Average (red, 4 hours), and the 200 Simple Moving Average (green, 4 hours).
The bulls even pumped the price above the $3,000 level. The current price action suggests a high chance of more gains above the $3,005 level. On the upside, immediate resistance is near the $3,012 level. The next major resistance sits near the $3,025 level.
A clear move above the $3,025 resistance could open the doors for more upsides. The next major resistance could be $3,050, above which the price could rally toward the milestone level at $3,080.
On the downside, initial support is near the $2,975 level. The first key support is near $2,965. The next major support is near the $2,950 level.
The main support is now $2,925. A downside break below the $2,925 support might call for more downsides. The next major support is near the $2,900 level.
Looking at Bitcoin, the price attempted a recovery wave but the bears are still active below the $85,000 level.
Economic Releases to Watch Today
- US Industrial Production for Feb 2025 (MoM) – Forecast 0.2%, versus 0.5% previous.
Gold Price Outlook: ETF Flows, Central Bank Buying, and XAU/USD Price Targets
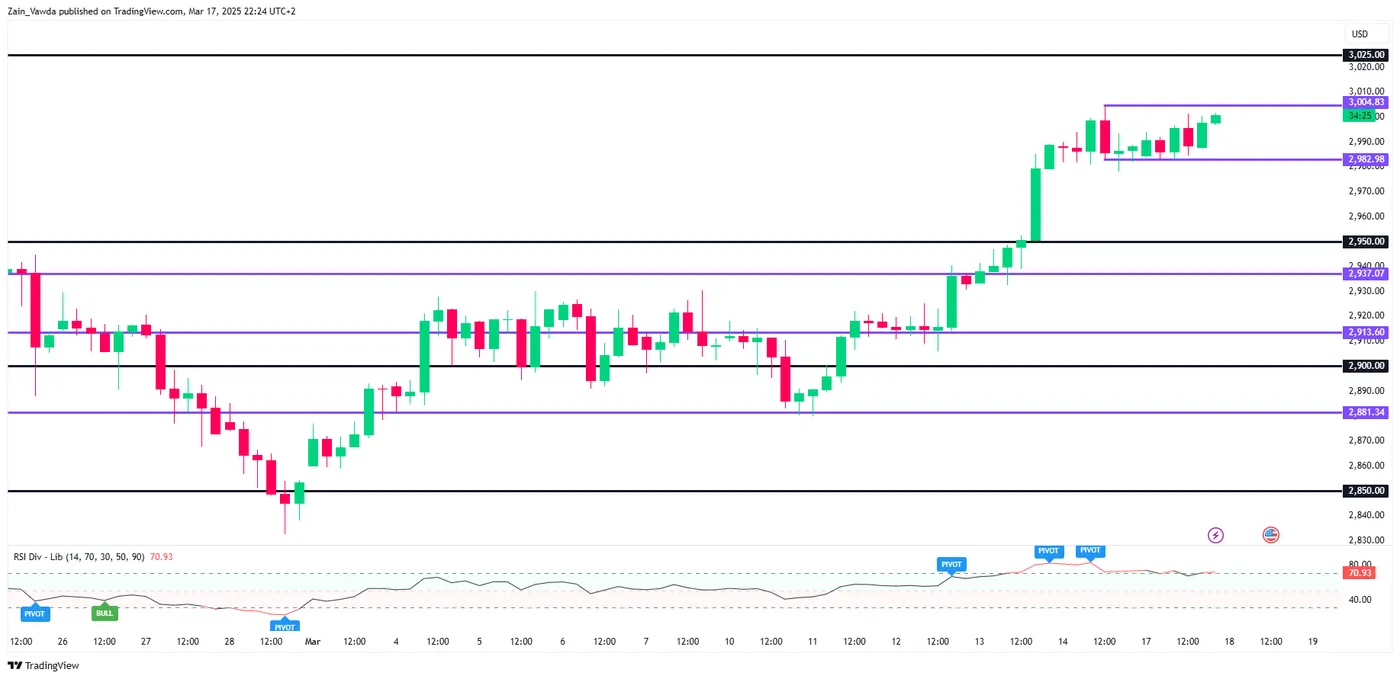
- Gold (XAU/USD) tested the $3000/oz level but faces resistance, with key support at 2994, 2982, and 2950.
- Increased Gold ETF inflows and significant central bank buying are supporting gold prices amidst economic uncertainty.
- Geopolitical tensions, sluggish retail sales, and the upcoming tariff deadline are contributing to market concerns and gold's appeal.
Risk assets appear more stable as the new week begins. US Treasury Secretary Scott Bessent reassured investors, saying that equity corrections are normal and beneficial.
However Gold prices are showing that market participants are still concerned about Geopolitical developments, sluggish retail sales data and the upcoming universal tariff deadline date of April 2. That is not even taking into account the Federal Reserve meeting this week which may lead to a lot of consolidative price action ahead of the event.
Acceptance Above the $3000 Handle is Key
Gold breached the key psychological $3000 level last week before a pullback. The pullback could be largely attributed to some profit taking as market participants may have been concerned of a deeper pullback.
Looking at the Gold rally over the past 18 months and each time a significant whole number level such as the $2700, $2800 etc have been broken we have seen significant pullbacks. $3000/oz is an even bigger milestone and one could understand the concerns of market participants especially with a Fed meeting this week.
The chart below shows Gold's performance against its safe haven counterparts. That is not to say that a pullback will not materialize, however this may be seen as a chance for would be bulls to get in on the extended rally.
The chart below shows the performance of Gold against its other safe have counterparts such as the Swiss Franc, Japanese Yen, US Dollar and US10Y.
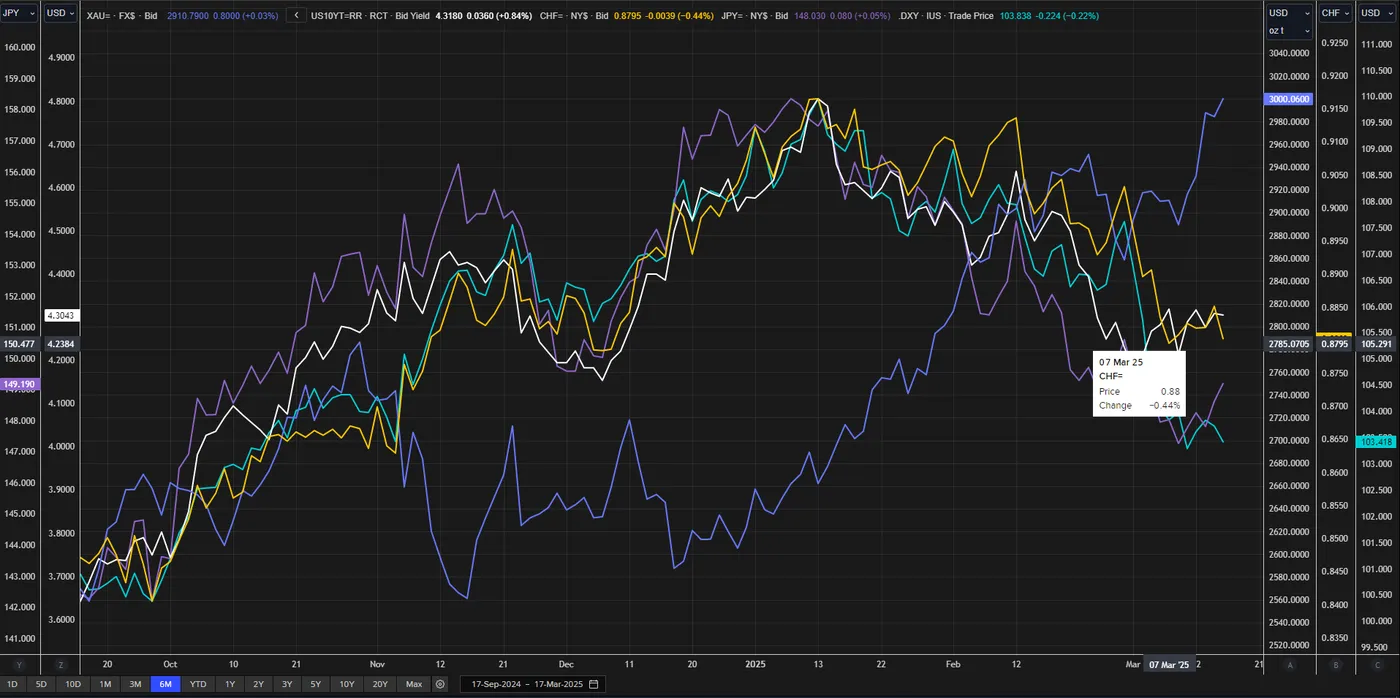
Source: LSEG
Gold ETF Flows and Central Bank Buying
There has been a significant uptick in Gold ETF flows over the past few months so much so that it has surpassed Bitcoin as well. Not surprising as Bitcoin prices have declined around 19% over 3 months while Gold has risen around 12 % over the same period.
To put this into perspective, Bitcoin ETFs have seen net outflows of around $3.8 billion since February 24. Gold on the other hand has seen significant inflows since the week starting February 21 with the most recent week ending March 14 seeing inflows of around $1.16B despite the precious metal touching the $3000/oz handle.
Gold exchange-traded fund (ETF) holdings have increased by about 3.88 million ounces this year, reaching nearly 86.7 million ounces, the highest since October 2023. February saw the biggest rise in holdings since March 2022. If this growth continues, it could continue to support gold prices. There is still room for more growth, as the current total is still below the 2020 peak.
Another sign of the strong demand in play at present.
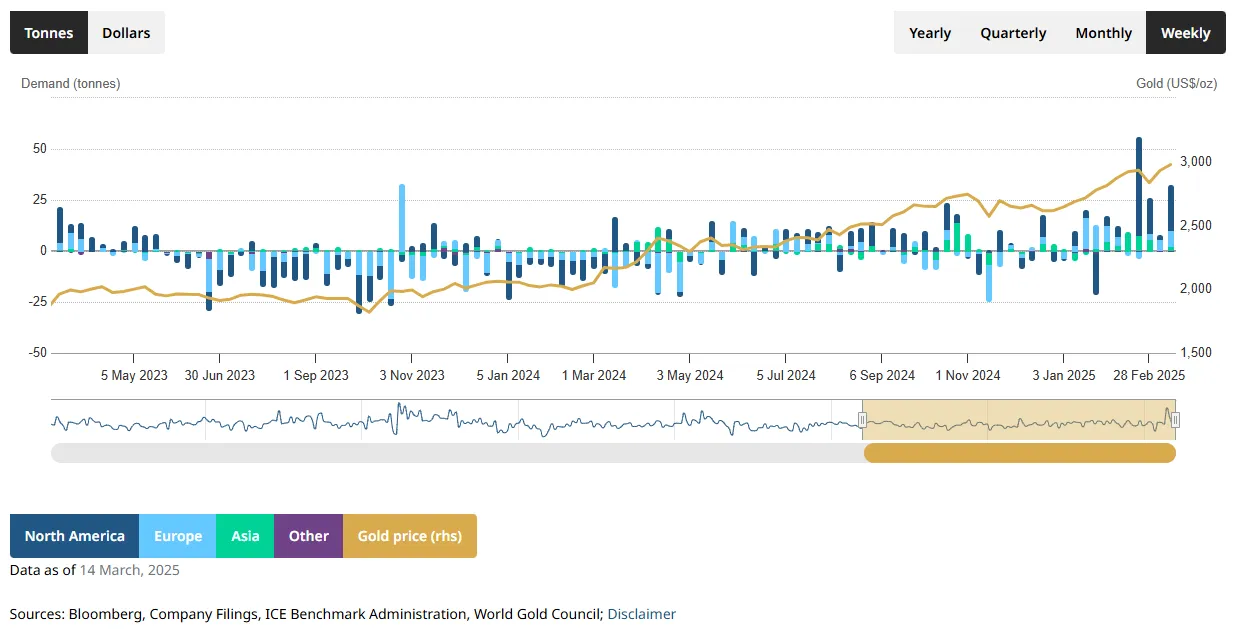
Source: World Gold Council
Looking at Central Bank demand, since the Russia-Ukraine war began in 2022, central banks have doubled their annual gold purchases from 500 to over 1,000 metric tonnes. Concerns over sanctions, like those placed on Russia, and shifts in currency reserve strategies are driving this trend. Last year, central banks bought 1,045 tonnes, about 20% of global demand, with Poland, India, and Turkey leading in purchases.
Following Trump’s election in November 2024, Comex gold inventories hit record highs, surging over 120% due to tariff fears and profitable price differences. Inventories now stand at 40 million ounces, the highest since 1992, though the pace of inflows has recently slowed.
Final Thoughts
At the moment it's difficult to see where the downside for Gold is going to come from. As uncertainty reigns over global markets, the stage is set for the precious metal to continue its ascent. Couple that with strong central bank demand, ETF flows and concerns around other safe haven currencies and my point is made for me.
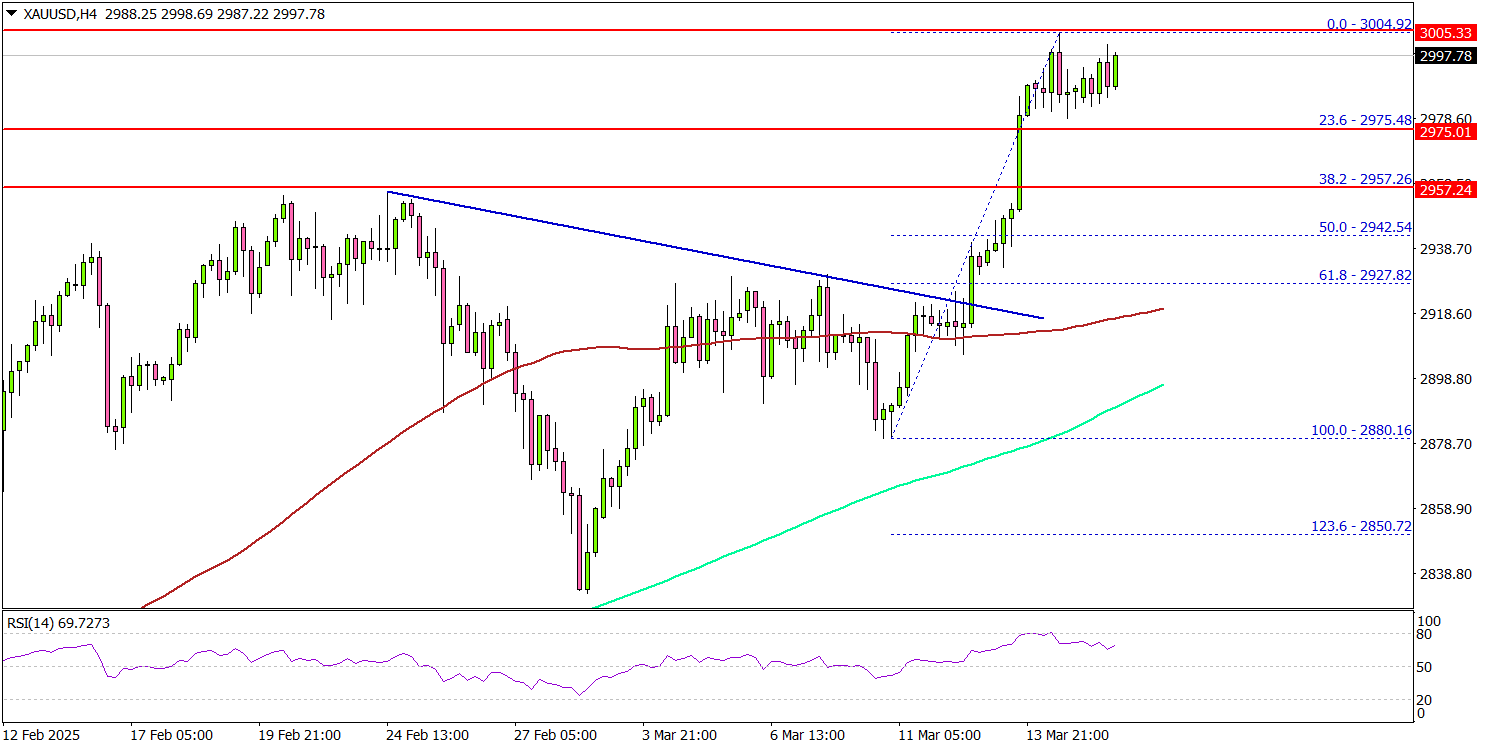
Technical Analysis - Gold (XAU/USD)
From a technical analysis standpoint, this analysis is a follow up from the technicals last week. Read: Will Gold Rally? XAU/USD Price Outlook Amidst Economic Uncertainty
Gold's price is difficult to decipher at present as we have once again printed a fresh high above the $3000/oz mark.
This makes finding resistance levels particularly difficult given the lack of historical data to go by.
Historically, significant rounded or psychological price levels have often posed challenges for market participants to achieve and sustain acceptance.
For context, It took buyers a year and a half to establish a sustained trend above the $1,000 level. Similarly, the $2,000 level required 3.5 years to break, even with the Federal Reserve's aggressive monetary policies during the COVID period.
Thus far the $3000/ oz has proved to be the same with Friday's fall followed by a retest today and a drop once more.
Immediate support levels are identified at 2994 and 2982, with an open run below that range extending down to around the 2950 handle.
On the upside, the all time high will be an area of resistance before the 3025 and 3050 may come into focus now. Once we have a price hold above the 3000 handle we may be able to find more accurate levels.
Gold (XAU/USD) Daily Chart, March 17, 2025
Source: TradingView
Support
- 2994
- 2982
- 2950
Resistance
- 3004
- 3025
- 3050
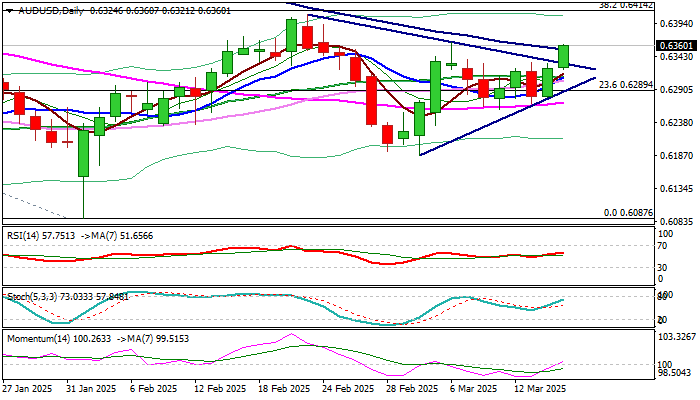
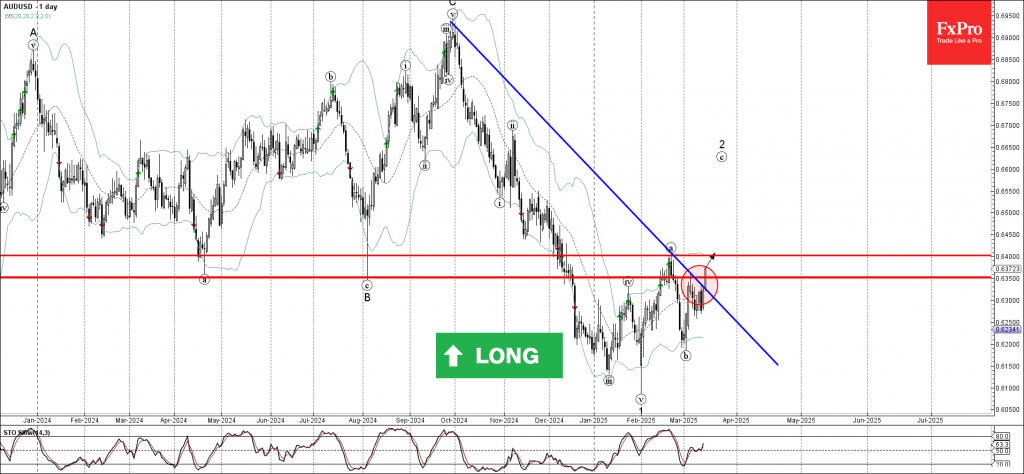
AUDUSD Wave Analysis
AUDUSD: ⬆️ Buy
- AUDUSD broke resistance level 0.6350
- Likely to rise to resistance level 0.6400
AUDUSD currency pair today broke the resistance level 0.6350, which is the top of the previous upward correction from the start of this month.
The breakout of the resistance level 0.6350 was preceded by the breakout of the resistance trendline from September – which accelerated the active impulse wave c.
Given the strongly bearish US dollar sentiment seen today, AUDUSD currency pair can be expected to rise to the next resistance level 0.6400.
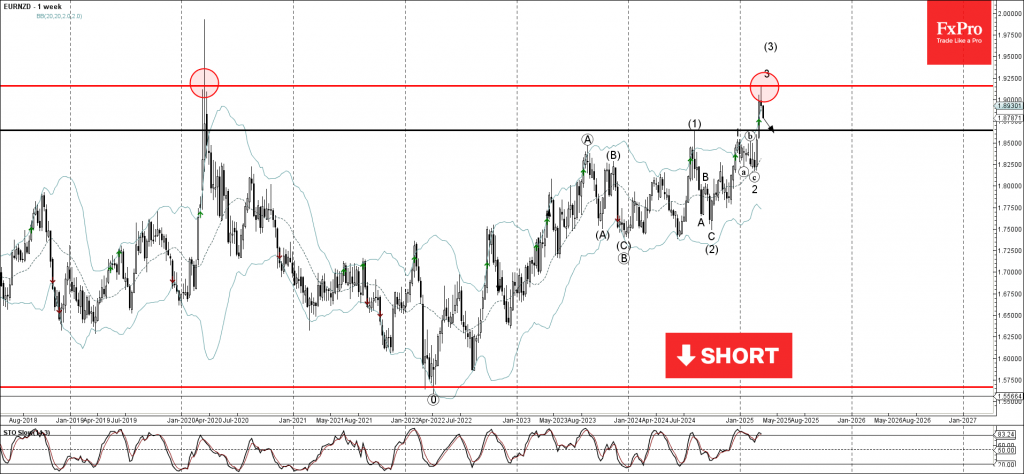
EURNZD Wave Analysis
EURNZD: ⬇️ Sell
- EURNZD reversed from long-term resistance level 1.9160
- Likely to fall to support level 1.8640
EURNZD currency pair recently reversed down from the long-term resistance level 1.9160, which stopped the sharp weekly uptrend at the start of 2020, as can be seen below.
The downward reversal from the resistance level 1.9160 created the weekly Japanese candlesticks reversal pattern Shooting Star.
Given the strength of the resistance level 1.9160 and the bearish divergence on the weekly Stochastic indicator, EURNZD currency pair can be expected to fall to the next support level 1.8640.
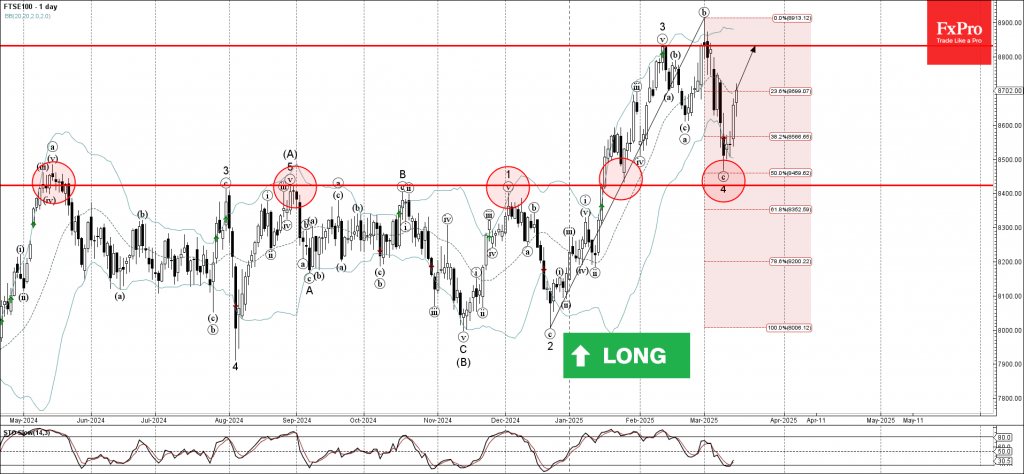
FTSE 100 Wave Analysis
FTSE 100: ⬆️ Buy
- FTSE 100 reversed from key support level 8425.00
- Likely to rise to resistance level 8832.00
FTSE 100 index recently reversed up from the key support level 8425.00, a former strong resistance from last year, which has stopped multiple upward impulses from May to December as can be seen from the daily FTSE 100 chart below.
The support level 8425.00 was strengthened by the lower daily Bollinger Band and by the 50% Fibonacci correction of the sharp upward impulse from December.
Given the clear daily uptrend, FTSE 100 index can be expected to rise to the next resistance level 8832.00 (which reversed the previous waves 3 and b).
Bank of England Preview – Quarterly Cuts Amid Elevated Uncertainty
- We expect the Bank of England (BoE) to keep the Bank Rate unchanged at 4.50% on Thursday 20 March in line with consensus and market pricing.
- Data has been mixed and amid elevated uncertainty, this warrants a continued signalling of only a gradual approach to monetary policy easing.
- We expect the reaction in EUR/GBP to be rather muted with risks tilted to the topside.
We expect the Bank of England to keep the Bank Rate unchanged at 4.50% on Thursday 20 March in line with consensus and market pricing. We expect the vote split to be 6-3 with the majority voting for an unchanged decision and Dhingra, Taylor and Mann voting for a cut. Note, this meeting will not include updated projections nor a press conference following the release of the statement.
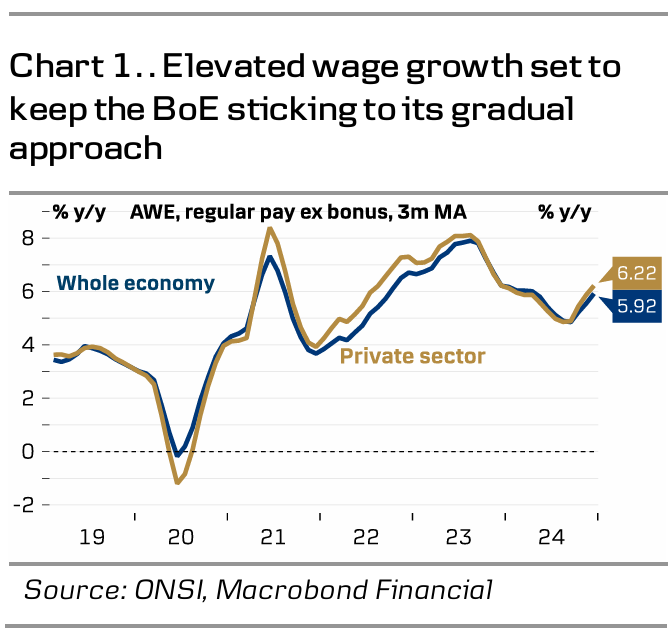
Overall, we expect the BoE to stick to its previous guidance noting that "a gradual and careful approach to removing monetary policy restraint remains appropriate". We expect the MPC to highlight heightened uncertainty due to domestic fiscal policy initiatives and trade policy tensions. By extension, we expect them to be in no rush to alter the current guidance. Since the last monetary policy decision in February, data has been mixed. The economy continues to stagnate, the labour market is gradually loosening while price pressures continue to be elevated. The economy ended 2024 on a slightly stronger note than in the MPC's projection, growing 0.1% q/q in Q4 2024. However, PMI data and monthly GDP estimate for January signals that growth remains muted, increasing the downside risks to the growth outlook. While private sector wage growth was slightly lower than expected at 6.2% in the three months to September (vs BoE forecast of 6.3%) it remains significantly elevated. On the inflation front, inflation was slightly higher than expected in headline terms but still showed broad based easing when looking at the service sector. The reaction to the impending increase in employers' national insurance contribution from April remains a risk for the labour market.
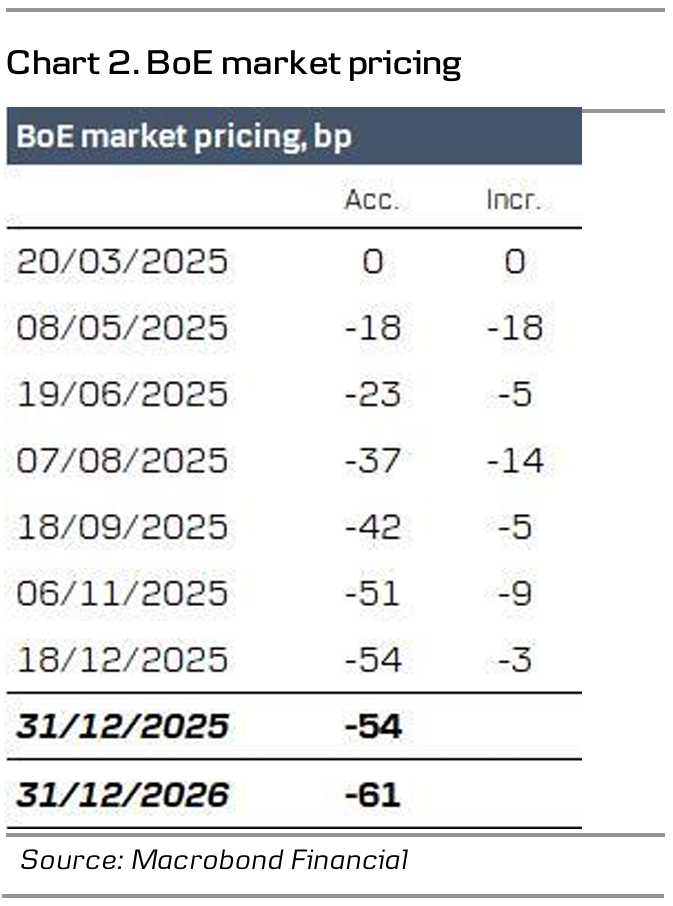
BoE call. We expect the BoE to stick to quarterly cuts, leaving the Bank Rate at 3.75% by YE 2025, which is lower than markets are expecting. Markets are pricing around 55bp for the remainder of the year. However, we highlight that the risk is skewed towards a swifter cutting cycle in 2025, given the dovish bias within the MPC.
Market reaction. We expect the market reaction to be rather muted upon announcement with an unchanged decision fully expected by markets and the BoE aiming to keep its options fully open. More broadly, we expect EUR/GBP to move lower in the coming quarters driven by a relatively hawkish BoE, and a growth pickup in the UK relative to the euro area in 2025. The key risks are continued elevated uncertainty, more euro optimism and a more forceful policy easing stance from the BoE.
Dow Jones: Rebound or Rally? The Fed Holds the Key
Key US indices staged an impressive rebound on Friday, turning the Dow Jones Industrial Average (DJI) up one step away from formally entering correction territory (-10% from the peak). In doing so, the US economy is headed for recession if the theories coined by the index’s founder and first editor of the Wall Street Journal still apply.

In his theory, Charles Dow pointed out that the trend of the industrial index is correct if confirmed by the dynamics of the transport sector. However, since peaking in late November, the DJTA index has lost nearly 20%, accelerating its decline three weeks ago. The rapid decline has led to the formation of a ‘death cross,’ a bearish market signal when the 50-day moving average dips below the 200-day moving average.
The accumulated oversold conditions in equities over the past three weeks suggests a high chance of a rebound, but how soon that rebound will lose strength will depend on monetary policy and incoming data.

The DJI was down as low as 25 on the RSI index last week. This is an oversold area from where a reversal to the upside was forming in October 2023 and September 2022. However, this technique could be broken or confirmed by market reaction to the FOMC meeting later in the week.
It is within Powell and Co’s power to break the mature beginning of the recovery by softening the tone of comments and promising further rate cuts soon. In this case, the market would be in an attractive position for buyers, who could launch a global rally towards new highs above 45000.
However, downside risks are pretty much equivalent. Since Trump’s presidential election victory, Powell has noticeably tightened his tone: tariffs have a pro-inflationary effect and are operating even with expectations. Friday’s jump in inflation expectations to 2.5-year highs recorded by the University of Michigan doesn’t help matters either.
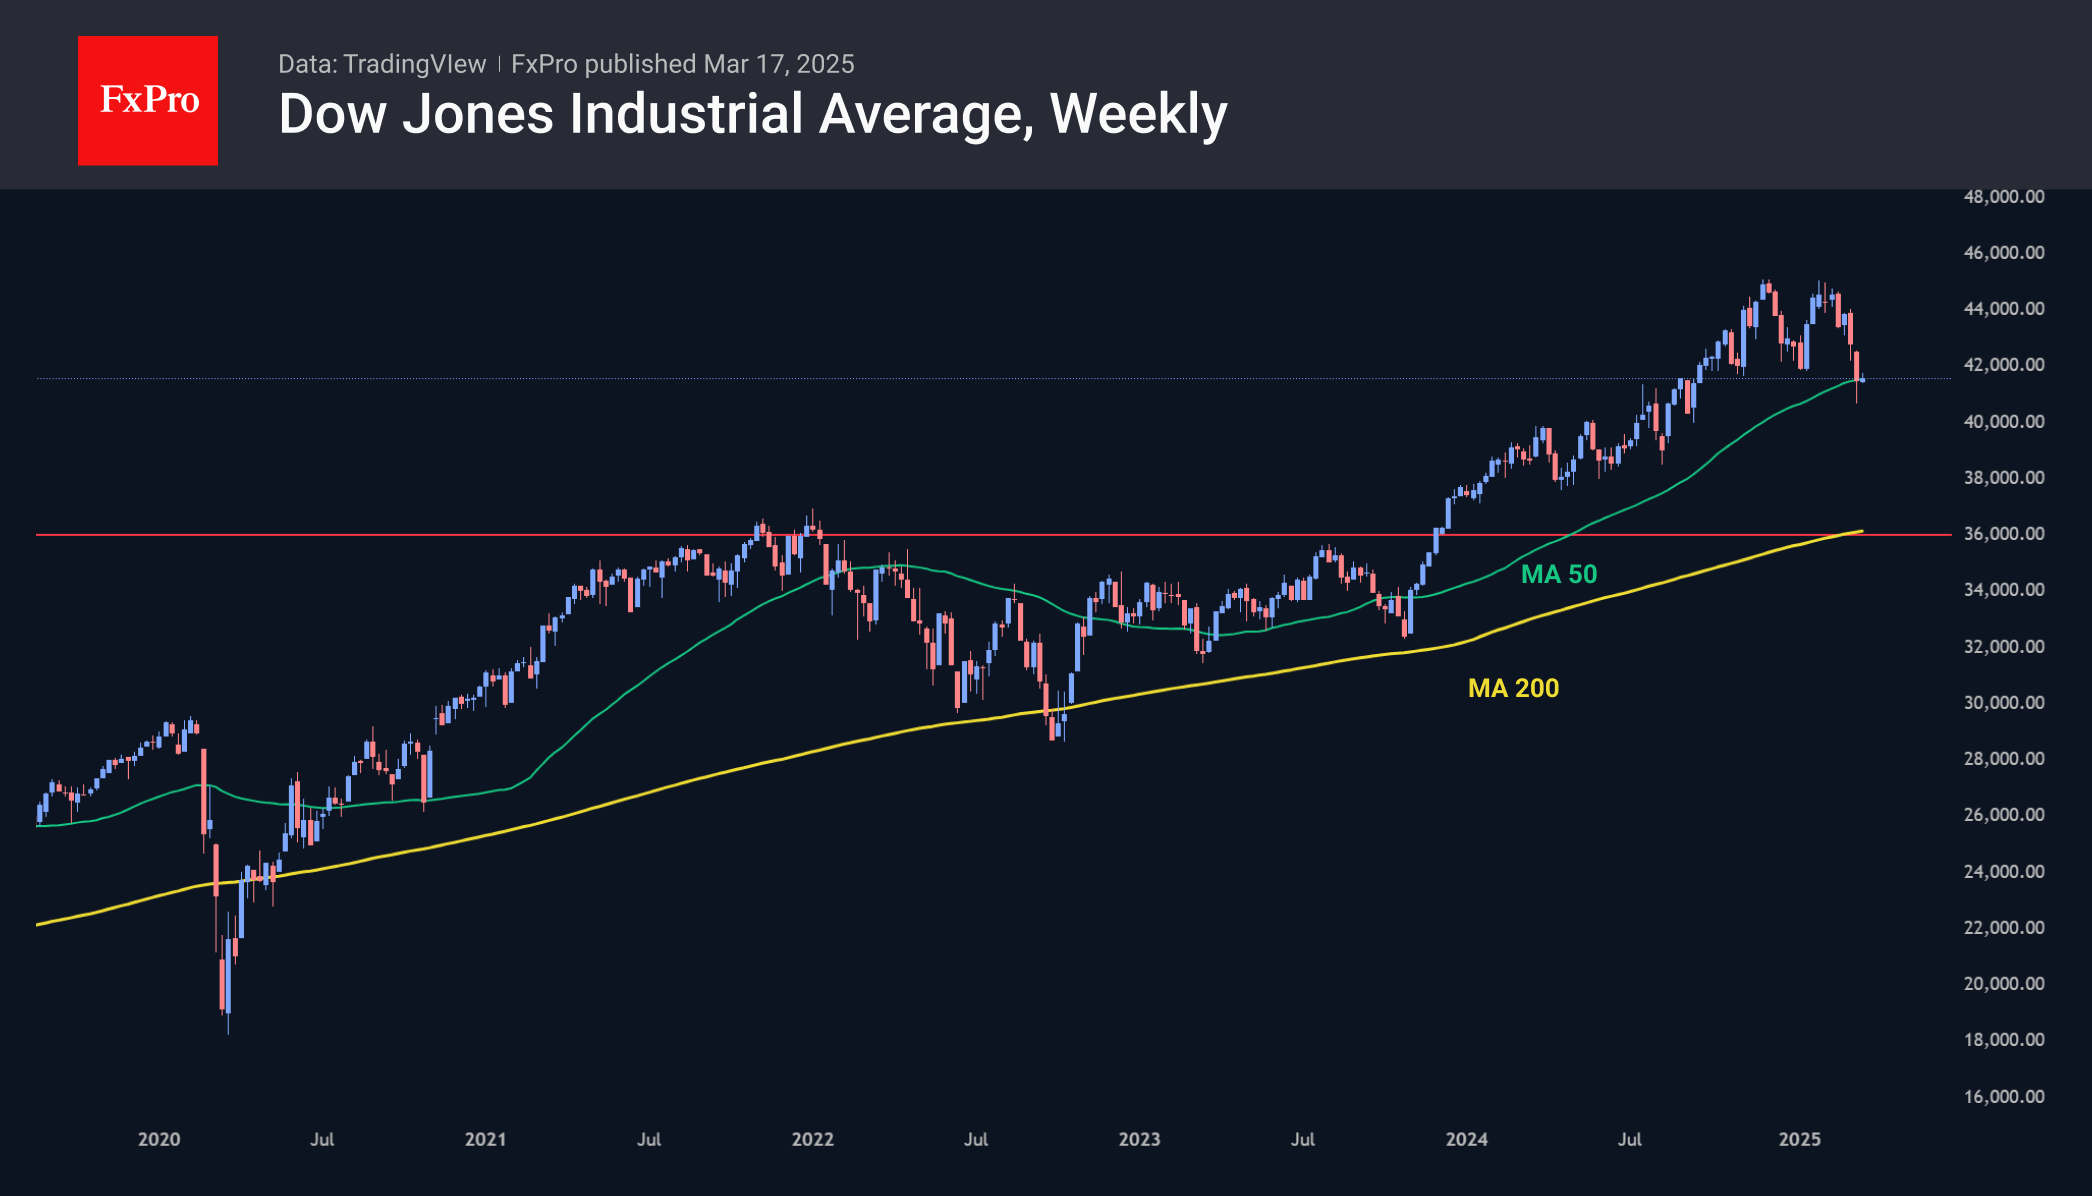
Consolidation and rebound in the indices are quite fragile right now. Without Fed support, the sell-off could quickly take on threatening proportions, triggering a liquidation of long positions and margin calls that could quickly take the index to 36000.
AUD/USD: Bulls Crack Important Barriers
AUDUSD rose to two-week high on Monday, continuing to benefit from weaker dollar and boosted by signals of China’s stimulus plan to boost domestic consumption.
Fresh bulls crack pivotal resistance zone at 0.6353/63 (100DMA / Mar 6 high), with break here to firm near-term structure for attack at more significant barriers at 0.6410/14 (Feb 21 high / Fibo 38.2% of 0.6942/0.6087 downtrend).
Improved technical picture on daily chart (MA’s turned to bullish setup / 14-d momentum is entering positive territory/today’s break above upper boundary of triangle) adds to growing positive signals.
Holding above broken triangle upper boundary (0.6329, now reverted to support) is seen as minimum requirement to keep near-term action in bullish mode, with sustained break 0.6410/14 barriers to signal continuation of larger recovery from 0.6087 (2025 low posted on Feb 3).
Res: 0.6330; 0.6408; 0.6414; 0.6441.
Sup: 0.6329; 0.6307; 0.6295; 0.6269.