Sample Category Title
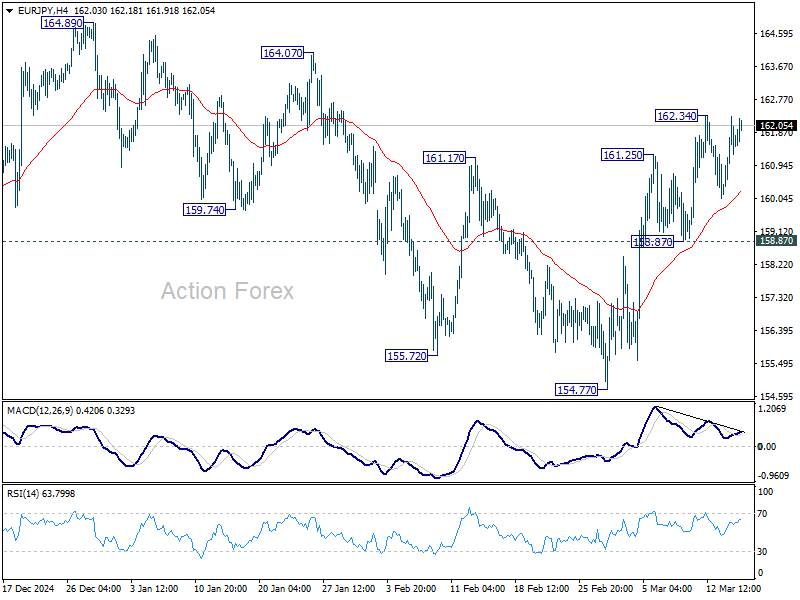
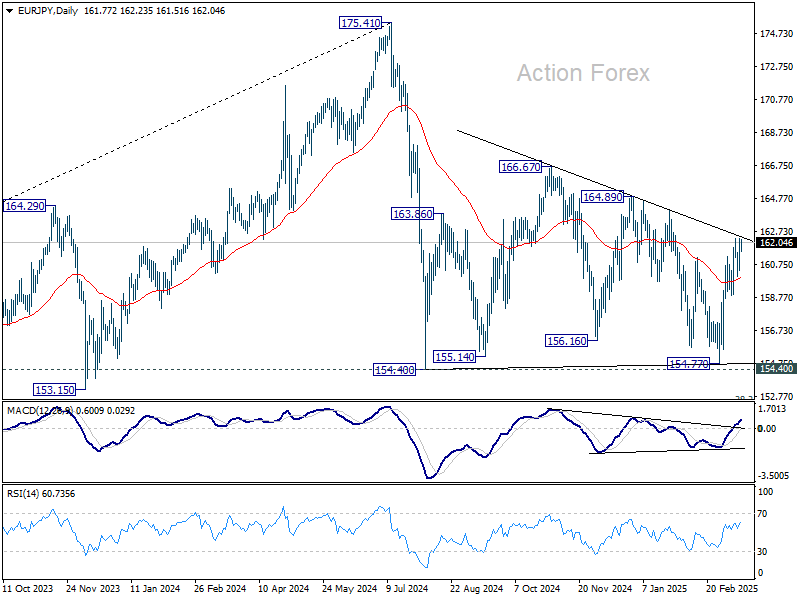
EUR/JPY Daily Outlook
Daily Pivots: (S1) 160.52; (P) 161.42; (R1) 162.58; More...
Intraday bias in EUR/JPY remains neutral and more consolidations could be seen. Further rally is expected as long as 158.87 support holds. On the upside, break of 162.34 will resume the rise from 154.77 to 164.89 resistance, as another rising leg in the consolidation pattern from 154.40.
In the bigger picture, price actions from 175.41 are seen as correction to rally from 114.42 (2020 low). Strong support should be seen from 38.2% retracement of 114.42 to 175.41 at 152.11 to contain downside. However, sustained break of 152.11 will bring deeper fall even still as a correction.
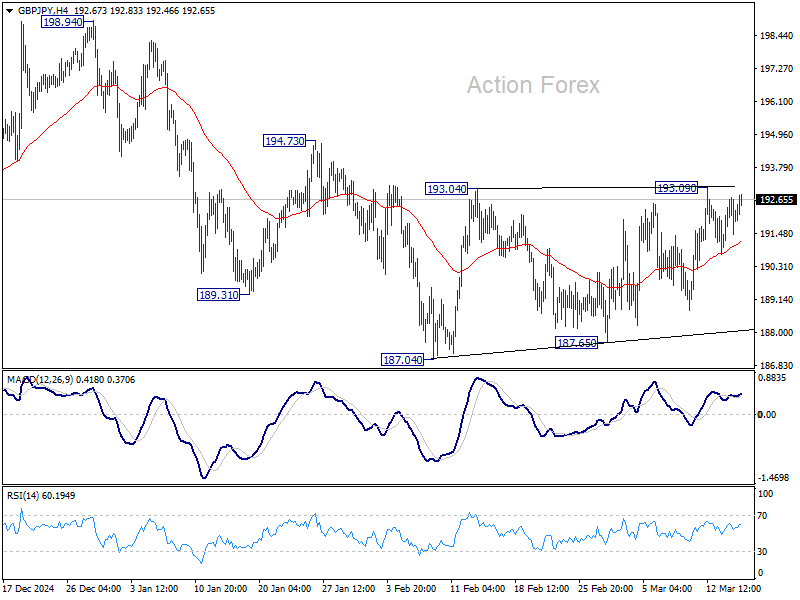
GBP/JPY Daily Outlook
Daily Pivots: (S1) 191.39; (P) 192.07; (R1) 192.90; More...
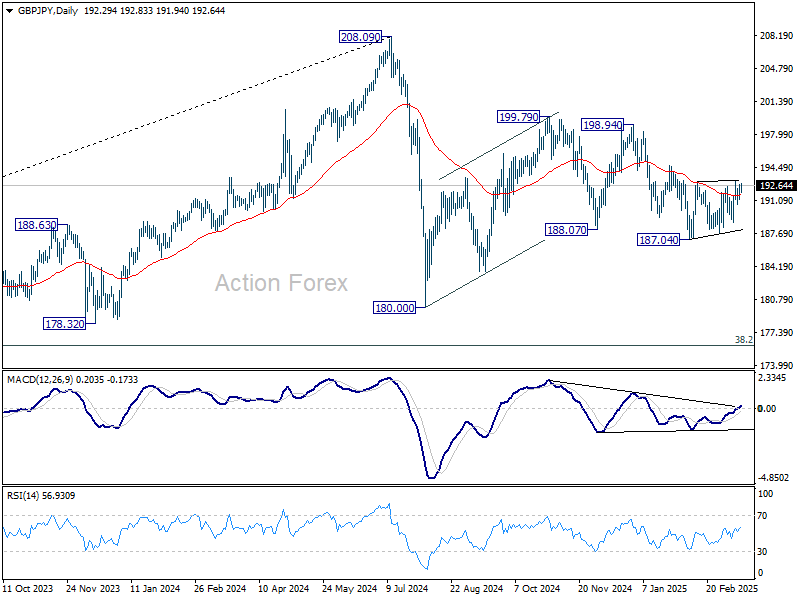
Range trading continues in GBP/JPY and intraday bias remains neutral. On the upside, firm break of 193.09 will resume the rebound from 187.04 to 194.73 resistance, and then 198.94. On the downside, firm break of 187.04 will extend the fall from 199.79 towards 180.00 support. Overall, corrective pattern from 180.00 might still be extending.
In the bigger picture, price actions from 208.09 are seen as a correction to rally from 123.94 (2020 low). Strong support should be seen from 38.2% retracement of 123.94 to 208.09 at 175.94 to contain downside. However, sustained break of 152.11 will bring deeper fall even still as a correction.
EUR/CHF Daily Outlook
Daily Pivots: (S1) 0.9580; (P) 0.9621; (R1) 0.9673; More....
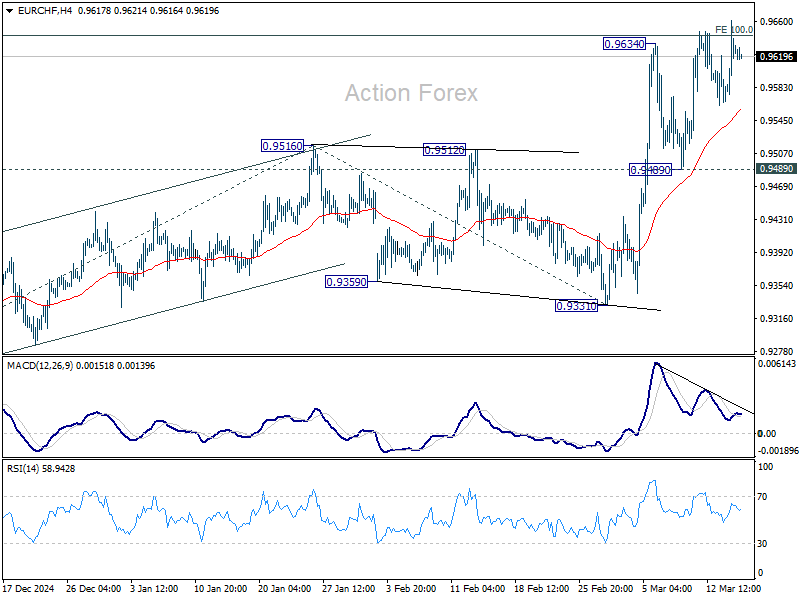
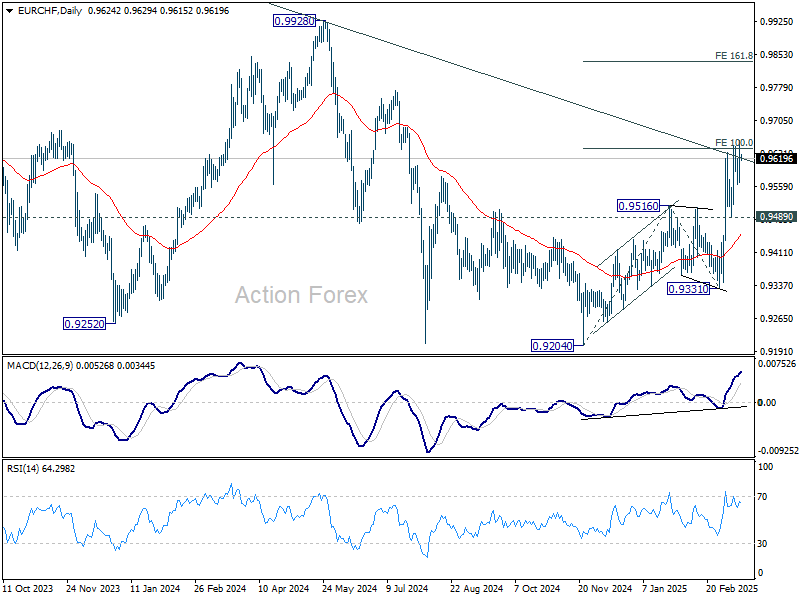
Intraday bias in EUR/CHF remains neutral for the moment, and further rise is expected as long as 0.9489 support holds. Sustained trading above 100% projection of 0.9204 to 0.9516 from 0.9331 at 0.9643 will pave the way to 161.8% projection at 0.9836 next.
In the bigger picture, prior strong break of 55 W EMA (now at 0.9487) is a medium term bullish sign. Sustained break trading above long-term falling channel resistance (at around 0.9620) would suggest that the downtrend from 1.2004 (2018 high) has bottomed at 0.9204. Stronger rally should then be see to 0.9928 key resistance at least.
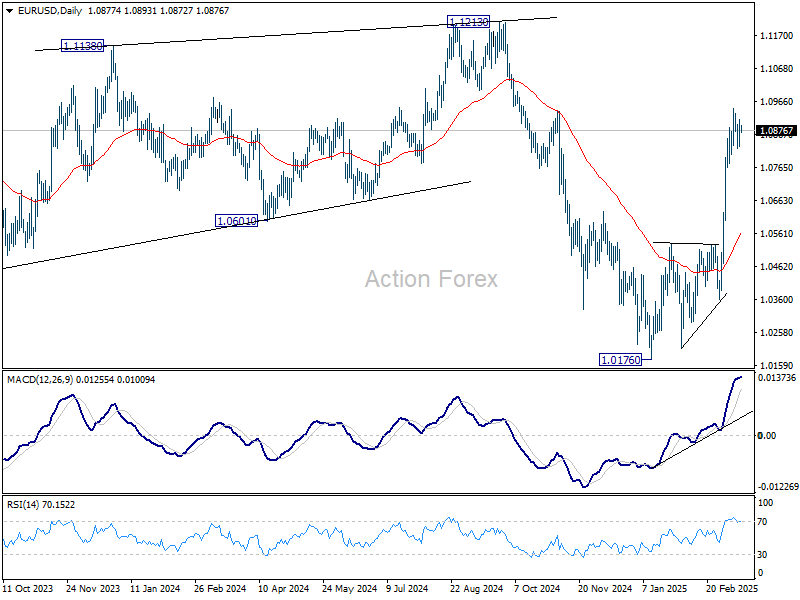
EUR/USD Daily Outlook
Daily Pivots: (S1) 1.0836; (P) 1.0874; (R1) 1.0918; More...
Intraday bias in EUR/USD remains neutral as consolidations continues below 1.0946. In case of another fall, downside should be contained by 38.2% retracement of 1.0358 to 1.0946 at 1.0721 to bring rebound. On the upside, break of 1.0946 will resume the rally from 1.0176 to retest 1.1274 key resistance.
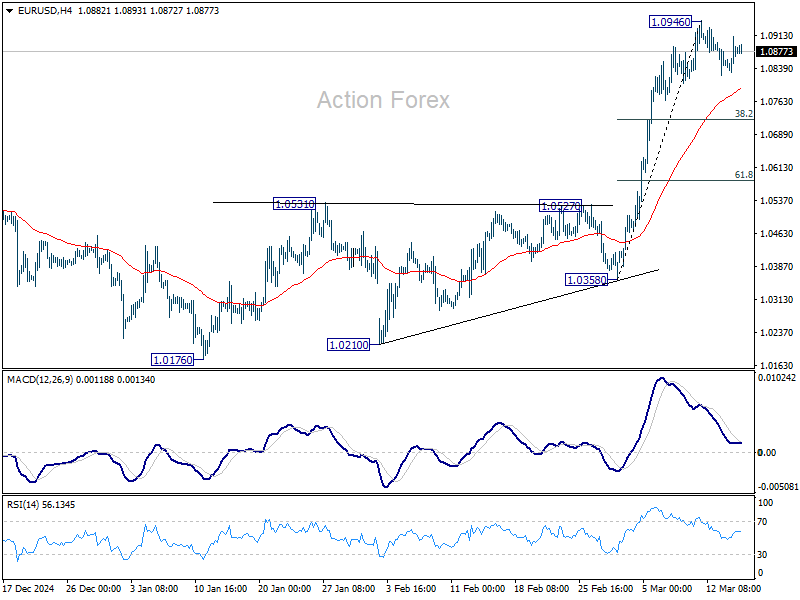
In the bigger picture, prior strong break of 55 W EMA (now at 1.0675) suggests that fall from 1.1274 (2024 high) has completed as a three wave correction to 1.0176. Rise from 0.9534 is still intact, and might be ready to resume. Decisive break of 1.1274 will target 100% projection of 0.9534 to 1.1274 from 1.0176 at 1.1916. Also, that will send EUR/USD through a multi-decade channel resistance will carries larger bullish implication. This will now be the favored case as long as 1.0531 resistance turned support holds.
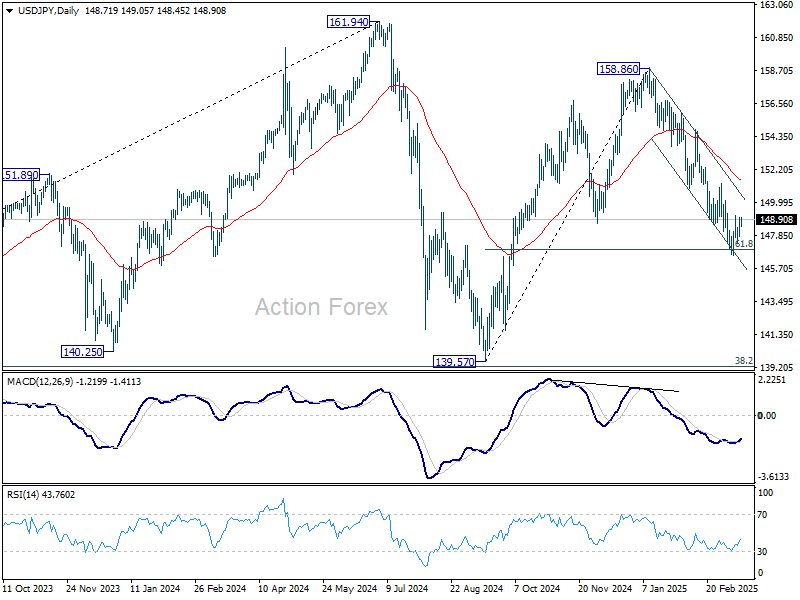
USD/JPY Daily Outlook
Daily Pivots: (S1) 147.89; (P) 148.45; (R1) 149.20; More...
Intraday bias in USD/JPY remains neutral as consolidations continue above 146.52. Upside of recovery should be limited by 150.92 support turned resistance. On the downside, sustained trading below 61.8% retracement of 139.57 to 158.86 at 146.32 will pave the way to 139.57 support.
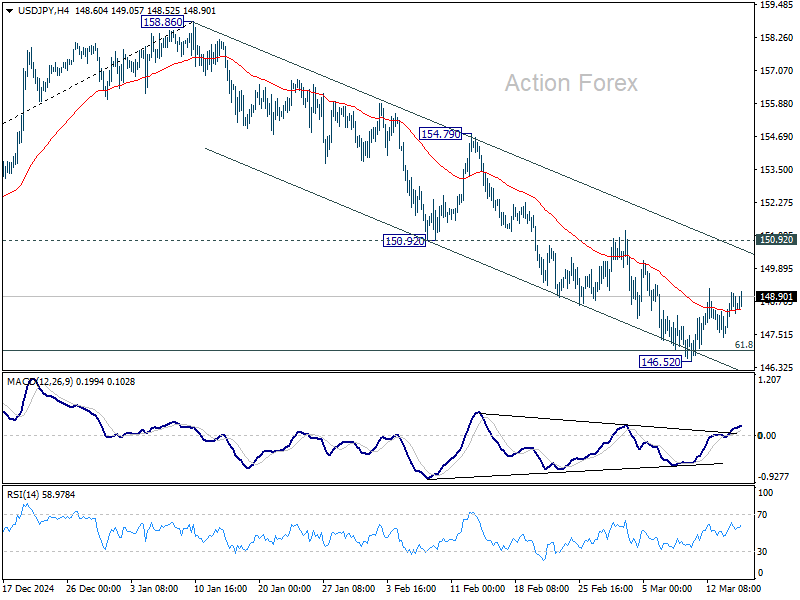
In the bigger picture, price actions from 161.94 are seen as a corrective pattern to rise from 102.58 (2021 low), with fall from 158.86 as the third leg. Strong support should be seen from 38.2% retracement of 102.58 to 161.94 at 139.26 to bring rebound. However, sustained break of 139.26 would open up deeper medium term decline to 61.8% retracement at 125.25.
GBP/USD Daily Outlook
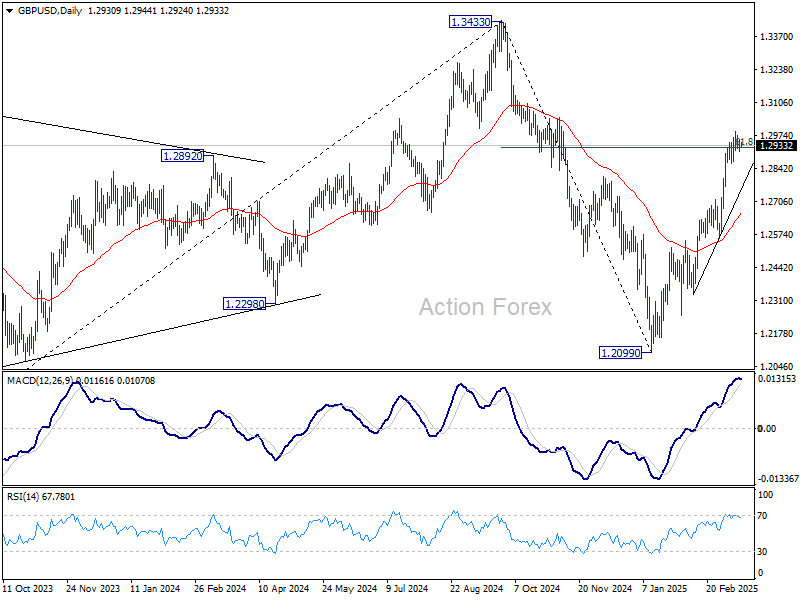
Daily Pivots: (S1) 1.2910; (P) 1.2934; (R1) 1.2958; More...
Further rally remains in favor in GBP/USD with 1.2860 support intact. On the upside, sustained trading above 61.8% retracement of 1.3433 to 1.2099 at 1.2923 will pave the way back to 1.3433 high. However, break of 1.2860 will indicate short term topping, and turn bias back to the downside for deeper pullback.
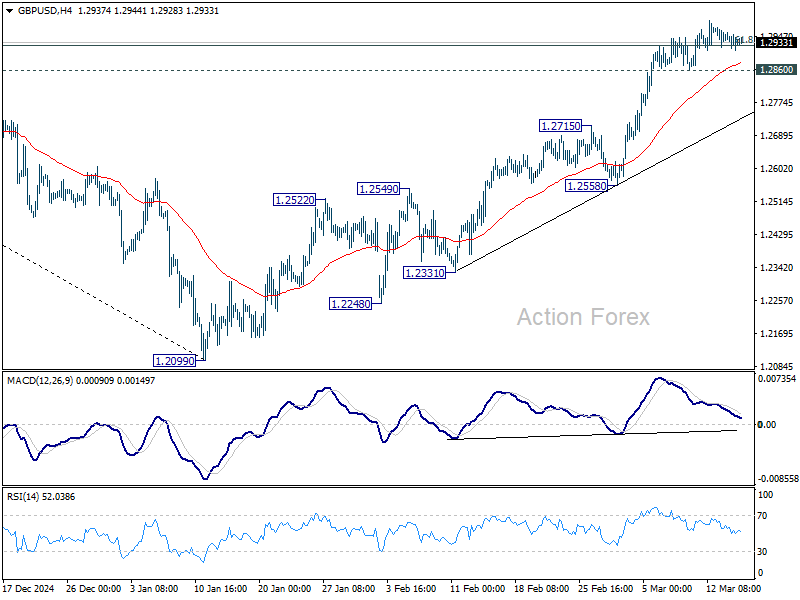
In the bigger picture, up trend from 1.3051 (2022 low) is not completed. Resumption is expected after corrective pattern from 1.3433 completes. Next target will be 1.4248 key resistance. This will now remain the favored case as long as 1.2099 support holds.
USD/CHF Daily Outlook
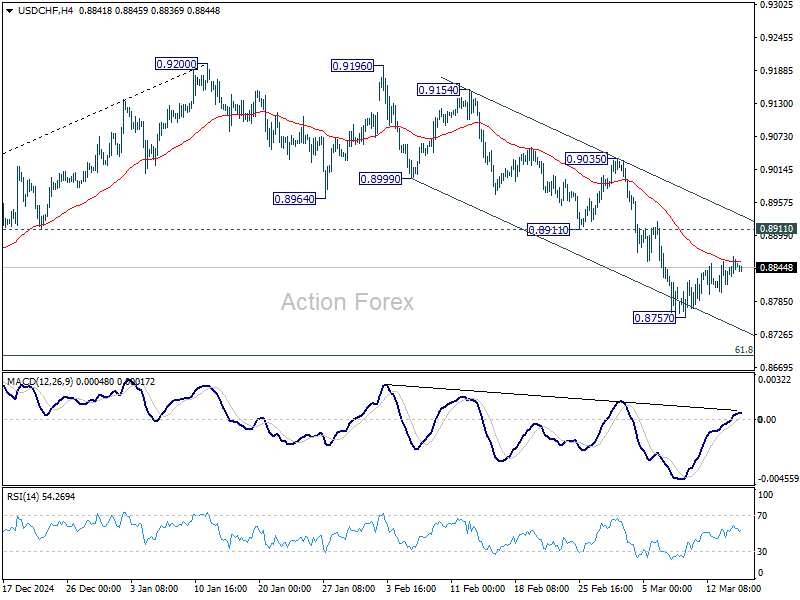
Daily Pivots: (S1) 0.8823; (P) 0.8844; (R1) 0.8871; More…
Intraday bias in USD/CHF remains neutral and consolidations would continue above 0.8757. Upside of recovery should be limited by 0.8911 support turned resistance. On the downside, break of 0.8757 will resume the fall from 0.9200 to 61.8% retracement of 0.8374 to 0.9200 at 0.8690. Sustained break there will pave the way back to 0.8374 support.
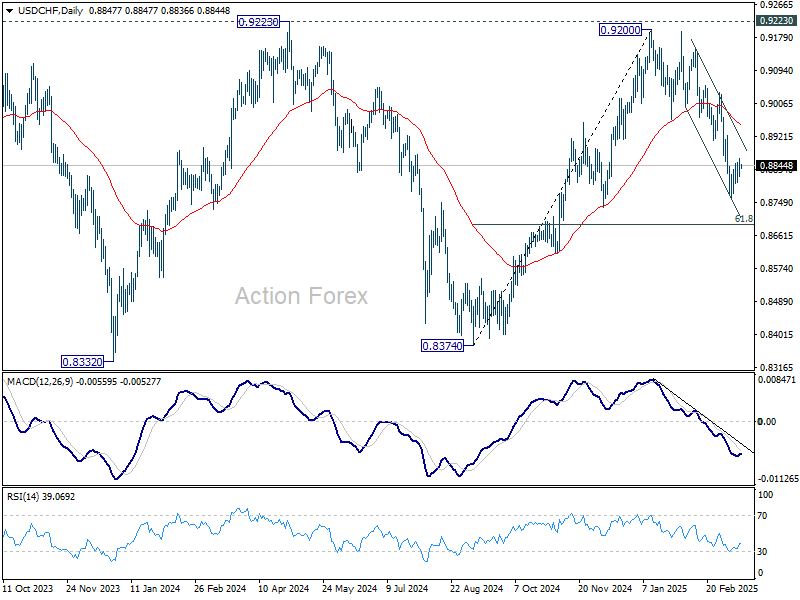
In the bigger picture, rejection by 0.9223 key resistance keep medium term outlook bearish. That is, larger fall from 1.0342 (2017 high) is not completed yet. Firm break of 0.8332 (2023 low) will confirm down trend resumption.
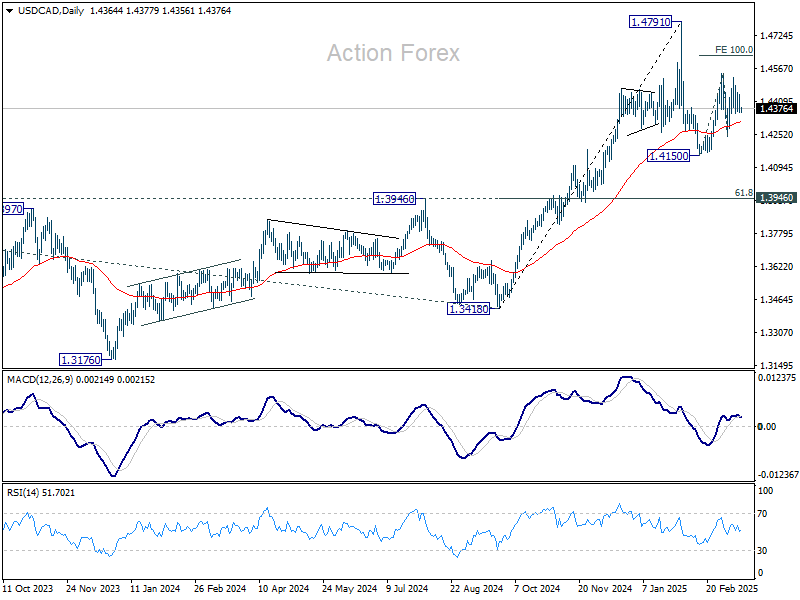
USD/CAD Daily Outlook
Daily Pivots: (S1) 1.4323; (P) 1.4399; (R1) 1.4442; More...
Intraday bias in USD/CAD remains neutral as range trading continues. Price actions from 1.4150 are seen as the second leg of the corrective pattern from 1.4791 high. On the upside, break of 1.4541 will target 100% projection of 1.4150 to 1.4541 from 1.4238 at 1.4629. On the downside, however, break of 1.4238 support will argue that the third leg has already started. Intraday bias will be back on the downside for 1.4150 and below.
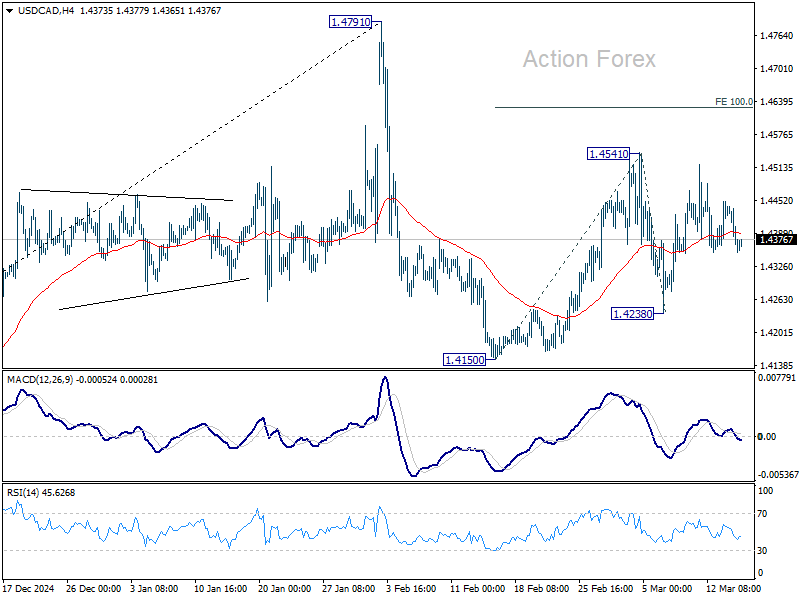
In the bigger picture, long term up trend is tentatively seen as resuming with prior breach of 1.4667/89 key resistance zone (2020/2015 highs). Next target is 100% projection of 1.2401 to 1.3976 from 1.3418 at 1.4993. This will remain the favored case as long as 1.3976 resistance turned support holds (2022 high), even in case of deep pullback.
Global FX: A Sudden and Decisive Change in Sentiment
The past month has seen an abrupt turn in sentiment towards the US economy and the US dollar. Whereas a month ago, the market seemed convinced the US dollar would move higher from its already historically-elevated level of 108 on a DXY basis. Now debate surrounds whether the US dollar can even hold onto its current, lower level of 103.8.
What’s changed? We certainly have not seen an end to uncertainty around US trade policy. The initial month-long grace given to Canada and Mexico was followed by another partial reprieve to April 2, but the second deferral was paired with a promise that this would be the last.
Tariffs for steel and aluminium were subsequently brought forward from April 2 to March 12 with no exemptions. China was also hit with another 10% tariff increase and Europe warned it would soon face additional measures above those for steel and aluminium, which it has retaliated against.
With the US facing entrenched capacity constraints as well as tariffs, the outlook for US inflation remains troubling, keeping interest rate risks skewed to the upside, which is supportive of term interest rates and the US dollar. What has flipped the market’s view on the US dollar is instead the growth outlook, both in absolute and relative terms.
On an absolute basis, as detailed on page 17 of our March Market Outlook, incoming data for early-2025 is materially weaker than experienced through 2023 and 2024. GDP is forecast to decline in Q1 by the Atlanta Federal Reserve’s GDPNow nowcast but, as this outcome is the consequence of a one-off pull-forward of imports to get ahead of tariffs, the truer signal is the halving of domestic demand growth to a pace well below trend.
Business surveys also point to downside risks to the currently balanced state of the labour market. This is before we see any hit to job creation from DOGE’s initiatives and a pull-back by state and local governments, let alone if activity in the housing market and consumer demand continues to soften.
The reversal in growth expectations has been as acute for the Euro Area, but in the opposite direction. A potential loss of US military support for Ukraine has this month triggered an expectation that the Continent’s governments will materially increase defence spending. Mooted plans to also increase infrastructure expenditure in Germany was also well received. Other sectors of the economy remain under considerable pressure and at risk of shocks, but still Euro Area growth is likely to return to around trend in 2026 and remain there, in contrast to the below-trend outcomes of 2023 and 2024.
Broadly, we agree with the market’s take on recent data and expectations going forward. So, in light of participants’ change of heart, we expect further weakness in the US dollar through 2025 and 2026. Q2 is likely to be an exception however, with fear over the implementation of tariffs and consequent inflation, plus evidence the US is not entering recession, to see a partial reversal in favour of the US dollar.
From spot at 103.8, we therefore see the US dollar DXY index rising briefly to 105.7 at June, then back to the current level at September and 102.6 come December. A continued gradual decline in the DXY index is then expected through 2026, to 98.9 at December 2026 and 97.8 at June 2027. Underlying the dollar view are broad-based gains for Euro, Sterling and Yen as well as CAD – in time.
However, it is important to recognise that the forecast gains for each of these currencies sees them back near average levels – at best. If the US economy deteriorates to a greater extent than we anticipate, i.e. the economy stalls or recession ensues, there is plenty of downside risk for the US dollar and blue sky for the other side of each bilateral rate.
Arguably, these risks are likely to be most prominent in the coming three-to-six months as US tariffs are implemented, retaliated against and the consequences are progressively felt. This is also the time when the effect of changes to US immigration will also begin to be seen – a negative for growth and an additional source of inflation.
While not immediately relevant to the DXY outlook, the resilience of the Asian growth and investment story has the potential to create an environment conducive to a weaker US dollar.
Chinese authorities have made it clear they will support domestic growth as much as necessary and that they are also committed to aiding economic development across the Asian region. Much of the region is also aware of the risks US tariffs pose and intent on preserving their growth pulses. As they prove able to do so, they incentivise capital transfers from the ‘safe-harbour’ of the US dollar.
While we suspect it will take time, the countries of Asia therefore have the greatest capacity to outperform the DXY trend. China’s Renminbi, which we expect to fall from CNY7.24 to CNY6.80 at June 2027 against the dollar, and India’s Rupee, from INR 87.0 today to INR79.0, are best positioned, but countries like Indonesia and Thailand also have the capacity to leverage windfalls from manufacturing and services – tourism in particular. South Korea, Taiwan and Japan are more likely to get caught up in geopolitical and trade uncertainty, and have less flexibility domestically to offset.
This analysis first appeared in Westpac Economics’ March Market Outlook. The full detail of our FX, interest rate and economic forecasts for the world can be found on pages 23–30 of the publication.
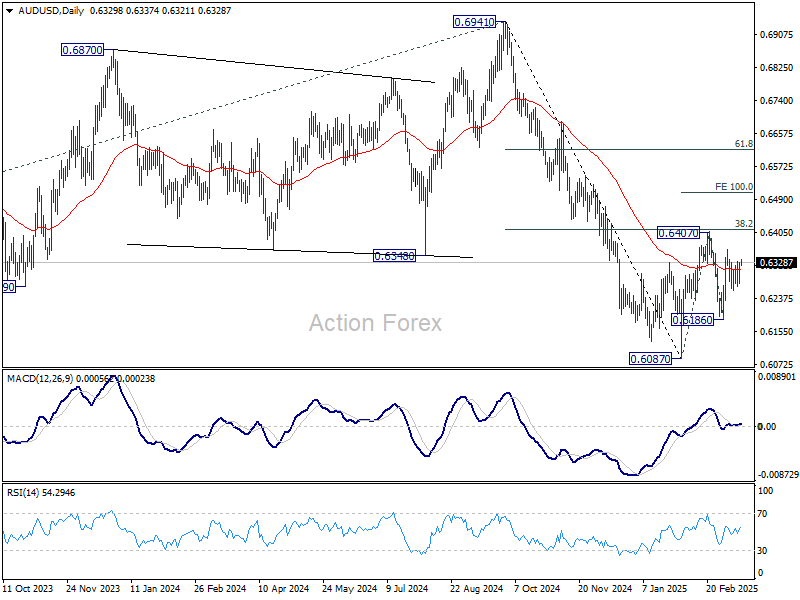
AUD/USD Daily Report
Daily Pivots: (S1) 0.6292; (P) 0.6312; (R1) 0.6345; More...
Intraday bias in AUD/USD remains neutral first as range trading continues. On the downside, break of 0.6186 will target 0.6087 support first. Firm break there will resume whole decline from 0.6941. On the upside, sustained break of 0.6407 will resume the rebound from 0.6087 to 100% projection of 0.6087 to 0.6407 from 0.6186 at 0.6506, even still as a corrective move.
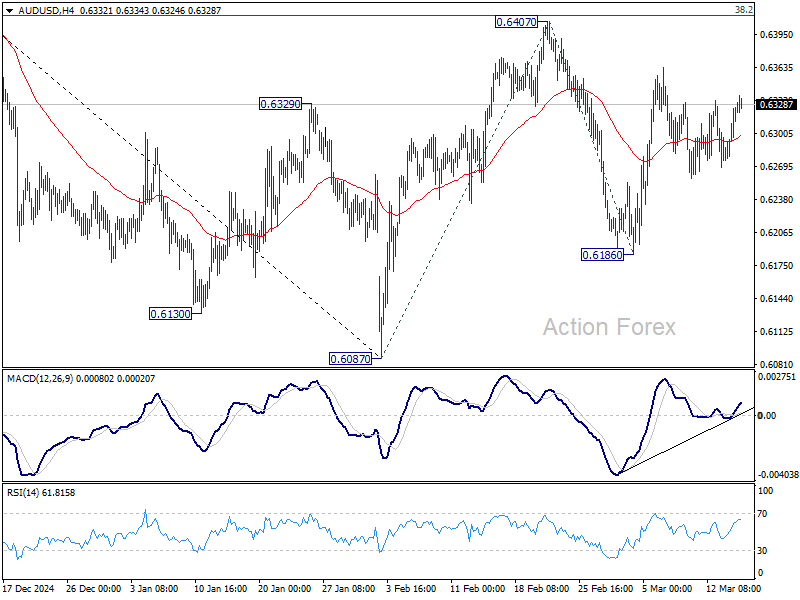
In the bigger picture, fall from 0.6941 (2024 high) is seen as part of the down trend from 0.8006 (2021 high). Next medium term target is 61.8% projection of 0.8006 to 0.6169 from 0.6941 at 0.5806. In any case, outlook will stay bearish as long as 55 W EMA (now at 0.6482) holds.