Sample Category Title
China Stimulus Fuels Asian Rally, But Market Caution Persists on US Outlook
Asian markets opened the week on a positive note, buoyed by stronger-than-expected economic data from China and optimism surrounding Beijing’s latest efforts to boost domestic consumption. Investors welcomed China’s “special action plan” aimed at stimulating household spending, which aligns with Premier Li Qiang’s government report last week that named consumption growth as a top priority. The latest measures also follow commitments from financial regulators to ease consumer credit quotas and loan terms, signaling a broad push to inject liquidity into the economy and support consumer demand.
While the plan does not appear to introduce any groundbreaking new policies, its classification as an “action plan” suggests that concrete steps at the local level will soon follow. Given past challenges in reviving domestic demand, this structured approach offers hope that implementation will be more effective than previous, less-defined efforts. Investors appear to be cautiously optimistic that China’s stimulus measures will help stabilize growth, particularly amid continued weakness in real estate and private investment.
Meanwhile, US futures are trending lower, reflecting growing fears of an impending economic slowdown. Treasury Secretary Scott Bessent’s remarks over the weekend did little to reassure investors, as he acknowledged that there are "no guarantees" the US will avoid a recession. While Bessent emphasized the need to transition away from excessive government spending, his comments about market corrections being “healthy” and his dismissal of recent stock market losses failed to inspire confidence. His focus on tax policy, deregulation, and energy security was seen as a long-term strategy rather than an immediate remedy for economic concerns.
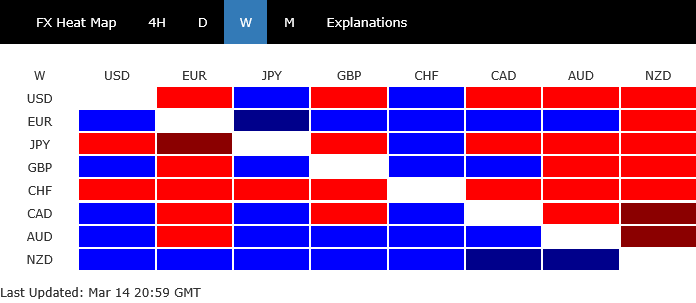
On the currency front, New Zealand Dollar is currently the strongest performer this month, despite today’s weaker services data. Swiss Franc follows behind, while Australian Dollar takes the third spot. On the weaker side, Canadian Dollar sits at the bottom, trailed by Dollar and British Pound. Meanwhile, Euro and Yen are positioned in the middle.
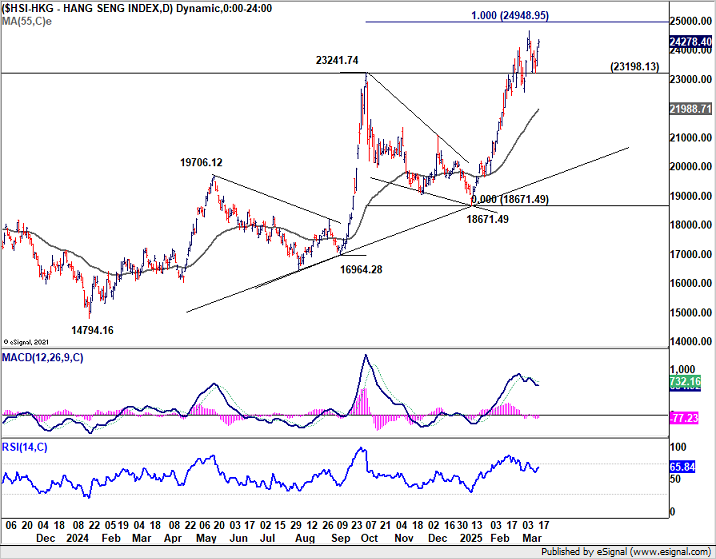
Technically, while Hong Kong’s HSI gains today, the broader picture suggests upside momentum is fading, as seen in D MACD. Current rally from 18671.49 may extend higher, but strong resistance is expected around the 25K psychological level, which coincides with 100% projection of 16964.28 to 23241.74 from 18671.49 at 24948.95. Break of 23198.13 support will argue that the a near term correction has already started back to 55 D EMA (now at 21988), or 22k in short.
In Asia, at the time of writing, Nikkei is up 1.21%. Hong Kong HSI is up 1.37%. China Shanghai SSE is up 0.28%. Singapore Strait Times is up 0.84%. Japan 10-year JGB yield is down -0.011 at 1.517.
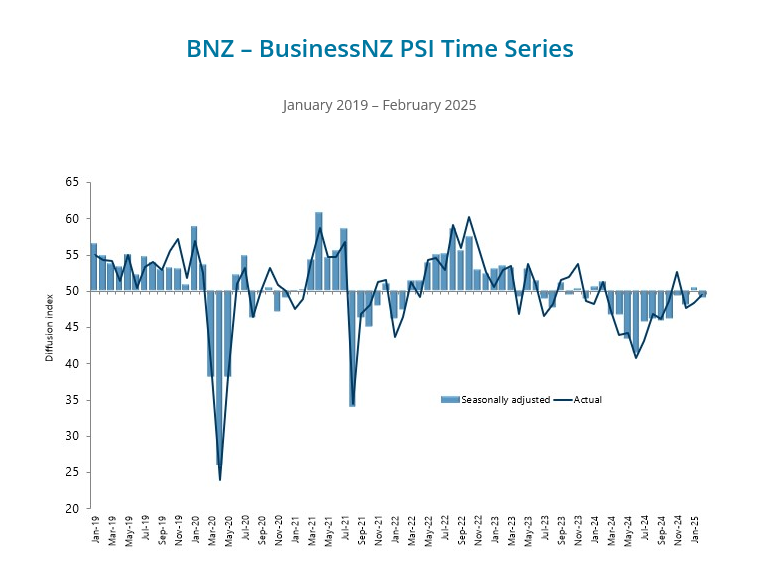
NZ BNZ services falls to 49.1, slips back into contraction
New Zealand’s BusinessNZ Performance of Services Index fell back into contraction territory in February, dropping from 50.4 to 49.1. The index remains well below its long-term average of 53.0.
Key components of the survey also showed deterioration, with Activity/Sales slipping from 53.8 to 49.2, New Orders/Business falling from 50.0 to 49.4, and Stocks/Inventories declining from 50.0 to 48.0. While Employment showed a slight improvement, rising from 47.4 to 48.9, it remains in contraction.
Despite the sector’s renewed contraction, negative sentiment among businesses showed a modest improvement, with 57.8% of comments in February expressing pessimism, down from 61.9% in January. Most firms cited the challenging economic climate as their primary concern.
BNZ’s Senior Economist Doug Steel said that “while one might have hoped that the PSI would move higher again, we know that economic turning points can be messy. The brief foray above 50 in January remains the only month in the last year the PSI hasn’t been in contraction”.
China’s data shows resilient start in 2025, government unveils plan to boost consumption
China’s economy got off to a stronger-than-expected start in the first two months of the year. Industrial production grew 5.9% yoy, beating market expectations of 5.3% yoy. Retail sales also exceeded forecasts, rising 4.0% yoy compared to an expected 3.8% yoy, reflecting improving consumer demand.
Meanwhile, fixed asset investment increased by 4.1% yoy, surpassing projections of 3.2% yoy, but ongoing weaknesses in the real estate sector persisted, with property investment falling -9.8% yoy. Additionally, private investment remained flat, signaling that confidence among smaller businesses and private enterprises was subdued.
China’s National Bureau of Statistics noted that existing and new policies aimed at stimulating growth have begun to take effect, leading to steady expansion in the industrial and services sectors, improved investment, and stable employment conditions. Officials highlighted “new quality productive forces” as key drivers of momentum.
To further bolster domestic demand, China’s State Council unveiled a “special action plan” over the weekend, aiming to increase household incomes, introduce childcare subsidies, and reduce financial burdens to encourage consumption.
While the plan was widely circulated across local governments, it lacked concrete details on financial support for implementation, leaving uncertainties about its immediate impact.
ECB’s de Guindos: Trade and geopolitical risks make uncertainty worse than pandemic time
ECB Vice President Luis de Guindos expressed confidence that inflation is on track to reach the 2% target “the end of this year or the beginning of next." He added that “all indicators for services and underlying inflation are moving in the right direction.”
However, he warned that uncertainty in the global economy is "even higher than it was during the pandemic", with mounting geopolitical risks and shifting trade policies. A key concern is the more protectionist stance of the new US. administration, which de Guindos sees as a major departure from multilateral cooperation. "This is a very important change, and a big source of uncertainty," he warned.
Despite improving conditions—real wages rising, inflation easing, and financing conditions loosening—consumption in the Eurozone remains weak. De Guindos attributed this sluggish demand to consumer sentiment, noting that households are hesitant to spend due to fears about the medium-term economic outlook. "The possibility of a trade war or wider geopolitical conflict has an impact on consumer confidence," he noted.
On the fiscal front, de Guindos acknowledged the massive defense spending plans by European governments as "certainly a decision in the right direction”. Nevertheless, he cautioned that it’s too early to determine the full economic impact. While increased defense investment is likely to support growth, he believes it will have only a limited effect on inflation.
Four central banks take center stage amid global data deluge
Central bank policy decisions will dominate market attention this week, as Fed, BoJ, BoE and SNB each convene to set monetary policy. The announcements come against a backdrop of critical data releases, including inflation figures from Canada and Japan, employment reports from the UK and Australia, retail sales updates from the US and Canada, as well as GDP from New Zealand.
Fed is widely expected to hold rates steady at 4.25-4.50%, with virtually no chance of a surprise move. While markets anticipate no immediate change, there remains keen interest in the new economic projections. Back in December, the median forecast called for just two rate cuts by year-end, bringing the rate down to 3.75–4.00%. Any downward revision to this path would solidify expectations for a June cut, making it in line with Fed fund futures pricing. Additionally, by the end of 2027, Fed sees rates back at 3.00–3.25%, marginally above the longer-run neutral estimate at 3.00%. Markets will also watch whether Fed's new projections suggest faster pace of reaching neutral, which would in turn indicate a dovish turn on the economic outlook.
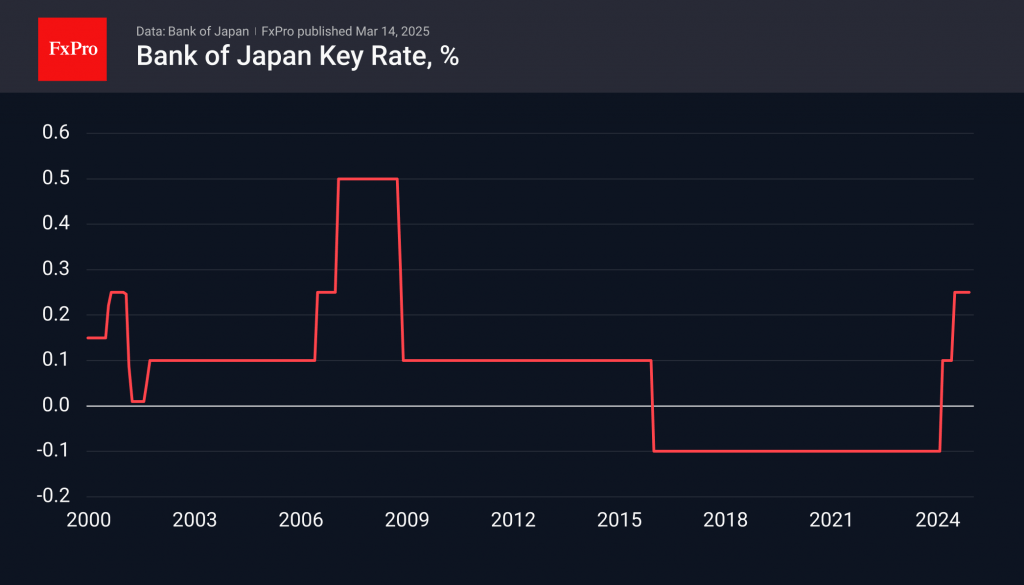
BoJ is also expected to hold rates steady at 0.50%, with 61 of 62 economists in a recent Reuters poll forecasting no change this week. poll. However, expectations are growing for a rate hike later this year, with 18 of 61 economists predicting a move to 0.75% in Q2, while 40 of 57 see it happening in Q3. The timing will largely depend on wage negotiations, which has so far been strong. Many of Japan’s largest corporations already met union demands for significant pay raises. This raises the possibility of an earlier-than-expected hike, and markets will be looking for any guidance from BoJ Governor Kazuo Ueda regarding the bank’s next steps.
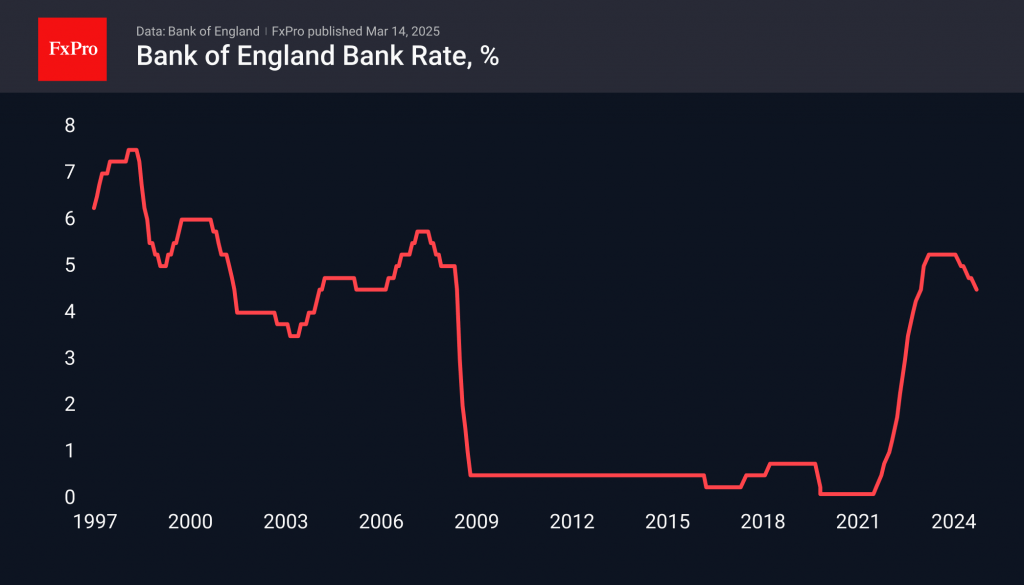
BoE will also hold rates steady at 4.50%, maintaining its measured approach of one 25bps cut per quarter. Inflation expectations remain sticky, with the latest BoE survey showing that five-year inflation expectations rose to 3.6% in February, up from 3.4% in November—the highest level since 2019. This could keep the majority of the MPC hesitant to ease policy further prematurely. The key question at this meeting will be whether more members join Catherine Mann and Swati Dhingra in voting for a more aggressive loosening of monetary policy.
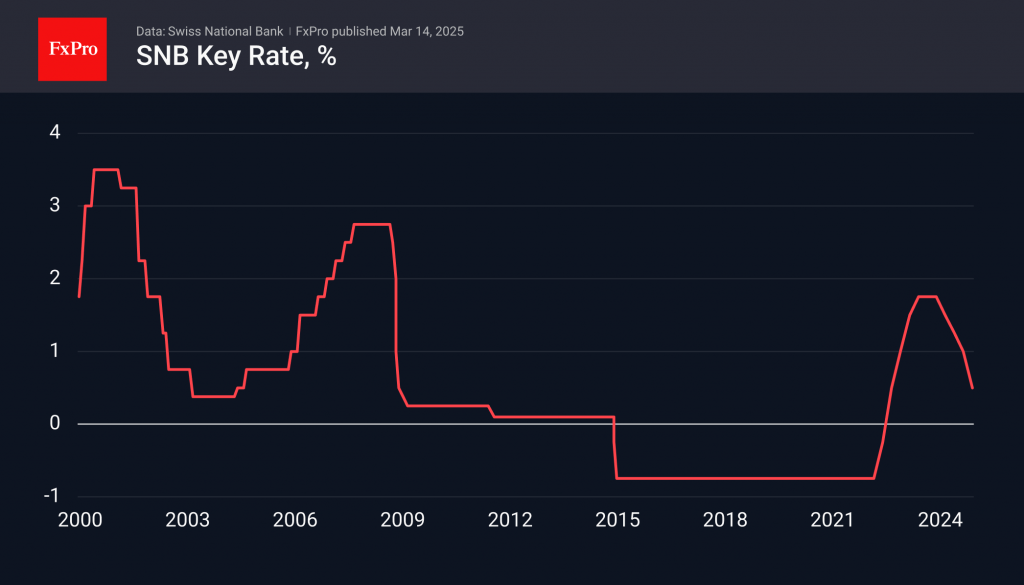
In contrast, SNB is forecast to cut its key policy rate by another 25bps, bringing it down to 0.25%. Swiss inflation dropped to just 0.3% in February, the lowest since April 2021, which strengthens the argument for another rate cut. With inflation now sitting at the lower end of the 0-2% target range, policymakers are likely to lower rates further to prevent a deflationary environment. Market expectations suggest that there is already a 20% probability that SNB will cut rates again in June, bringing interest rates down to 0%.
Here are some highlights for the week:
- Monday: New Zealand BNZ services; China industrial production, retail sales, fixed asset investment; Canada housing starts; US retail sales, Empire State manufacturing, business inventories, NAHB housing index.
- Tuesday: Japan tertiary industry index; Germany ZEW economic sentiment; Eurozone trade balance; Canada CPI; US housing starts and building permits, industrial production.
- Wednesday: New Zealand current account; Japan BoJ rate decision, trade balance, machine orders; Eurozone CPI final; Fed rate decision.
- Thursday: New Zealand GDP; Australia employment; SNB rate decision, Swiss trade balance; Germany PPI; BoE rate decision, UK employment; Canada IPPI and RMPI; US jobless claims, Philly Fed survey, current account, existing home sales.
- Friday: New Zealand trade balance; Japan CPI; UK Gfk consumer confidence; Eurozone current account; Canada retail sales, new housing price index.
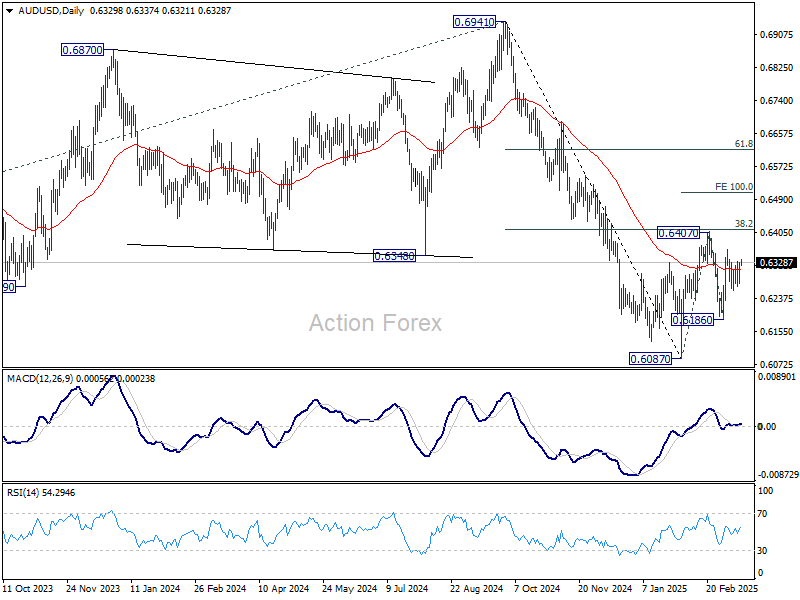
AUD/USD Daily Report
Daily Pivots: (S1) 0.6292; (P) 0.6312; (R1) 0.6345; More...
Intraday bias in AUD/USD remains neutral first as range trading continues. On the downside, break of 0.6186 will target 0.6087 support first. Firm break there will resume whole decline from 0.6941. On the upside, sustained break of 0.6407 will resume the rebound from 0.6087 to 100% projection of 0.6087 to 0.6407 from 0.6186 at 0.6506, even still as a corrective move.
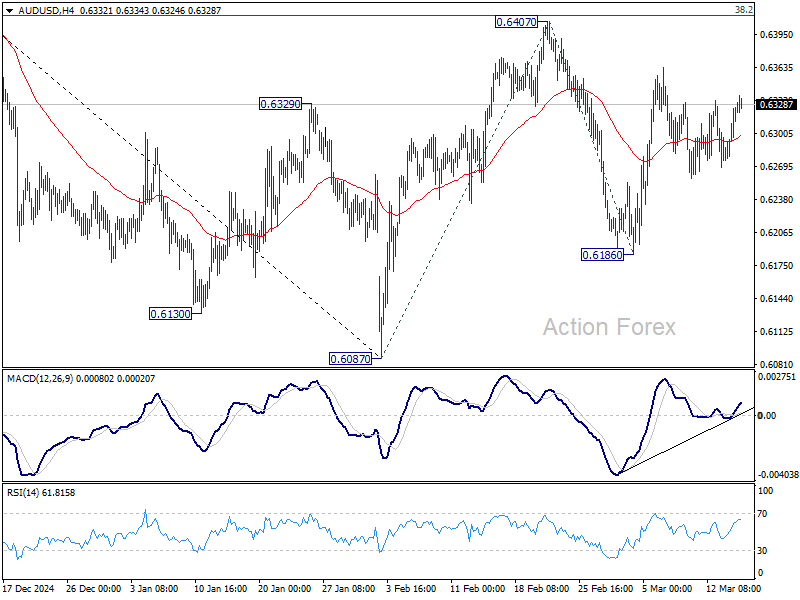
In the bigger picture, fall from 0.6941 (2024 high) is seen as part of the down trend from 0.8006 (2021 high). Next medium term target is 61.8% projection of 0.8006 to 0.6169 from 0.6941 at 0.5806. In any case, outlook will stay bearish as long as 55 W EMA (now at 0.6482) holds.
EUR/USD Consolidates Gains—Is More Upside In Sight?
Key Highlights
- EUR/USD started a fresh increase above the 1.0800 resistance.
- It traded below a short-term bullish trend line with support at 1.0880 on the 4-hour chart.
- GBP/USD is consolidating gains above the 1.2800 resistance zone.
- Gold surged to a record high and tested the $3,000 zone.
EUR/USD Technical Analysis
The Euro remained strong above 1.0750 against the US Dollar. EUR/USD formed a base and climbed above the 1.0800 resistance zone.
Looking at the 4-hour chart, the pair settled above the 1.0800 level, the 100 simple moving average (red, 4-hour), and the 200 simple moving average (green, 4-hour). The pair even tested the 1.0950 zone before it started a consolidation phase.
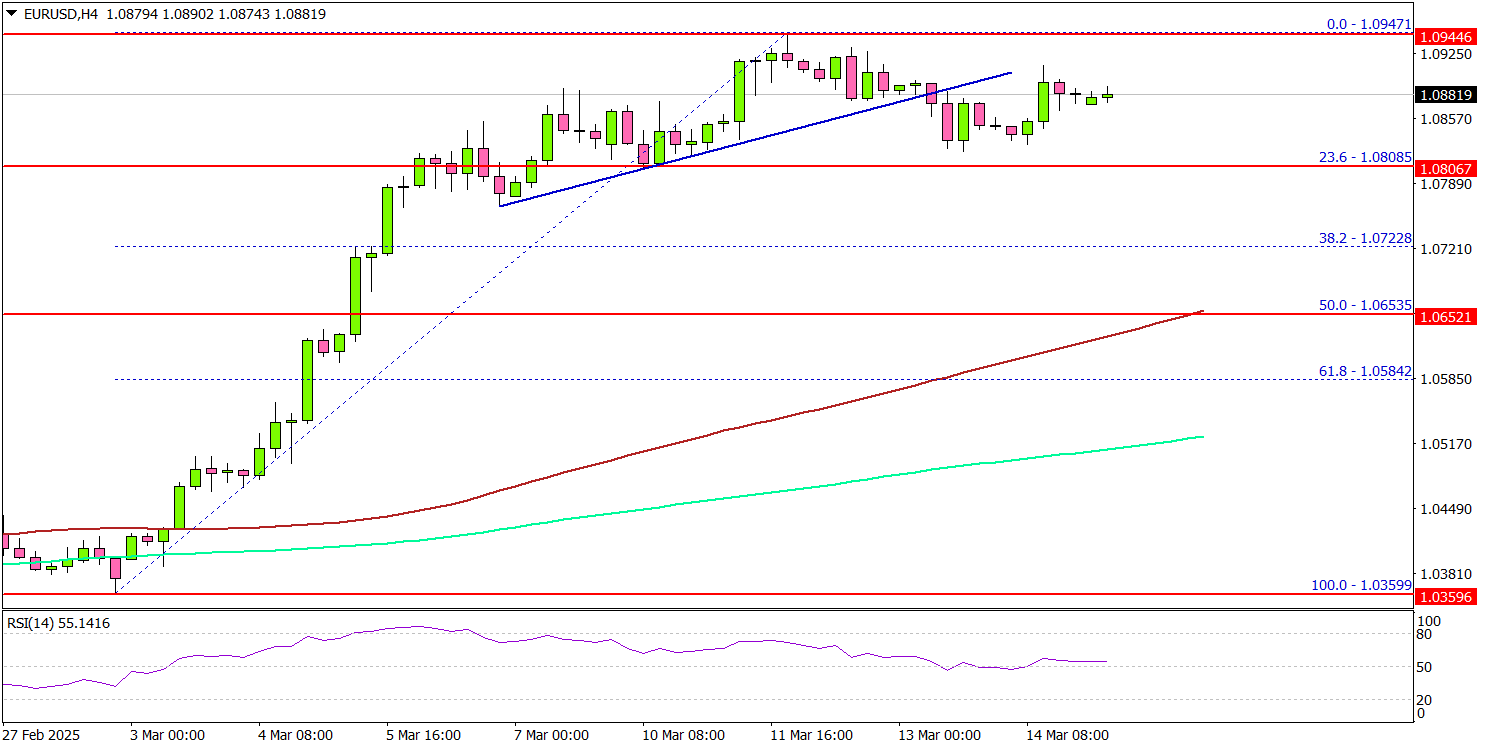
There was a move below the 1.0900 level. Besides, the pair traded below a short-term bullish trend line with support at 1.0880 on the same chart.
On the upside, the pair is facing resistance near the 1.0945 level. The next major resistance is near the 1.0965 level. The main resistance is now forming near the 1.0980 zone. A close above the 1.0980 level could set the tone for another increase. In the stated case, the pair could even clear the 1.1100 resistance.
On the downside, immediate support sits near the 1.0820 level. The next key support sits near the 1.0800 level. Any more losses could send the pair toward the 1.0765 level. The main support could be 1.0750.
Looking at GBP/USD, the pair remained stable and might soon now aim for a move toward the 1.3000 resistance.
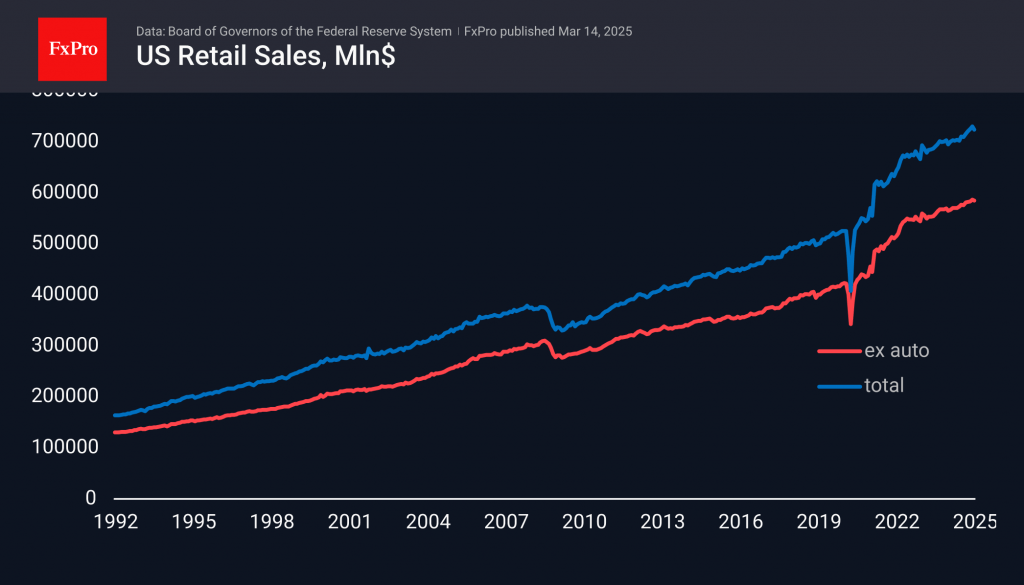
Upcoming Economic Events:
- US Retail Sales for Feb 2025 (MoM) – Forecast +0.7%, versus -0.9% previous.
China’s data shows resilient start in 2025, government unveils plan to boost consumption
China’s economy got off to a stronger-than-expected start in the first two months of the year. Industrial production grew 5.9% yoy, beating market expectations of 5.3% yoy. Retail sales also exceeded forecasts, rising 4.0% yoy compared to an expected 3.8% yoy, reflecting improving consumer demand.
Meanwhile, fixed asset investment increased by 4.1% yoy, surpassing projections of 3.2% yoy, but ongoing weaknesses in the real estate sector persisted, with property investment falling -9.8% yoy. Additionally, private investment remained flat, signaling that confidence among smaller businesses and private enterprises was subdued.
China’s National Bureau of Statistics noted that existing and new policies aimed at stimulating growth have begun to take effect, leading to steady expansion in the industrial and services sectors, improved investment, and stable employment conditions. Officials highlighted “new quality productive forces” as key drivers of momentum.
To further bolster domestic demand, China’s State Council unveiled a “special action plan” over the weekend, aiming to increase household incomes, introduce childcare subsidies, and reduce financial burdens to encourage consumption.
While the plan was widely circulated across local governments, it lacked concrete details on financial support for implementation, leaving uncertainties about its immediate impact.
NZ BNZ services falls to 49.1, slips back into contraction
New Zealand’s BusinessNZ Performance of Services Index fell back into contraction territory in February, dropping from 50.4 to 49.1. The index remains well below its long-term average of 53.0.
Key components of the survey also showed deterioration, with Activity/Sales slipping from 53.8 to 49.2, New Orders/Business falling from 50.0 to 49.4, and Stocks/Inventories declining from 50.0 to 48.0. While Employment showed a slight improvement, rising from 47.4 to 48.9, it remains in contraction.
Despite the sector’s renewed contraction, negative sentiment among businesses showed a modest improvement, with 57.8% of comments in February expressing pessimism, down from 61.9% in January. Most firms cited the challenging economic climate as their primary concern.
BNZ’s Senior Economist Doug Steel said that “while one might have hoped that the PSI would move higher again, we know that economic turning points can be messy. The brief foray above 50 in January remains the only month in the last year the PSI hasn’t been in contraction”.
ECB’s de Guindos: Trade and geopolitical risks make uncertainty worse than pandemic time
ECB Vice President Luis de Guindos expressed confidence that inflation is on track to reach the 2% target “the end of this year or the beginning of next." He added that “all indicators for services and underlying inflation are moving in the right direction.”
However, he warned that uncertainty in the global economy is "even higher than it was during the pandemic", with mounting geopolitical risks and shifting trade policies. A key concern is the more protectionist stance of the new US. administration, which de Guindos sees as a major departure from multilateral cooperation. "This is a very important change, and a big source of uncertainty," he warned.
Despite improving conditions—real wages rising, inflation easing, and financing conditions loosening—consumption in the Eurozone remains weak. De Guindos attributed this sluggish demand to consumer sentiment, noting that households are hesitant to spend due to fears about the medium-term economic outlook. "The possibility of a trade war or wider geopolitical conflict has an impact on consumer confidence," he noted.
On the fiscal front, de Guindos acknowledged the massive defense spending plans by European governments as "certainly a decision in the right direction”. Nevertheless, he cautioned that it’s too early to determine the full economic impact. While increased defense investment is likely to support growth, he believes it will have only a limited effect on inflation.
What Next: BoJ, Fed, SNB & BoE Rates
The new week will be packed with economic data and decisions from key central banks.
On Monday, US retail sales for February are expected to show a rebound after a disappointing January.
Early on Wednesday, the Bank of Japan’s key interest rate will be in focus. The consensus forecast is for it to remain at 0.5%. However, be prepared for unexpected decisions and sharp comments that could affect the Yen.

The focus will shift to the US at the end of Wednesday. The Fed is not expected to make any policy changes, but the investment world will be watching closely to see when the next easing will take place.
On Thursday morning, the Swiss Central Bank will release its quarterly interest rate decision. On average, analysts are predicting a 25-point cut to 0.25%, which would be a three-year low.
On Thursday afternoon, the Bank of England will release its interest rate decision. Following February’s cut, it is expected to be unchanged this time. However, Friday’s batch of weak macroeconomic data could strengthen the position of the doves on the committee.
Dollar Attempts to Rebound After Oversold Conditions
The dollar took a breather this week after a massive sell-off earlier in the week.
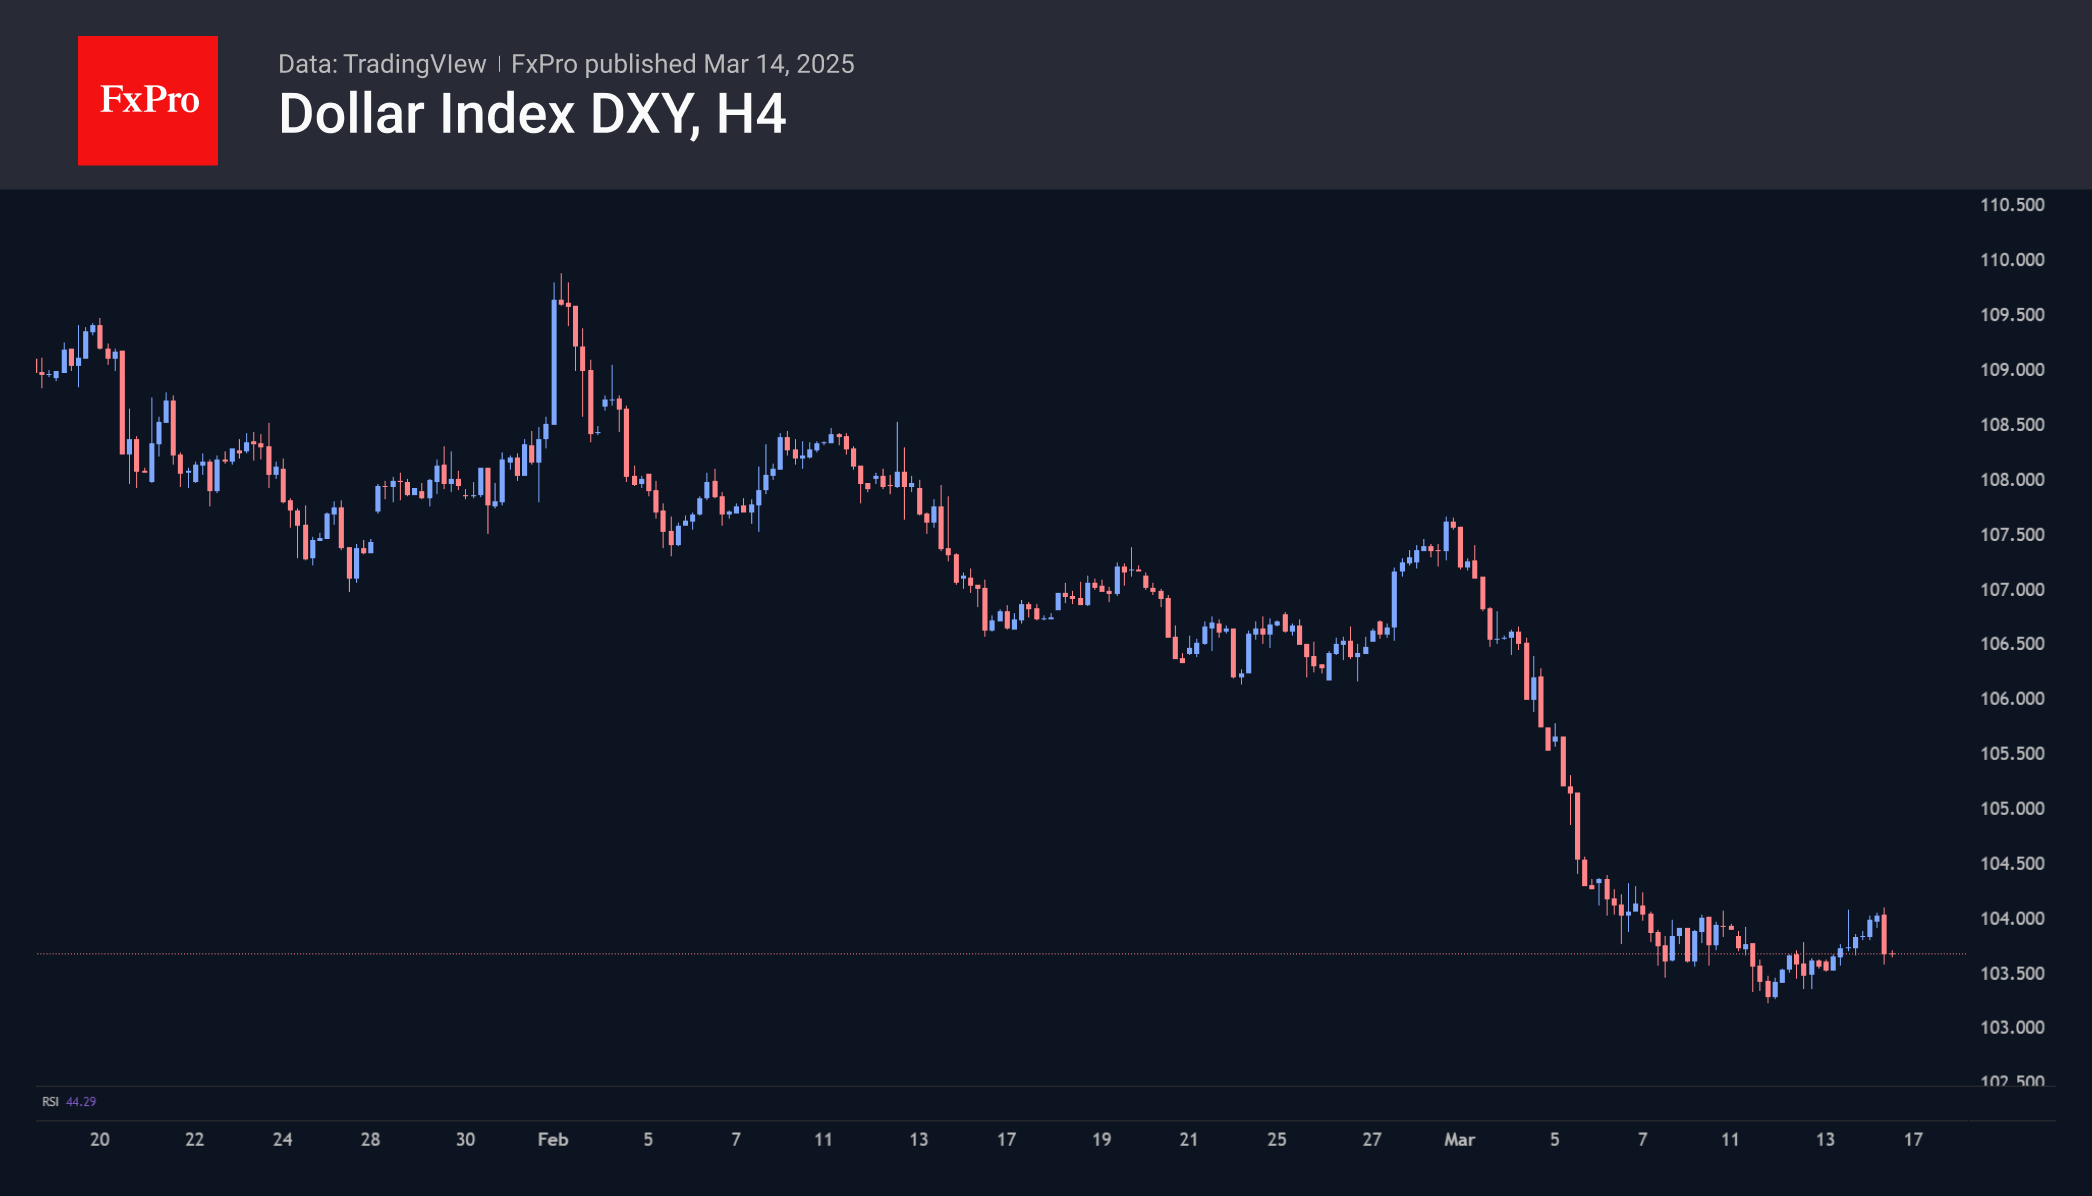
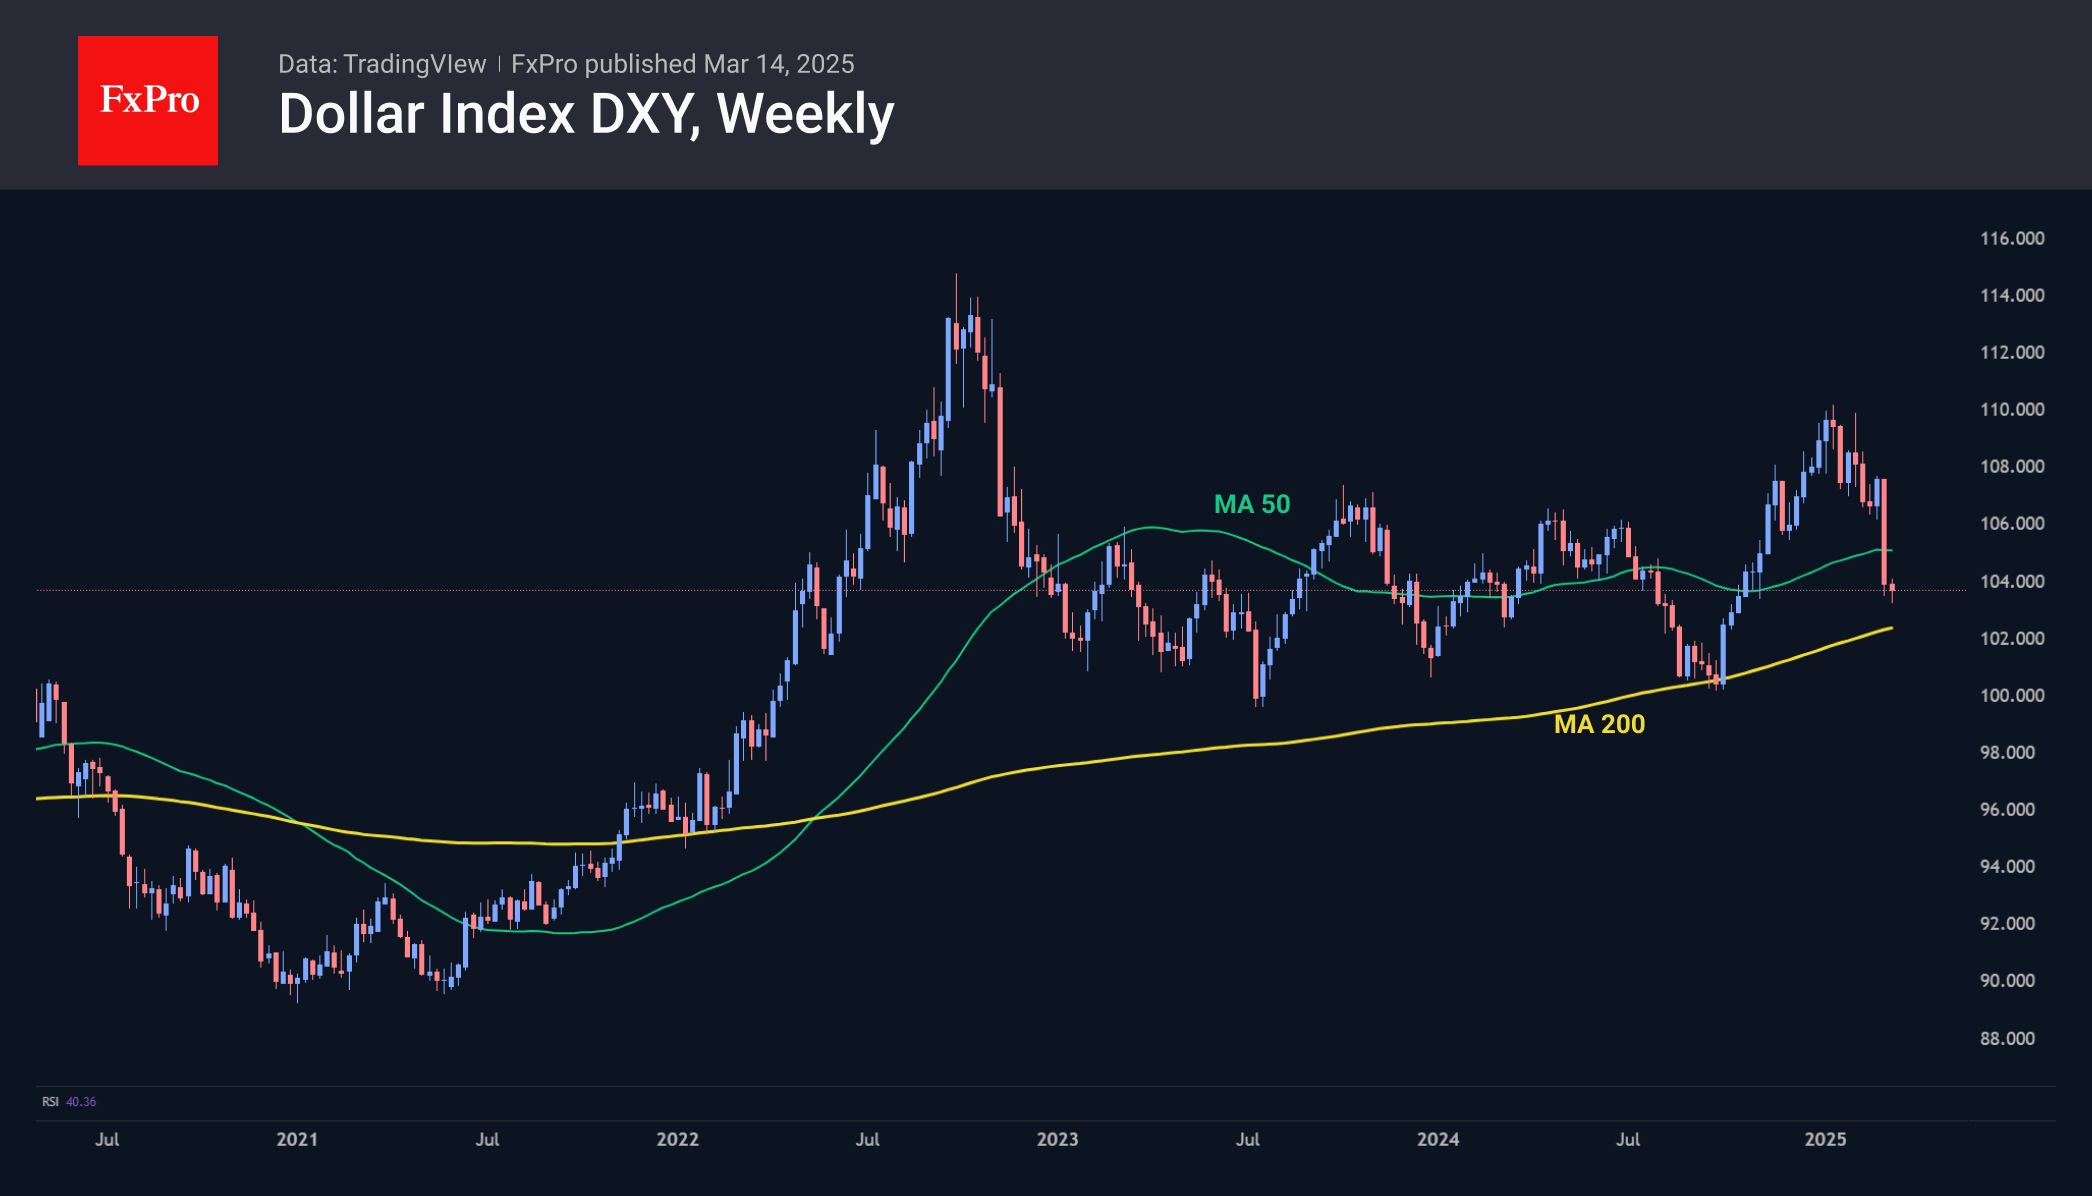
The DXY bottomed out at 103, the low it hit before Trump’s election victory. However, by the end of the week, it had rallied back to 104.
The accumulated oversold condition gives room for a bounce, but there’s also a chance that the situation could quickly develop into a new dollar momentum.
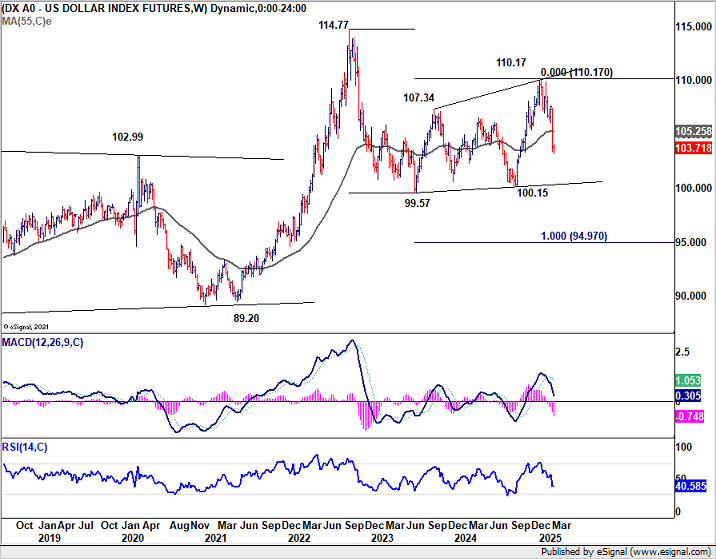
Over the past three years, the Dollar Index has reversed to the upside on drawdowns near the 200-week moving average. It is now above 102.2. The dollar reversed to the upside twice in similar conditions in 2023 and briefly dipped lower in 2024.
Dollar Index has reversed to the upside on drawdowns near the 200-week moving average
Interestingly, the changing fundamental backdrop has been working against the dollar all along. Slowing job growth and cooling inflation worked against the dollar as the date for a rate cut approached. However, this did not prevent the dollar, which had become overbought in previous weeks, from rising.
Currency Markets Consolidate as Trader Start Repositioning for Tariff Battles in April
The past week in the currency markets was marked more by consolidation than decisive moves, even as risk aversion deepened in US stock markets. Dollar’s selloff slowed and turned into a modest recovery, but there was no clear momentum for bullish trend reversal. Sentiment remained fragile, weighed down by constantly escalating trade tensions and the growing impact of tariffs on American consumer and business confidence. However, with stocks and Dollar both looking oversold, markets appear to have found a temporary reprieve, allowing for some short-term stabilization.
That said, this pause does not indicate a shift in sentiment, but rather reflects a phase of profit-taking and repositioning. Traders seem to be adjusting their positions ahead of the critical tariff showdown in April, when reciprocal trade measures on key US trading partners are expected to take effect. As markets brace for the next wave of developments, uncertainty and indecisiveness have become dominant themes. This is evident in the fact that only three currency crosses closed outside their prior week's ranges, highlighting a lack of conviction in directional moves.
Among the currency performers, New Zealand Dollar overtook Euro at last hours as the week’s strongest, but its gains lacked clear momentum for a sustained uptrend. Australian Dollar, which came in third, and Kiwi appeared to be mostly digesting their recent losses, aided by a modest stabilization in risk sentiment.
While these currencies showed some resilience, they have yet to break out of their broader downtrends, and further gains will likely depend on how global markets react to the next round of trade developments.
Euro, despite slipping to second place, could soon regain momentum, especially as Germany’s major political parties reached a breakthrough on a historic debt deal.
On the weaker side, Japanese Yen, Swiss Franc, and Dollar ranked as the bottom three performers. Meanwhile, Sterling and Canadian Dollar closed the week in the middle of the pack
Stocks Sink for the Week Despite Friday’s Rebound, April Set to Be Crucial
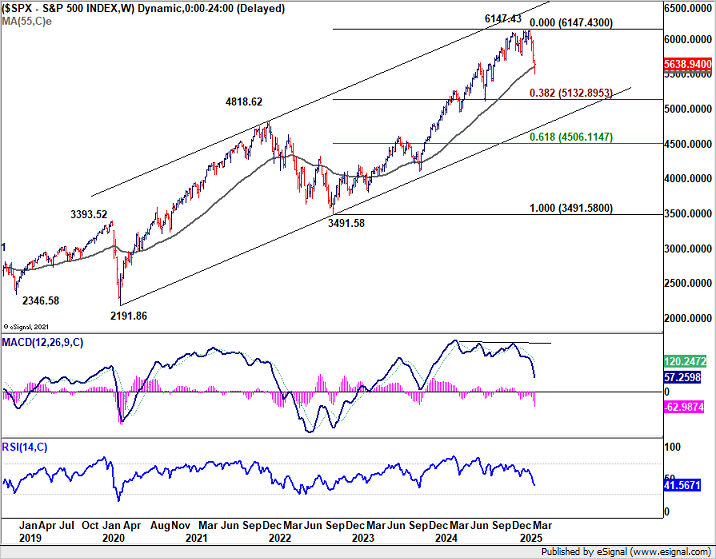
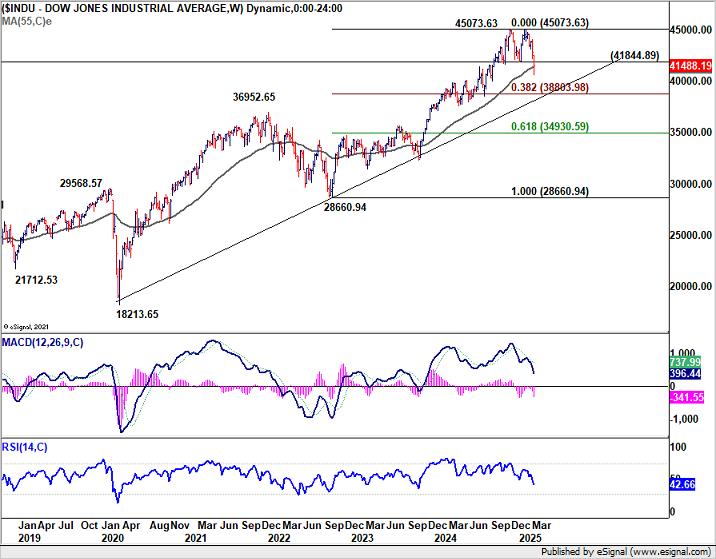
US stocks suffered significant losses last week, with DOW plummeting -3.1% for its worst weekly performance since March 2023. Both S&P 500 and NASDAQ also slipped more than -2% and notched their fourth consecutive week in the red. While a strong rebound on Friday briefly lifted spirits—becoming the best single day of 2025 for S&P 500 and NASDAQ—these gains were insufficient to salvage the broader downtrend that has gripped the market.
Friday’s bounce appeared to be more of a technical rebound than a shift in fundamentals. With the major indices down 10% from their all-time highs, markets had reached oversold conditions, making them ripe for short traders to take profits. However, the broader narrative remains bearish, at least for the near term. .
Tariff uncertainties will continue to cap upside momentum in stocks, at least through April. The critical turning point would come on April 2, when reciprocal tariffs from US are set to be announced. The corresponding retaliatory measures from the European Union, Canada, China, and Japan—and the potential for further US escalation in response—will dictate how deep the economic impact may run. The developments in the second quarter will ultimately determine whether the US markets are in merely a medium-term correction or entering an outright bear market.
For S&P 500, fall from 6147.43 is currently seen as a correction to the up trend from 3491.58 (2022 low) only. While further decline remains in favor, downside should be contained by 38.2% retracement of 3491.58 to 6147.43 at 5132.89.
However, firm break of 5132.89 will raise the chance of long term reversal, and target trend line support (now at around 4740).
Similarly, DOW should now be in correction to the whole rally from 28660.94 (2022 low). While further fall is expected, downside should be contained by 38.2% retracement of 28660.04 to 45703.63 at 38803.98. However, sustained break of this fibonacci level will argue that larger scale reversal is underway.
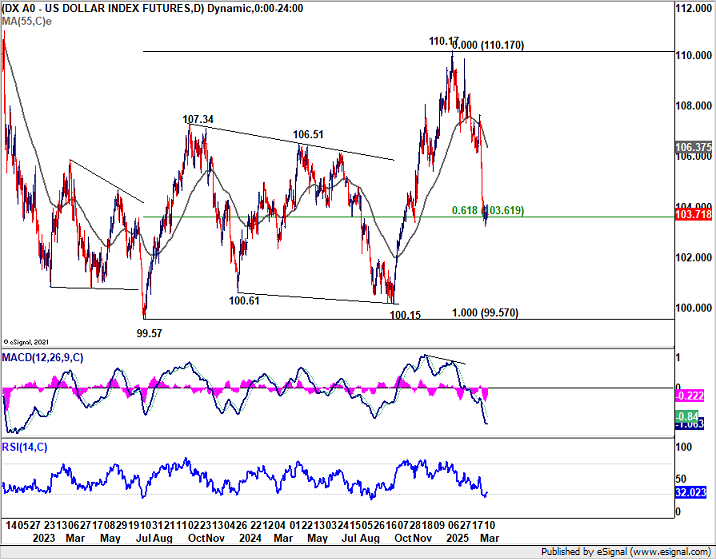
Dollar Index May Stabilize Around 61.8% Retracement Level, But Downside Risks Remain
The sharp decline in Dollar Index slowed last week, as market expectations for Fed’s next rate cut have shifted back from May to June. Despite softer-than-expected consumer inflation data, traders are acknowledging that Fed will likely need more time to assess the economic impact of escalating tariffs before making a policy move.
June FOMC meeting offers the central bank a broader window to evaluate the full effects of reciprocal trade measures and any additional retaliatory tariffs. Additionally, Fed will have a fresh set of economic projections by then, providing a more comprehensive view of inflation, growth, and labor market trends.
Technically, Dollar Index is now hovering around 61.8% retracement of 99.57 to 110.17 at 103.61. This level could provide some short-term stabilization, particularly as D RSI also suggests oversold conditions. Some consolidations might follow first, or even a notable recovery.
However, risks will continue to stay on the downside as long as 55 D EMA (now at 106.37) holds. Sustained break of 103.61 will extend the fall from 110.17 to 99.57 low (2023 low).
Eurozone Confidence Surges, DAX and Euro Poised for Further Gains
Euro and Germany’s DAX lost some momentum last week, but Friday’s bounce suggests both may be gearing up to extend their recent rallies.
In a major political breakthrough, Chancellor-in-waiting Friedrich Merz announced on Friday that he had secured the backing of the Greens for a massive increase in state borrowing. With support from the Social Democrats already in place, Merz now has the two-thirds parliamentary majority required to pass constitutional amendments.
The highly anticipated vote is scheduled for next week and, if approved, would mark a historic shift in Germany’s fiscal policy, paving the way for significant infrastructure and defense spending.
Merz’s declaration that "Germany is back" highlighted the renewed optimism surrounding both the German and broader European economies.
This growing confidence is also reflected in recent sentiment indicators. Eurozone Sentix Investor Confidence Index surged from -12.7 to -2.9 in March, reaching its highest level since June 2024. More notably, Expectations Index skyrocketed from 1.0 to 18.0, marking its third consecutive monthly increase and the highest level since July 2021. This surge represents the largest monthly improvement since 2012.
Germany’s investor confidence has also rebounded sharply, signaling a significant turnaround in market expectations. The German Sentix Investor Confidence Index jumped from -29.7 to -12.5, its strongest level since April 2023. Meanwhile, the Expectations Index surged from -5.8 to 20.5, reaching its highest point since July 2021.
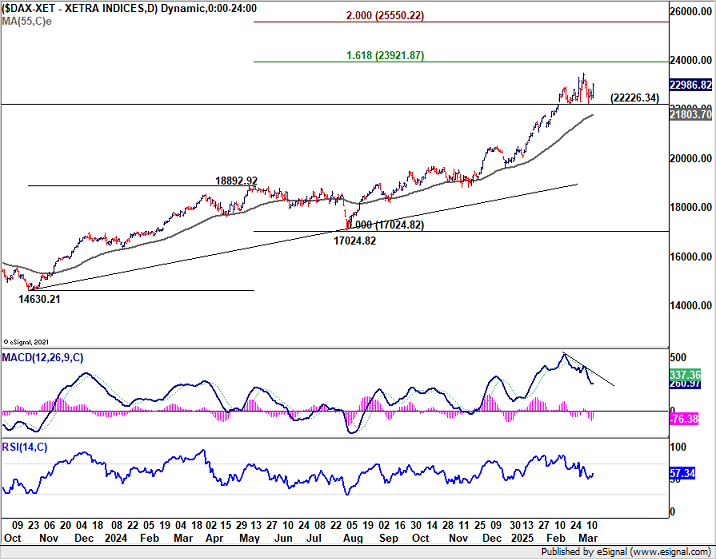
For DAX, near term outlook stays bullish with 22226.34 support intact. Current trend should continue to 161.8% projection of 14630.21 to 18892.92 from 17024.82 at 23921.87. Decisive break there would pave the way to 200% projection 25550.22 next.
Nevertheless, rejection by 23921.87 will indicate medium term topping, on bearish divergence condition in D MACD. DAX should then turn into consolidations, until fresh catalyst pushes it through to new records.
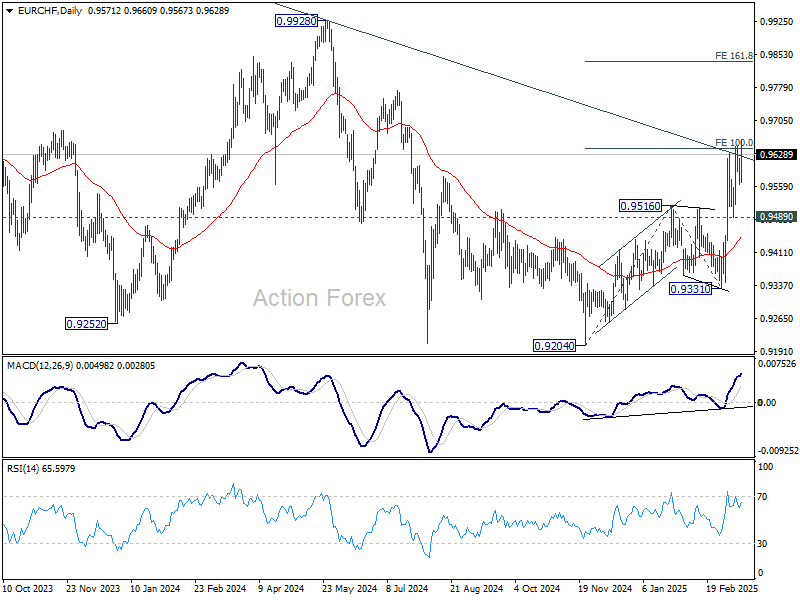
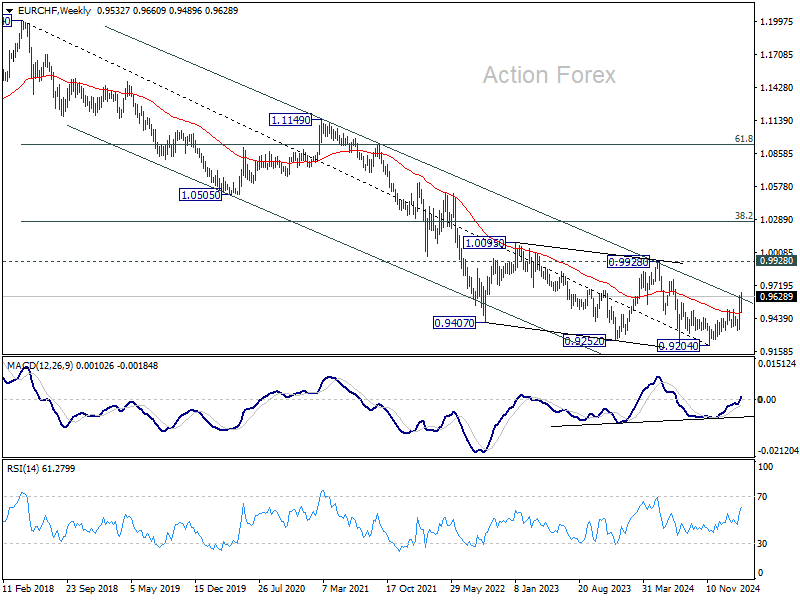
The key for Euro remains on whether EUR/CHF could decisively break through the long term channel resistance to solidify its bullish trend reversal. In this case, stronger rally should be seen to 0.9928 resistance at least.
However, break of 0.9489 support will suggest rejection by the channel resistance, and keep outlook bearish for EUR/CHF, which might also be an indication of Euro's outlook elsewhere.
NZD/JPY as a Top Gainer, But Bearish Trend Remains Intact
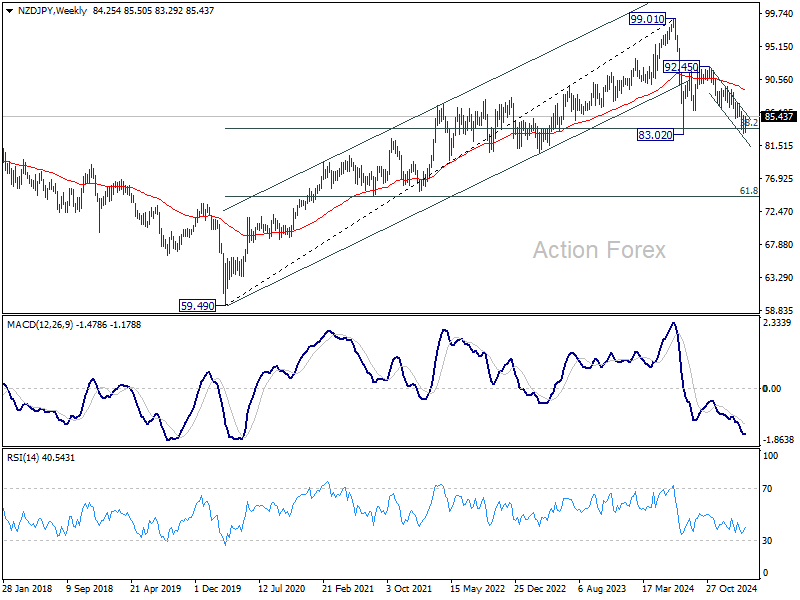
NZD/JPY was among the top-performing currency pairs last week, rising by over 1.1%. However, the crosses continued to trade within falling channel that originated from 92.45 high. It's also capped well below 55 D EMA (now at 86.45).
Thus, while the current rebound signals some near-term buying interest, the broader technical picture remains bearish.
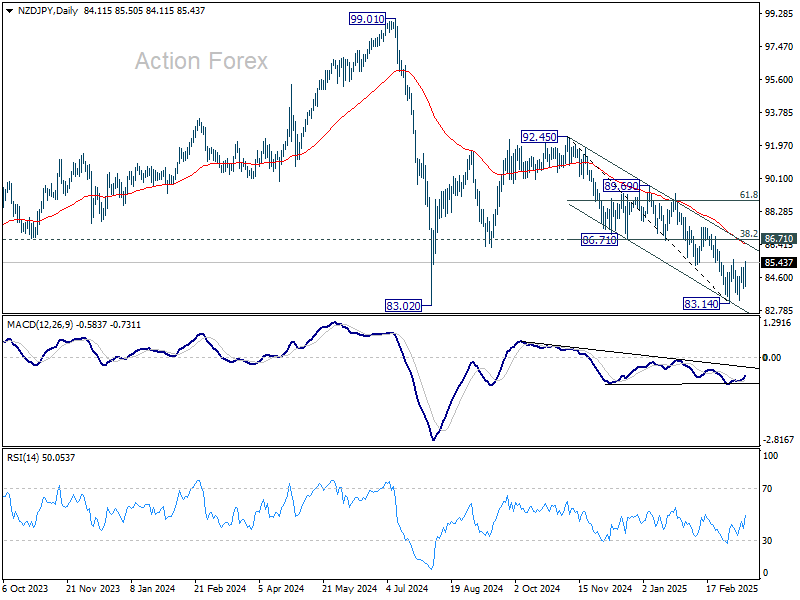
On the upside, NZD/JPY could face strong resistance from 86.71 (38.2% retracement of 92.45 to 83.14 at 86.96). Only a firm break of this cluster resistance zone would confirm bullish trend reversal.
Otherwise, fall from 92.45 is still in favor to continue. Indeed, firm break of 83.02 (2024 low) will resume whole down trend from 99.01 (2024 high).
USD/JPY Weekly Outlook
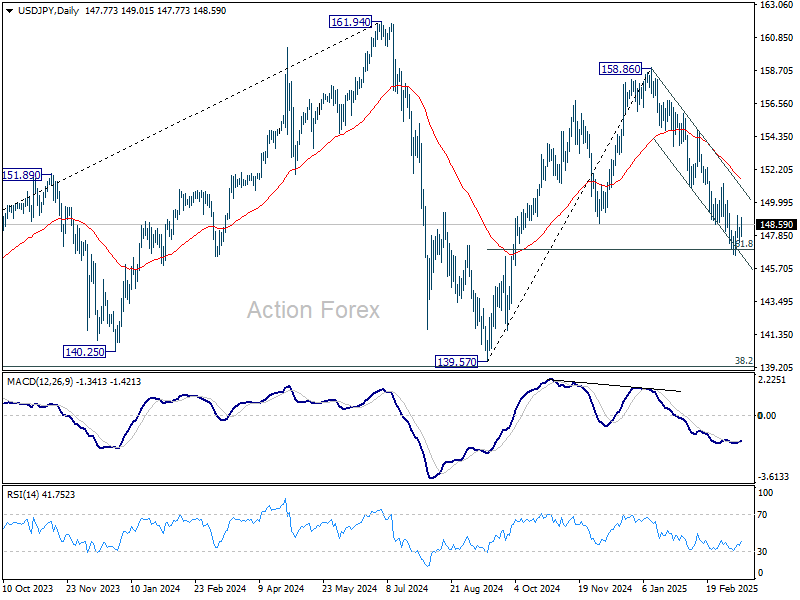
USD/JPY edged lower to 146.52 last week but recovered since then. Initial bias remains neutral this week for more consolidations. Upside of recovery should be limited by 150.92 support turned resistance. On the downside, sustained trading below 61.8% retracement of 139.57 to 158.86 at 146.32 will pave the way to 139.57 support.
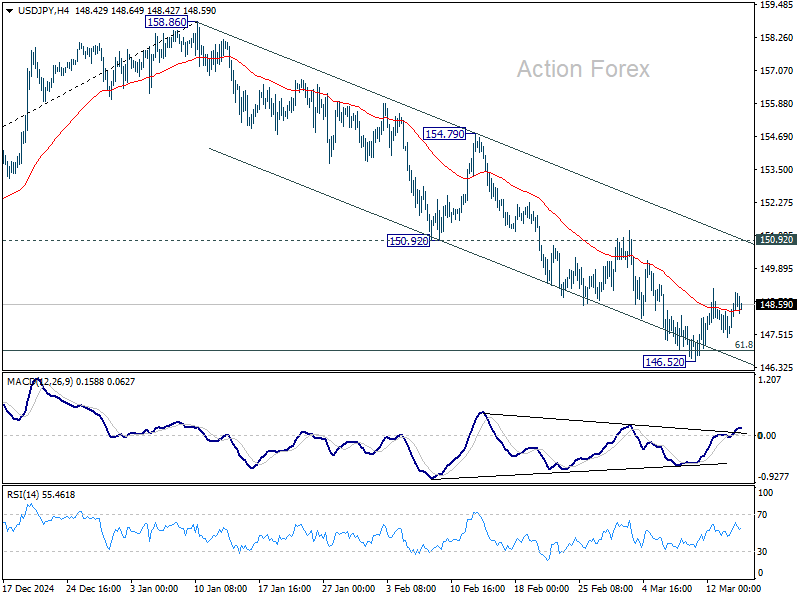
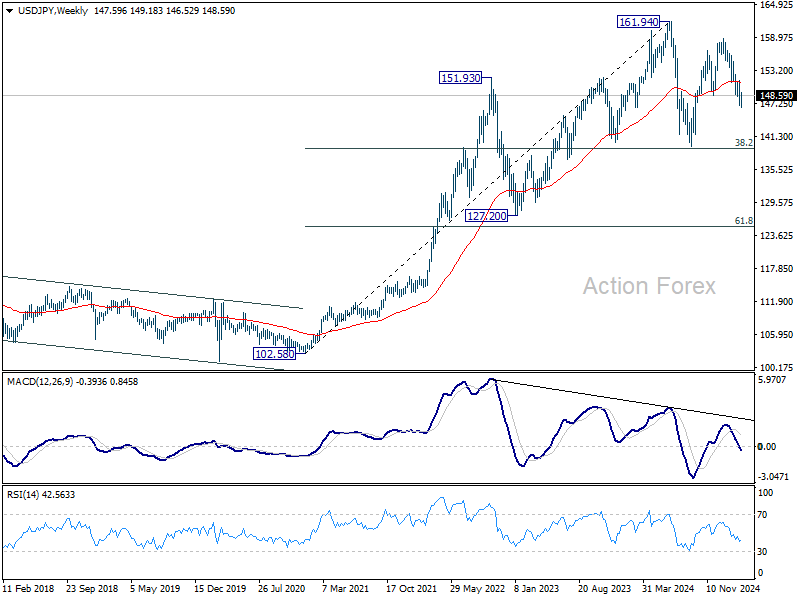
In the bigger picture, price actions from 161.94 are seen as a corrective pattern to rise from 102.58 (2021 low), with fall from 158.86 as the third leg. Strong support should be seen from 38.2% retracement of 102.58 to 161.94 at 139.26 to bring rebound. However, sustained break of 139.26 would open up deeper medium term decline to 61.8% retracement at 125.25.
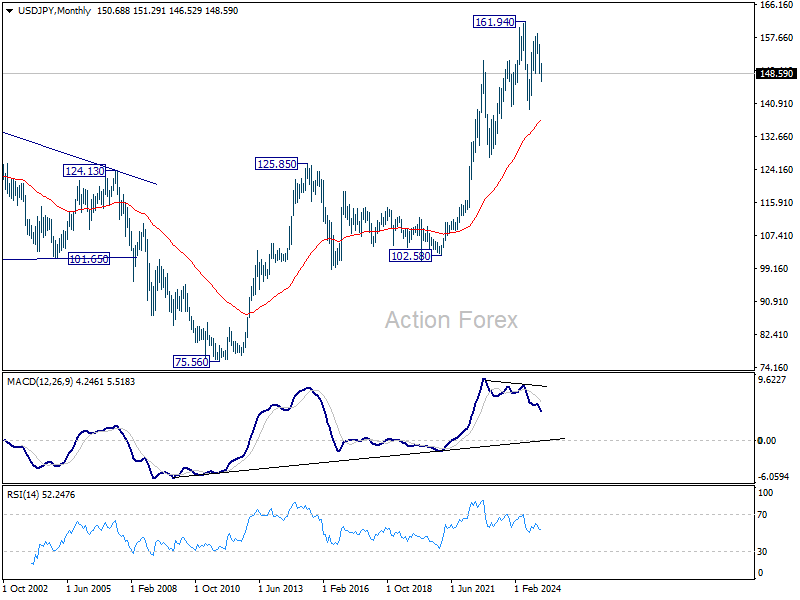
In the long term picture, it's still early to conclude that up trend from 75.56 (2011 low) has completed. A medium term corrective phase should have commenced, with risk of deep correction towards 55 M EMA (now at 136.88).
EUR/USD Weekly Outlook
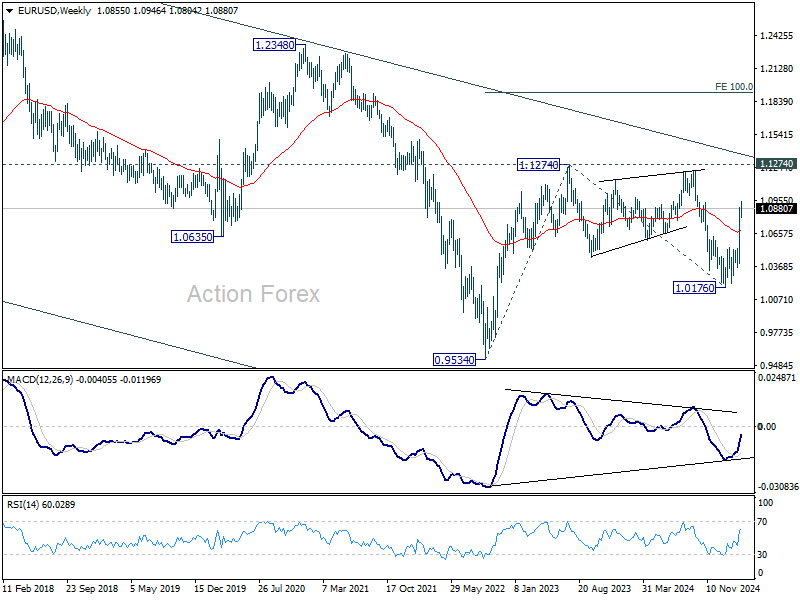
EUR/USD edged higher to 1.0946 last week but retreated since then. Initial bias stays neutral this week and more consolidations could be seen. In case of another fall, downside should be contained by 38.2% retracement of 1.0358 to 1.0946 at 1.0721 to bring rebound. On the upside, break of 1.0946 will resume the rally from 1.0176 to retest 1.1274 key resistance.
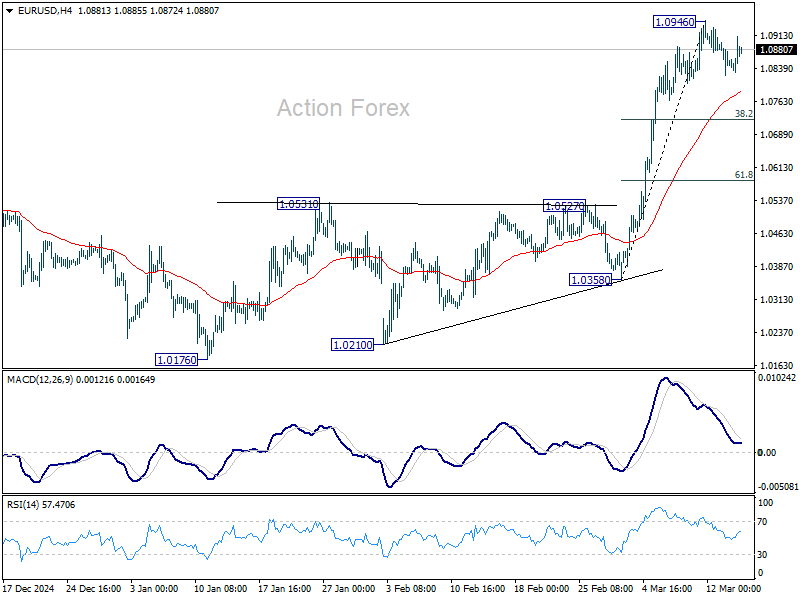
In the bigger picture, prior strong break of 55 W EMA (now at 1.0675) suggests that fall from 1.1274 (2024 high) has completed as a three wave correction to 1.0176. Rise from 0.9534 is still intact, and might be ready to resume. Decisive break of 1.1274 will target 100% projection of 0.9534 to 1.1274 from 1.0176 at 1.1916. Also, that will send EUR/USD through a multi-decade channel resistance will carries larger bullish implication. This will now be the favored case as long as 1.0531 resistance turned support holds.
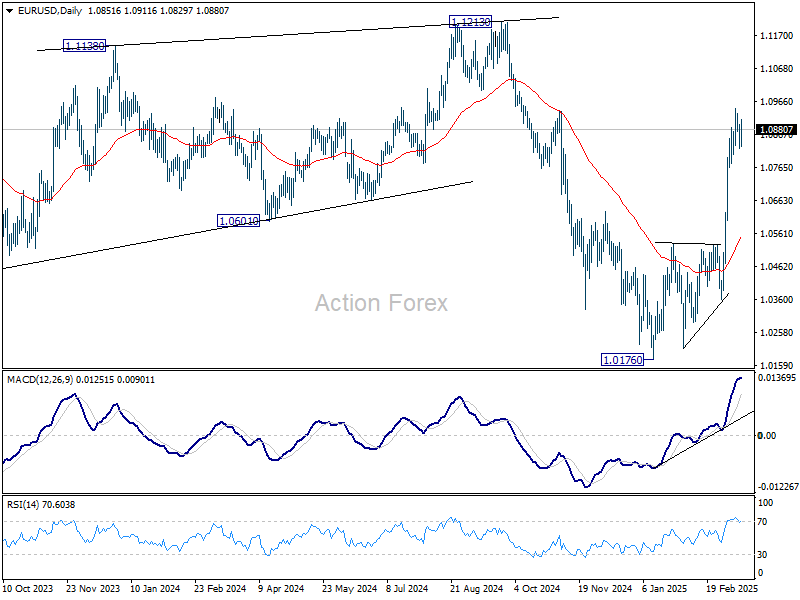
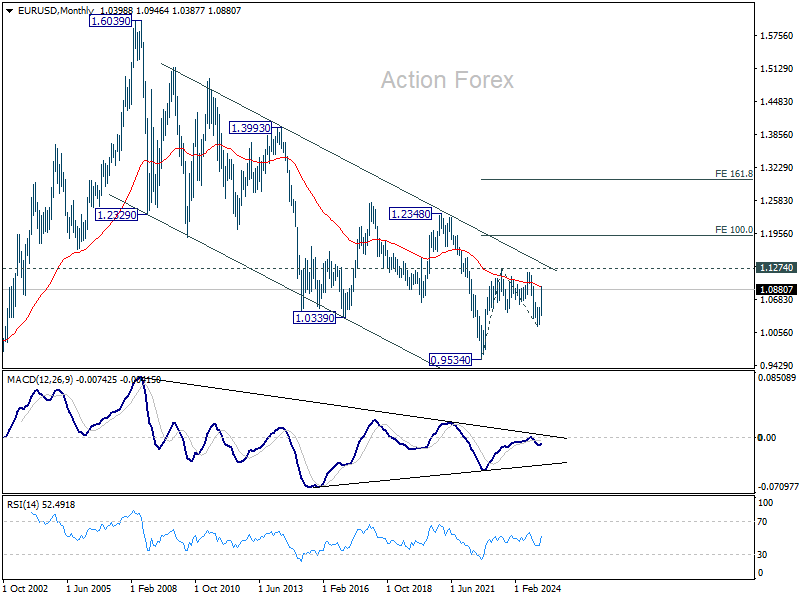
In the long term picture, the case of long term bullish reversal is building up. Sustained break of falling channel resistance (now at around 1.1400) will argue that the down trend from 1.6039 (2008 high) has completed at 0.9534. A medium term up trend should then follow even as a corrective move. Nevertheless, rejection by the channel resistance will keep outlook bearish.