
Sample Category Title
USD/JPY Mid-Day Outlook
Daily Pivots: (S1) 147.35; (P) 147.87; (R1) 148.32; More...
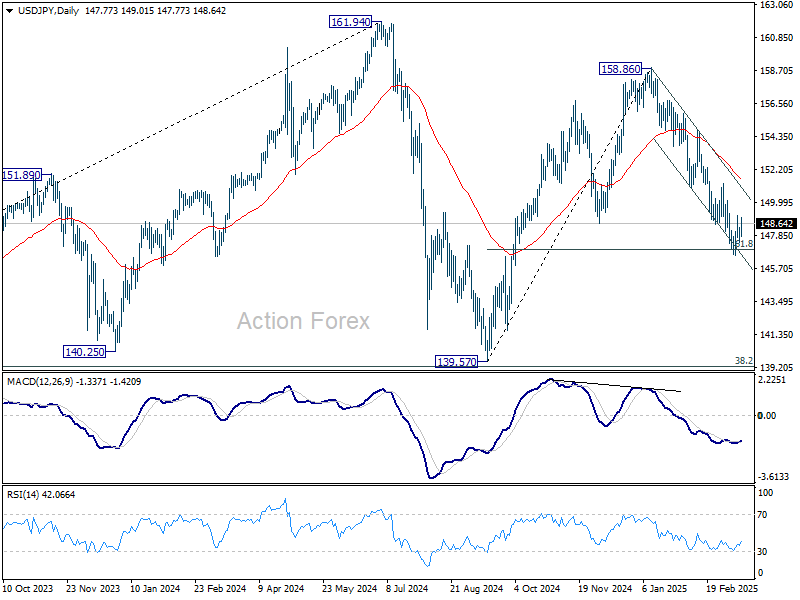
USD/JPY is staying in consolidation from 146.52 and intraday bias remains neutral. Upside of recovery should be limited by 150.92 support turned resistance. On the downside, sustained trading below 61.8% retracement of 139.57 to 158.86 at 146.32 will pave the way to 139.57 support.
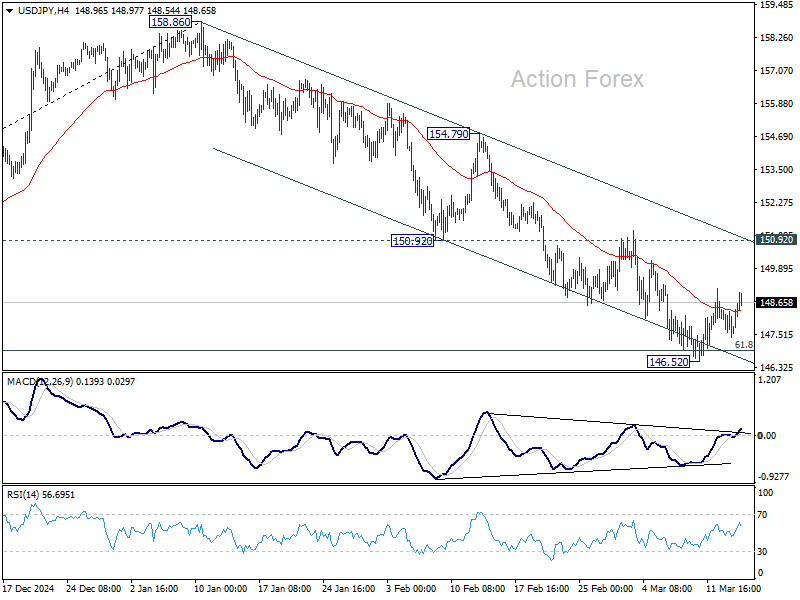
In the bigger picture, price actions from 161.94 are seen as a corrective pattern to rise from 102.58 (2021 low), with fall from 158.86 as the third leg. Strong support should be seen from 38.2% retracement of 102.58 to 161.94 at 139.26 to bring rebound. However, sustained break of 139.26 would open up deeper medium term decline to 61.8% retracement at 125.25.
USD/CHF Mid-Day Outlook
Daily Pivots: (S1) 0.8798; (P) 0.8827; (R1) 0.8849; More…
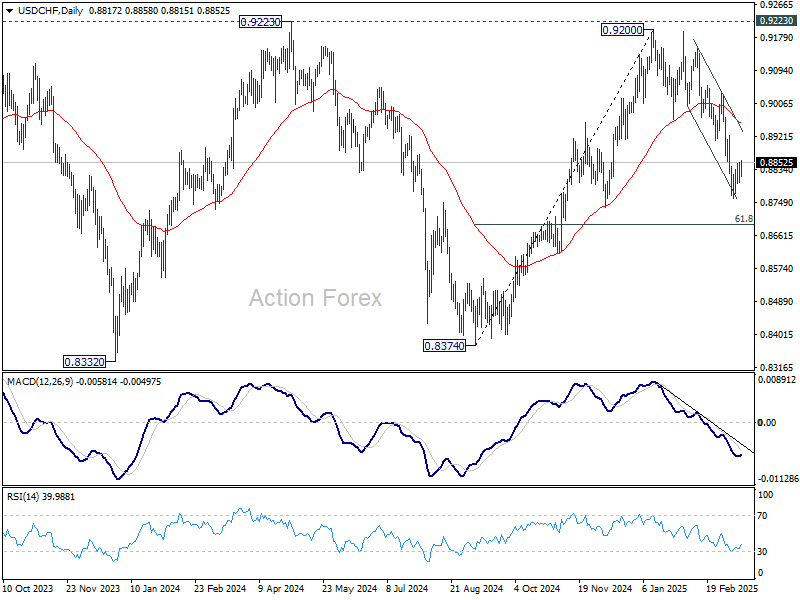
USD/CHF is extending consolidation from 0.8757 and intraday bias remains neutral. Upside of recovery should be limited by 0.8911 support turned resistance to bring another fall. On the downside, below 0.8757 will resume the fall from 0.9200 and target 61.8% retracement of 0.8374 to 0.9200 at 0.8690. Sustained break there will pave the way back to 0.8374 support.
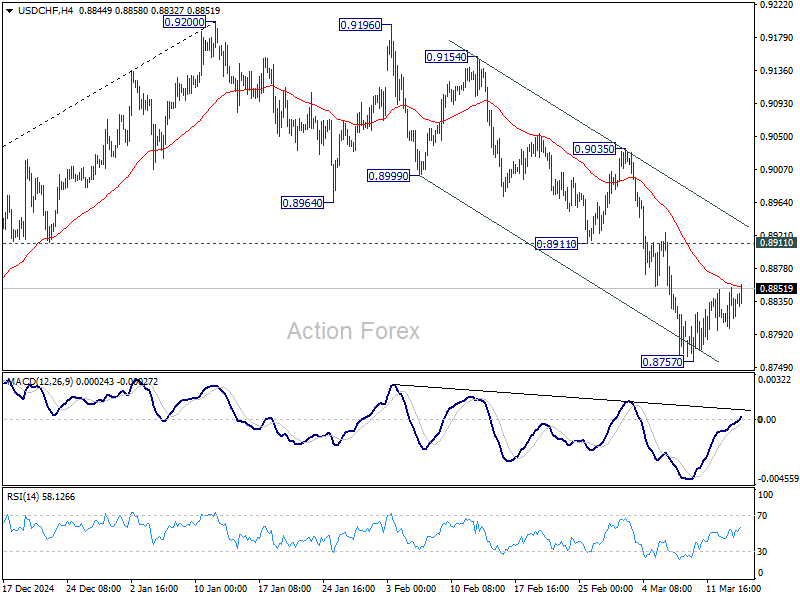
In the bigger picture, rejection by 0.9223 key resistance keep medium term outlook bearish. That is, larger fall from 1.0342 (2017 high) is not completed yet. Firm break of 0.8332 (2023 low) will confirm down trend resumption.
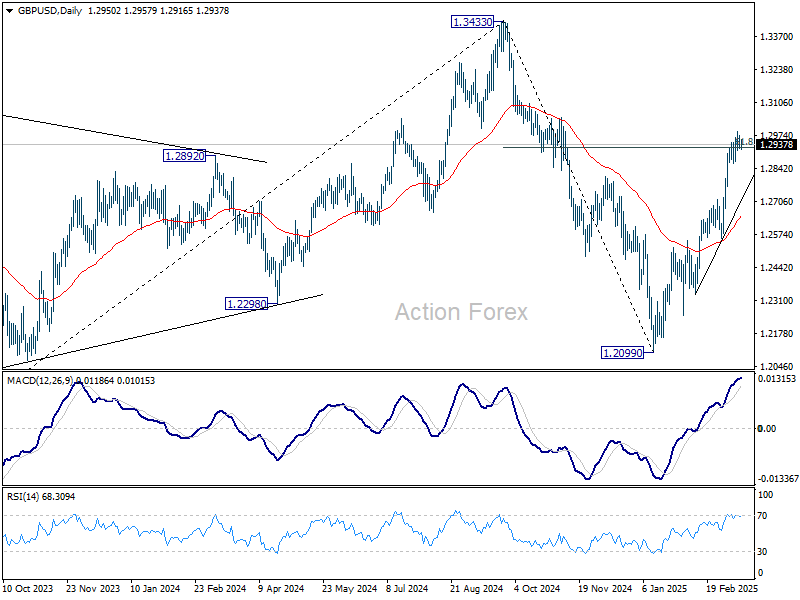
GBP/USD Mid-Day Outlook
Daily Pivots: (S1) 1.2923; (P) 1.2949; (R1) 1.2978; More...
With 1.2860 minor support intact, further rally remains in favor in GBP/USD. Sustained trading above 61.8% retracement of 1.3433 to 1.2099 at 1.2923 will resume the rise from 1.2099, and pave the way back to 1.3433 high. Nevertheless, break of 1.2860 support should indicate short term topping and turn bias back to the downside for deeper pullback.
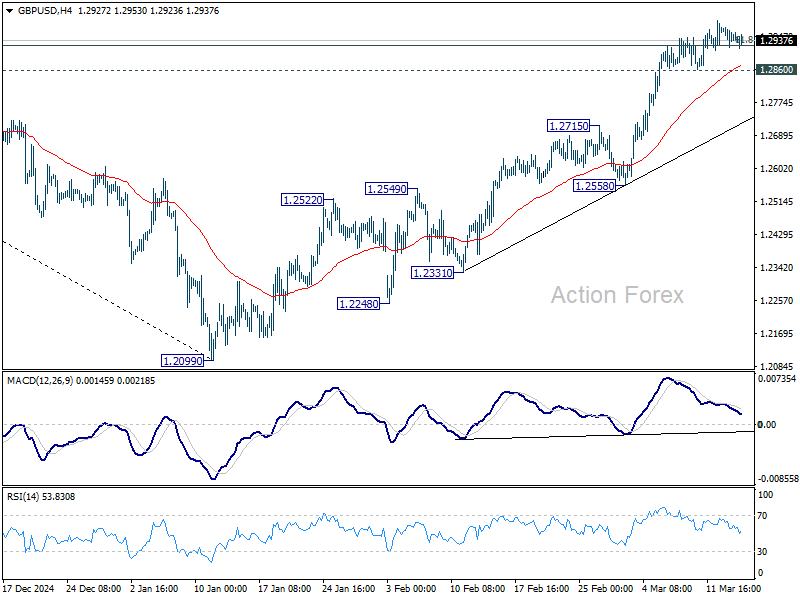
In the bigger picture, fall from 1.3433 (2024 high) should have completed at 1.2099 as a corrective move. Up trend from 1.3051 (2022 low) is still in progress but it's too early to say that it's resuming. Corrective pattern from 1.3433 could extend with one more down leg. But after all, eventual upside breakout is expected at a later stage.
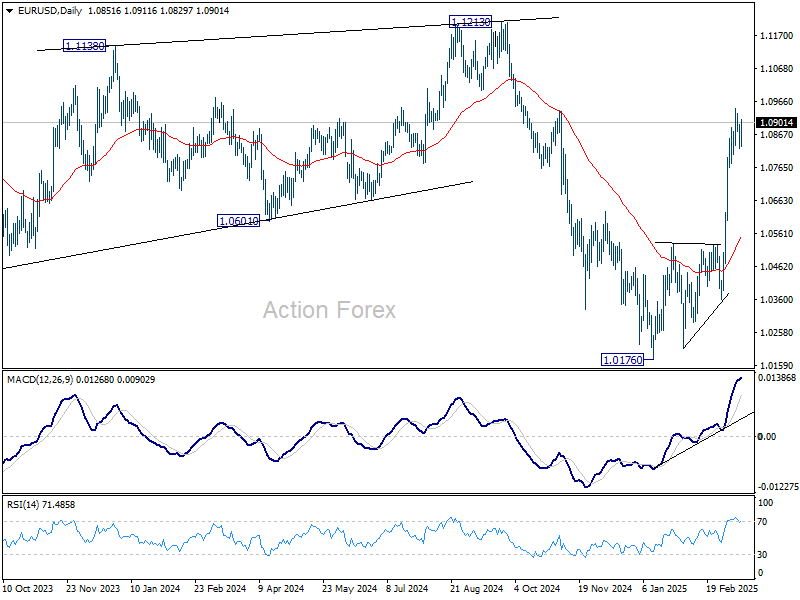
EUR/USD Mid-Day Outlook
Daily Pivots: (S1) 1.0818; (P) 1.0857; (R1) 1.0892; More...
EUR/USD recovers mildly but stays below 1.0946 temporary top. Intraday bias remains neutral and more consolidations could be seen. In case of another fall, downside should be contained by 38.2% retracement of 1.0358 to 1.0946 at 1.0721. On the upside, break of 1.0946 will resume the rally from 1.0176 to retest 1.1274 key resistance next.
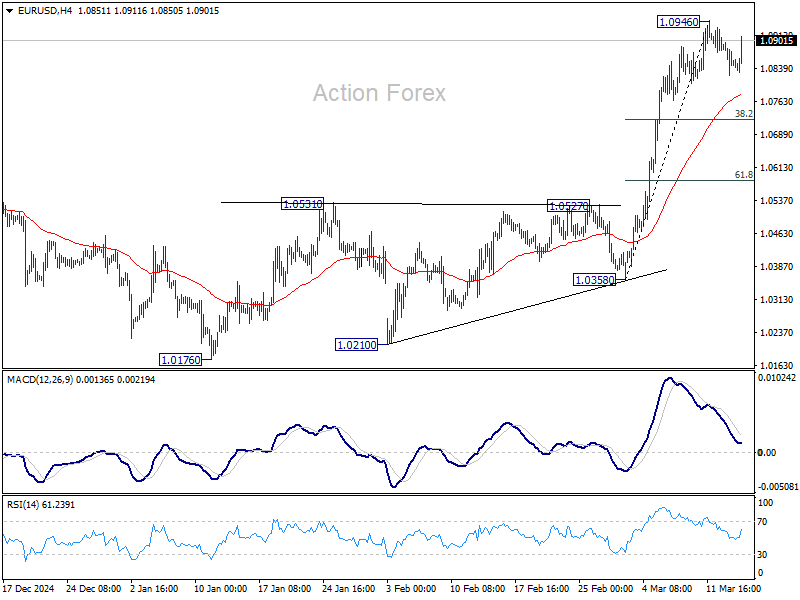
In the bigger picture, the strong break of 55 W EMA (now at 1.0675) suggests that fall from 1.1274 (2024 high) has completed as a three wave correction to 1.0176. Rise from 0.9534 is still intact, and might be ready to resume. Decisive break of 1.1274 will target 100% projection of 0.9534 to 1.1274 from 1.0176 at 1.1916. Also, that will send EUR/USD through a multi-decade channel resistance will carries larger bullish implication. This will now be the favored case as long as 1.0531 resistance turned support holds.
Euro Rallies as Germany Said to Reach Landmark Debt Deal to Boost Growth
Euro jumped notably higher following reports that Germany’s political leaders have reached a crucial agreement on the historic debt deal. According to sources close to the negotiations, Chancellor-in-waiting Friedrich Merz and the Greens have agreed on a massive increase in state borrowing, just days before a decisive parliamentary vote next week. While some details are still being finalized, the development marks a major step toward unlocking substantial funding for infrastructure, military expansion, and economic revival in Europe’s largest economy.
Merz has been pushing for the outgoing German parliament to approve a EUR 500B infrastructure fund alongside sweeping reforms to borrowing rules that would provide greater fiscal flexibility for future investments. However, securing a two-thirds majority for constitutional changes requires support not only from his own conservative bloc and his likely coalition partner, the Social Democrats , but also from the Greens. With the Greens now onboard, the proposal has gained significant momentum, boosting confidence in Germany’s economic outlook and supporting Euro in currency markets.
Overall for the week, Euro’s rally has helped it reclaim the top-performing spot, solidifying its strong positioning as trading nears a close. New Zealand Dollar has also performed well, buoyed by upbeat manufacturing data from New Zealand, which signaled faster-than-anticipated recovery. Meanwhile, British Pound has slipped to third place after UK GDP unexpectedly contracted in January.
At the other end of the spectrum, Swiss Franc and Japanese Yen are the weakest performers. Canadian Dollar has also struggled amid trade war uncertainties, keeping it in the lower tier of performers. Dollar and Australian Dollar are mixed, positioning somewhere in the middle of the pack.
In Europe, at the time of writing, FTSE is up 0.67%. DAX is up 1.92%. CAC is up 1.21%. UK 10-year yield is up 0.092 at 4.725. Germany 10-year yield is up 0.085 at 2.939. Earlier in Asia, Nikkei rose 0.72%. Hong Kong HSI rose 2.12%. China Shanghai SSE rose 1.81%. Singapore Strait Times fell -0.04%.
Japan 10-year JGB yield fell -0.002 to 1.544.
UK GDP down -0.1% mom in Jan, production drags while services support
The UK economy shrank by -0.1% mom in January, falling short of market expectations for a modest 0.1% expansion. The decline was primarily driven by weakness in the production sector, which saw output fall by -0.9% mom , while construction activity also dipped by -0.2% mom. On the other hand, the services sector—accounting for the bulk of the UK economy—managed a modest 0.1% mom gain, helping to cushion the overall contraction.
The broader three-month growth trend is weak too, with real GDP estimated to have expanded by 0.2% in the three months to January 2025 compared to the three months ending in October 2024. Services led the way with a 0.4% rise, while construction also posted a similar 0.4% gain. However, the production sector continued to struggle, contracting by -0.9% over the same period.
NZ BNZ manufacturing hits 53.9 as recovery gains unexpected momentum
New Zealand’s BusinessNZ Performance of Manufacturing Index rose from 51.7 to 53.9 in February, marking its highest level since August 2022.
This solid improvement was driven by stronger production (52.4) and new orders (51.5), both also reaching their best levels since August 2022. Meanwhile, employment surged to 54.0, climbing 3.2 points from January and hitting its highest level since September 2021.
Despite the stronger data, business sentiment remains cautious. The proportion of negative comments from respondents rose to 59.5% in February, up from 57.7% in January. Many manufacturers cited weak orders and sluggish sales as ongoing challenges, signaling that while expansion has resumed.
BNZ’s Senior Economist Doug Steel welcomed the sustained improvement, noting that "pickup may be a bit faster than we are currently forecasting".
EUR/USD Mid-Day Outlook
Daily Pivots: (S1) 1.0818; (P) 1.0857; (R1) 1.0892; More...
EUR/USD recovers mildly but stays below 1.0946 temporary top. Intraday bias remains neutral and more consolidations could be seen. In case of another fall, downside should be contained by 38.2% retracement of 1.0358 to 1.0946 at 1.0721. On the upside, break of 1.0946 will resume the rally from 1.0176 to retest 1.1274 key resistance next.
In the bigger picture, the strong break of 55 W EMA (now at 1.0675) suggests that fall from 1.1274 (2024 high) has completed as a three wave correction to 1.0176. Rise from 0.9534 is still intact, and might be ready to resume. Decisive break of 1.1274 will target 100% projection of 0.9534 to 1.1274 from 1.0176 at 1.1916. Also, that will send EUR/USD through a multi-decade channel resistance will carries larger bullish implication. This will now be the favored case as long as 1.0531 resistance turned support holds.
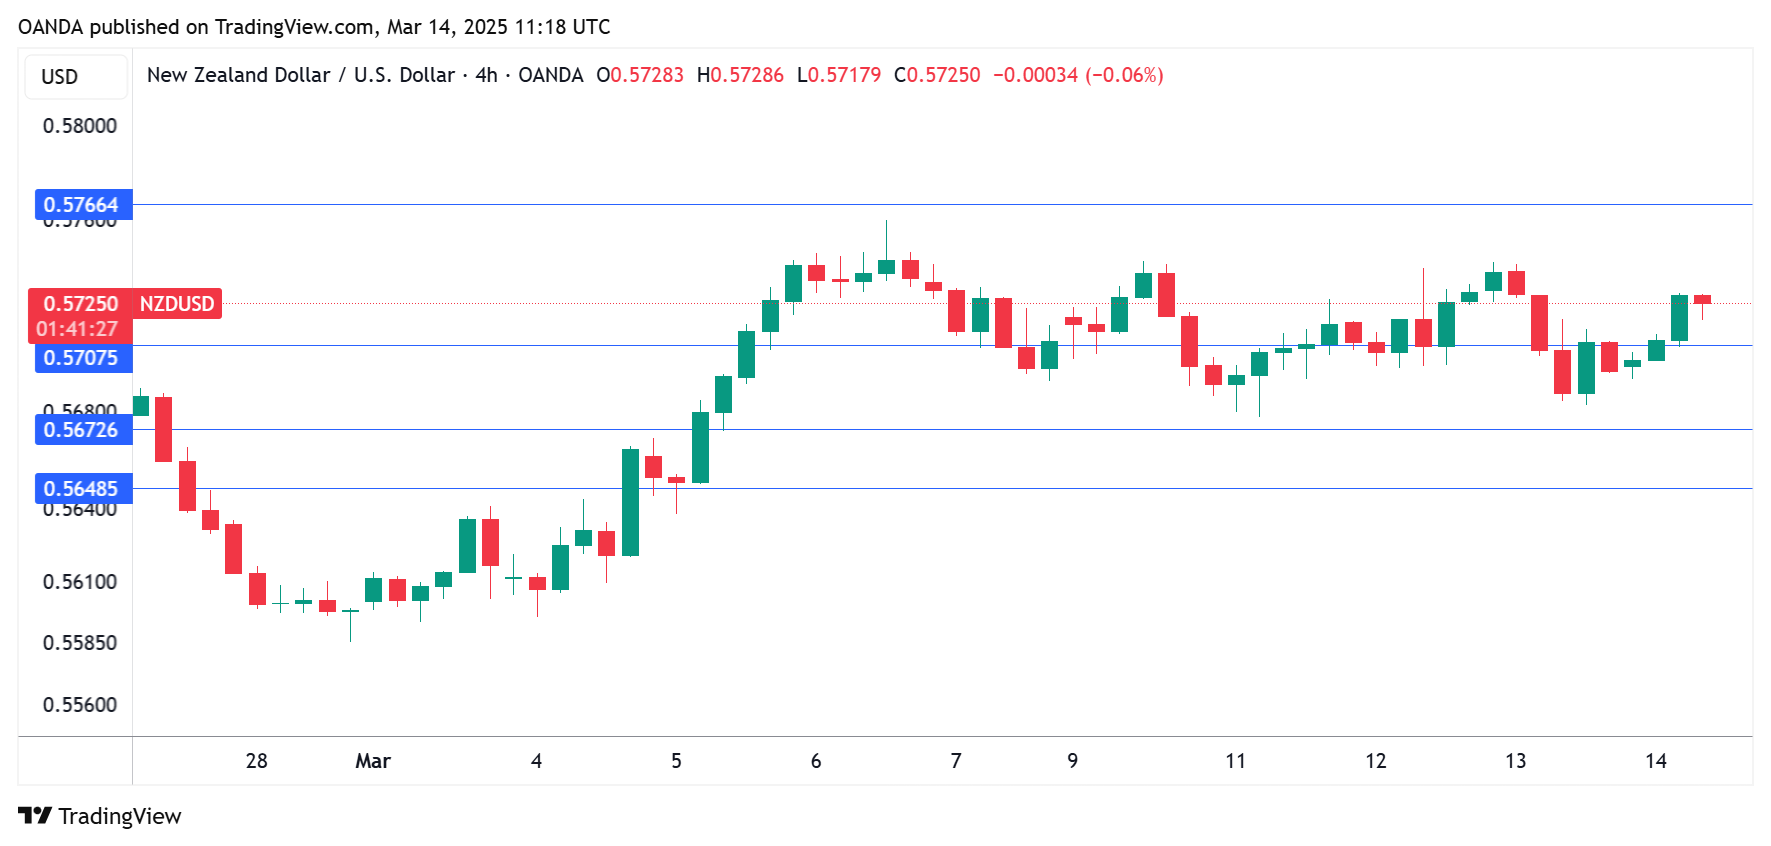
New Zealand Dollar Climbs as Manufacturing Improves
The New Zealand dollar is in positive territory on Friday. NZD/USD is trading at 0.5722 in the European session, up 0.46% on the day.
NZ Manufacturing PMI rises to near-three year high
New Zealand’s manufacturing sector improved in February, as Manufacturing PMI rose to 53.9, up from 52.5 in January. This was the highest level since August 2022. All sub-index values recorded increases, including production, new orders and employment. The Manufacturing PMI has now recorded expansions for two consecutive months after a prolonged contraction of close to a year.
The services sector has showed a similar trend, recording weak expansion in January at 50.4, after 10 straight months of contraction. The Services PMI will be released on Monday and is expected to rise to 50.7. A slight improvement in both services and manufacturing would signal that the New Zealand’s economy appears to be moving in the right direction.
US tariffs a headache for RBNZ
The Reserve Bank of New Zealand has been aggressive in its easing cycle, chopping rates by 50 basis points in October, November and February. The cash rate is down to 3.75%, its lowest level since October 2022. The central bank plans to continue cutting rates but in a more gradual fashion. Governor Adrian Orr signaled at the February meeting that he expects to cut rates by 25 basis points in both April and May, provided that economic conditions evolve as projected.
The escalation in global trade tensions is on the minds of RBNZ policymakers. The US hasn’t targeted New Zealand with tariffs but a trade war 2.0 between the US and China could damage the fragile New Zealand economy as China is New Zealand’s largest trading partner. A global trade war due to US tariffs would likely raise inflation and hurt the RBNZ’s battle to lower inflation to its 2% target.
NZD/USD Technical
- NZD/USD is testing resistance at 0.5707 and putting pressure on resistance at 0.5731. The next resistance line is 0.5766
- 0.5672 and 0.5648 are the next support lines
Gold Poised for Record Highs Strong Demand and Stable Outlook
On Friday, the price of Gold surged to 2,983 USD per troy ounce, marking a new record high. The precious metal closed the week with a gain of over 2%, driven by a decline in risk appetite and growing expectations of interest rate cuts by the Federal Reserve.
Key drivers behind Gold’s rally
The ongoing escalation of trade tensions has played a significant role in boosting Gold prices. US President Donald Trump recently threatened to impose a 200% tariff on European wines and other alcoholic beverages in retaliation for the EU’s 50% tax on US whiskey exports. This has further fuelled market uncertainty, driving investors toward safe-haven assets like Gold.
Additionally, recent US economic data, including the Producer Price Index (PPI) and Consumer Price Index (CPI), showed easing inflationary pressures in February. This has strengthened the case for potential rate cuts by the Federal Reserve, enhancing Gold’s appeal as a non-yielding asset.
Gold also benefits from robust demand for gold-backed exchange-traded funds (ETFs) and consistent purchases by global central banks. Notably, February’s data confirmed that China has increased its Gold reserves for the fourth consecutive month. These factors have overshadowed the influence of the US dollar on Gold prices, which currently plays a minimal role in the metal’s trajectory.
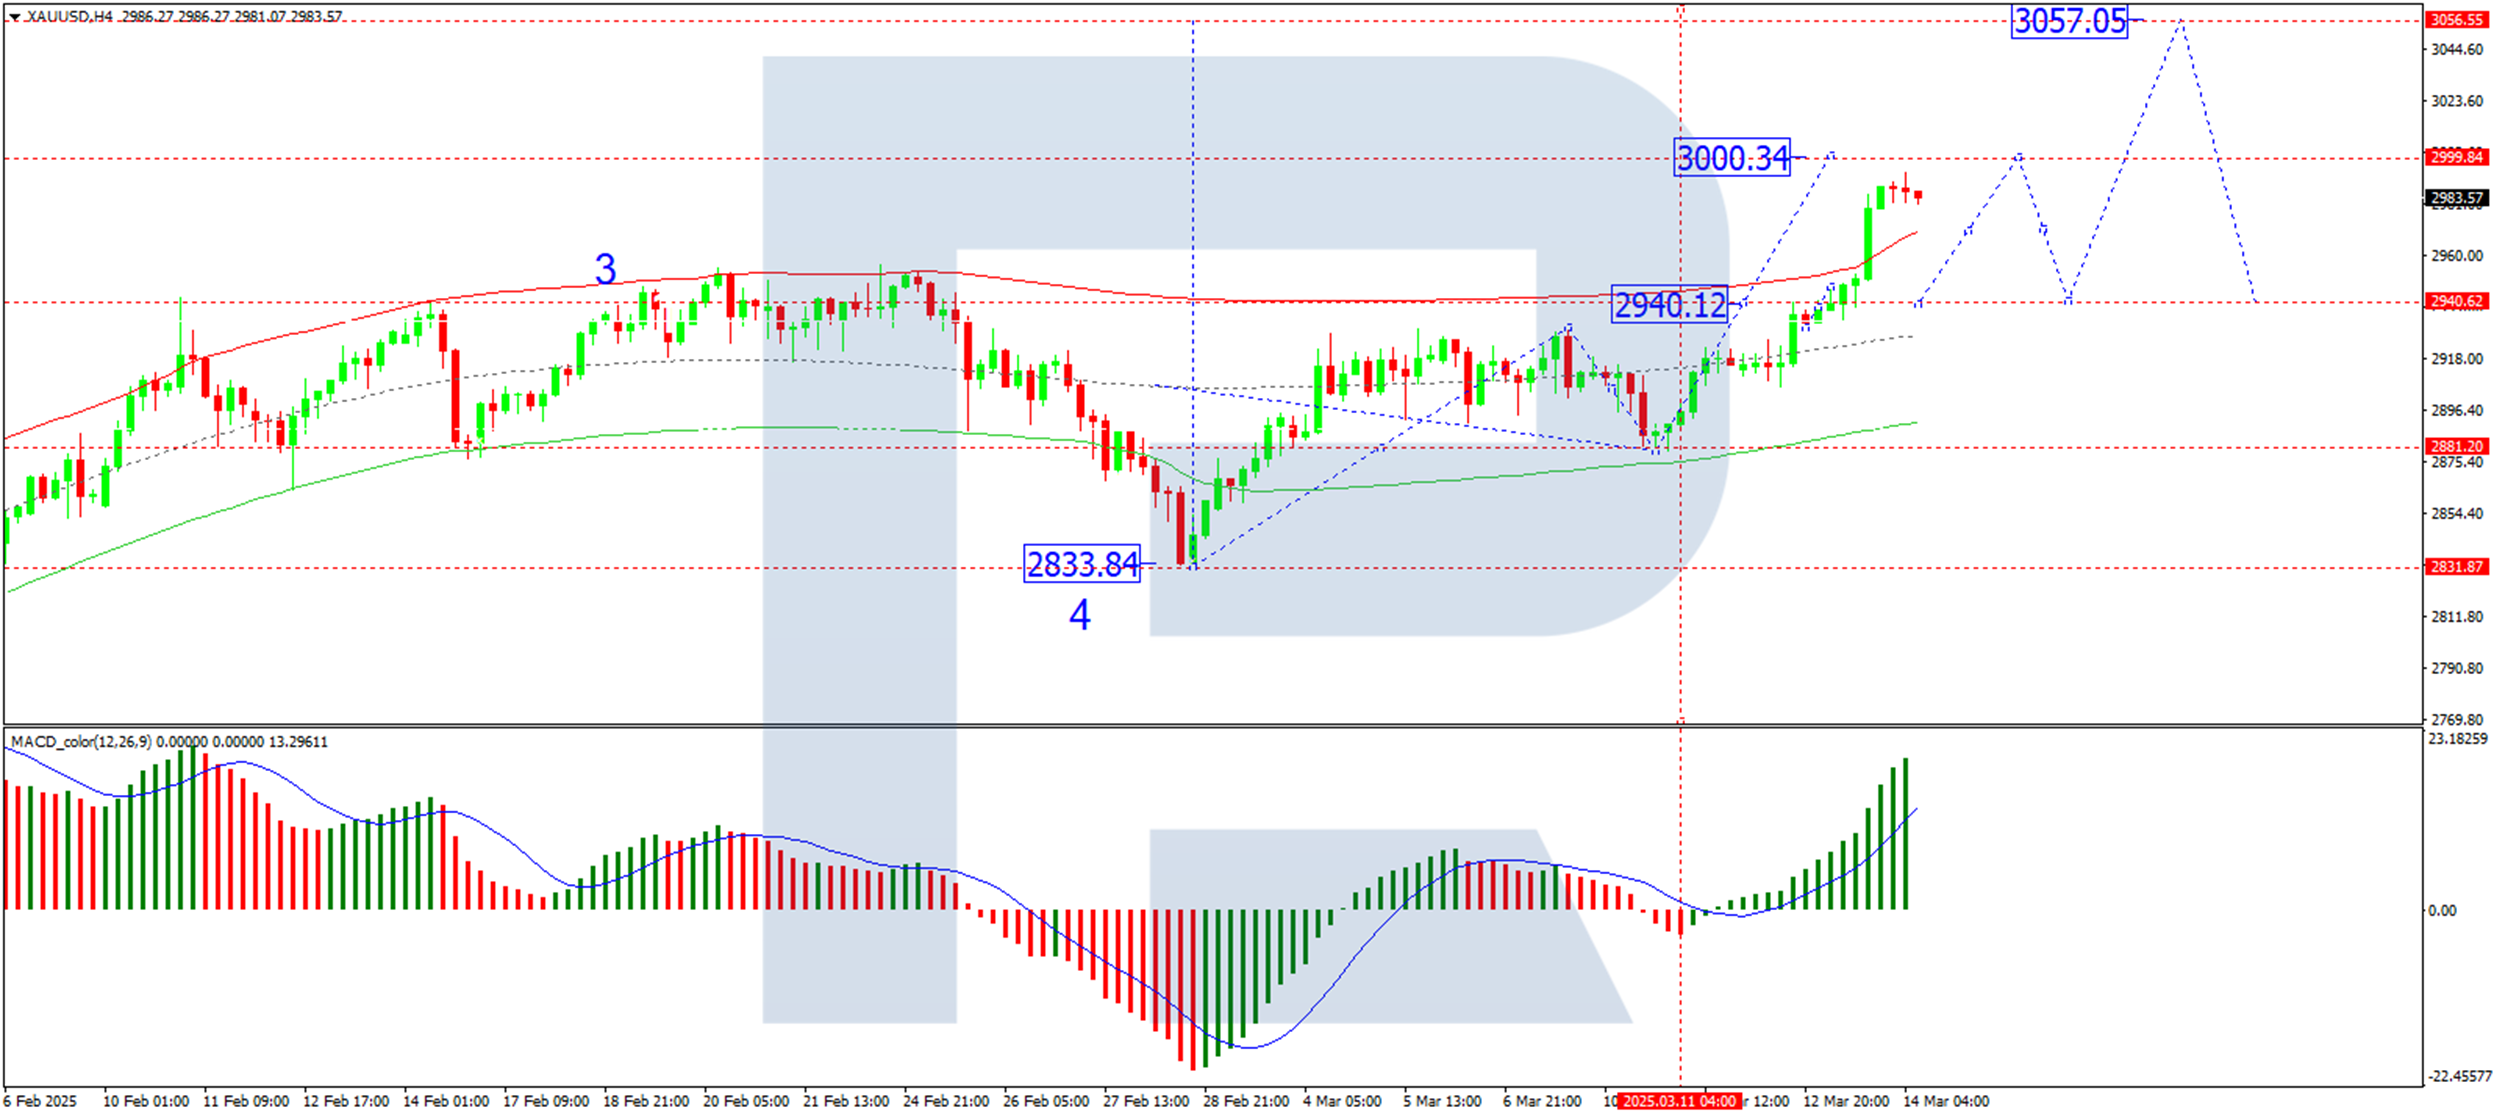
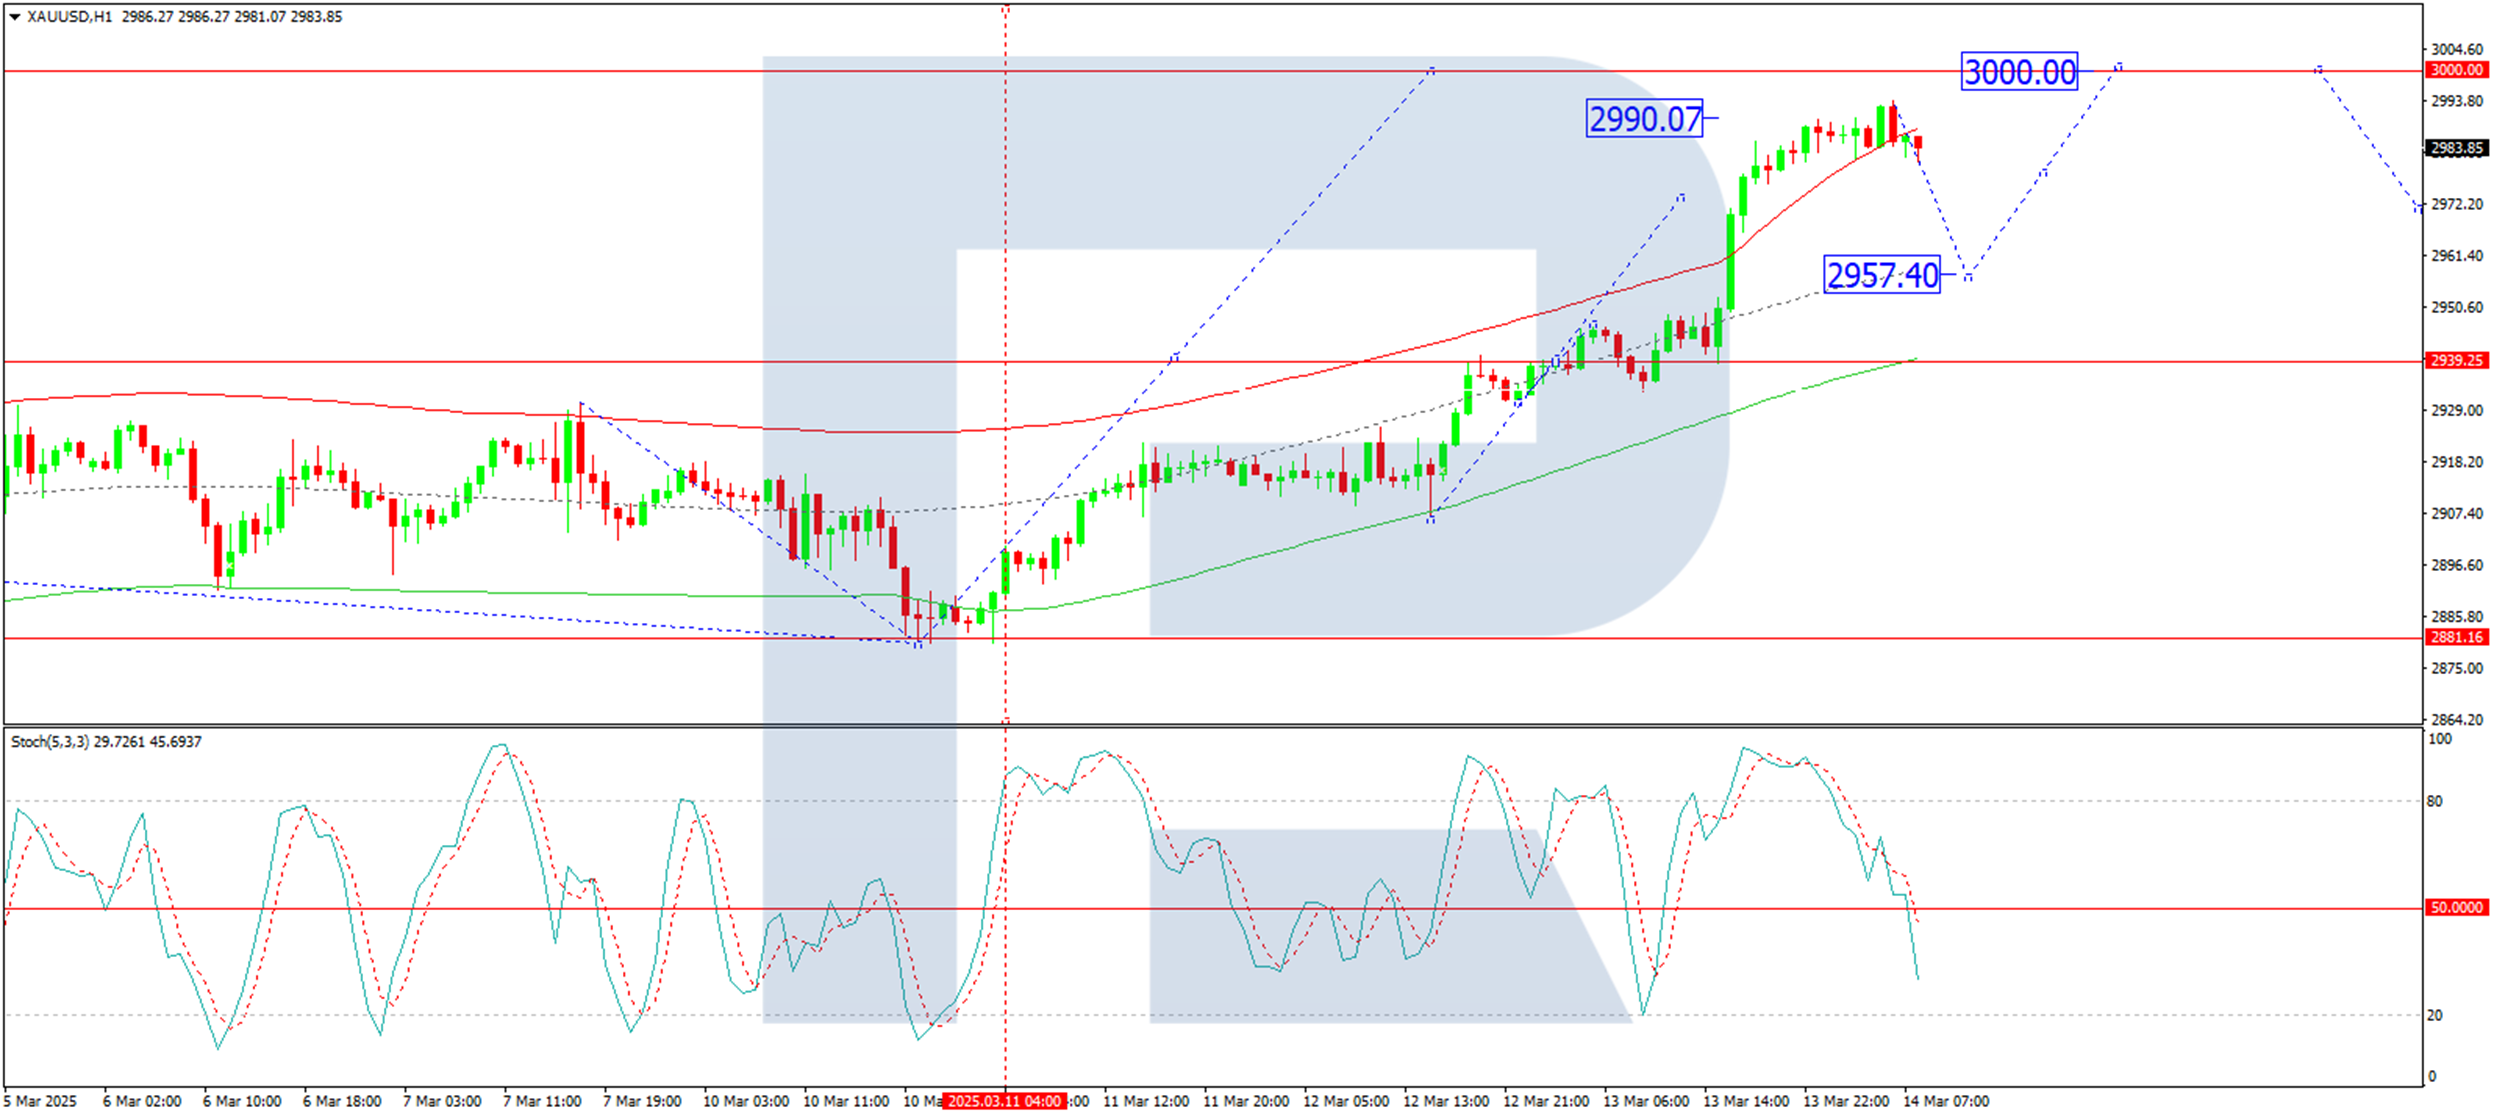
Technical Analysis of XAU/USD
On the H4 chart of XAUUSD, the market has confidently breached the 2,940 USD level and continues its upward momentum towards 3,000 USD, which is the immediate target anticipated to be reached today. Following this, a corrective pullback to 2,940 USD (testing the level from above) is possible. Once this correction concludes, there is potential for a new growth wave targeting 3,057 USD. This scenario is technically supported by the MACD indicator, whose signal line remains above zero and is trending sharply upward.
On the H1 chart, the market has completed the growth wave structure to the 2,940 USD level. A tight consolidation range has formed around this level, and the upward wave towards 3,000 is progressing with a strong breakout. Today, the local target of this wave at 2,990 USD is expected to be achieved, and a corrective move towards 2,957 USD is possible. Following this, further growth towards the 3,000 USD level is anticipated. Upon reaching this target, a corrective wave back to 2,940 is likely. This outlook is technically confirmed by the Stochastic oscillator, whose signal line is below the 50 level and is trending downward toward 20.
Conclusion
Gold’s rally is supported by a combination of macroeconomic factors, including trade tensions, easing inflation, and strong central bank demand. Technically, the metal is poised to test the 3,000 USD level, with potential corrections along the way. Investors should monitor key support and resistance levels and macroeconomic developments to gauge the next phase of Gold’s movement.
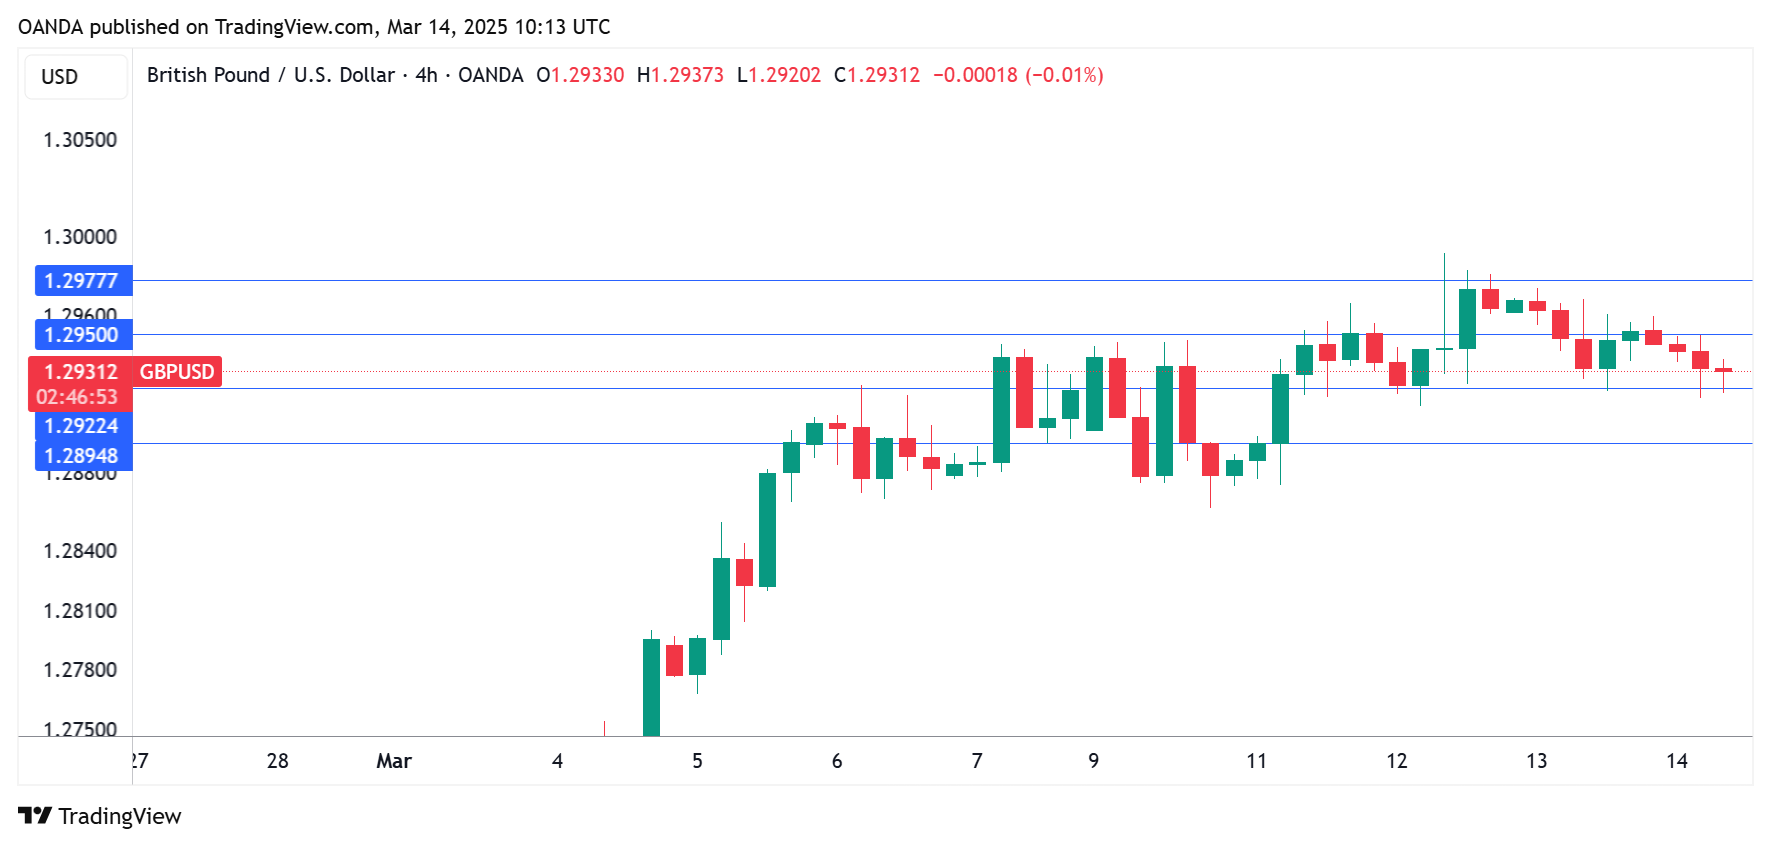
GBP/USD Shrugs as UK GDP Unexpectedly Declines
The British pound has edged lower against the US dollar on Friday. GBP/USD is trading at 1.2928 in the European session, down 0.13% on the day.
UK economy declines 0.1% in January
The UK economy barely registered any growth in the second half of 2024, rising 0.1% in the third quarter and flatlining in the third quarter. The New Year hasn’t seen any improvement, as GDP contracted 0.1% m/m in January, after a 0.4% gain in December and missing the market estimate of 0.1%. The surprise contraction was driven by declines in the production and manufacturing sectors. The economy expanded 0.2% in the three months to January, up from 0.1% in the three months to December but shy of the market estimate of 0.3%.
The weak GDP report won’t make things any easier for Finance Minister Rachel Reeves, who will announce the Treasury’s “Spring Statement” on March 26. Reeves is expected to outline plans for higher taxes and spending cuts. The tax hikes on British businesses are expected to weigh on investment, hiring and growth.
The Bank of England meets on March 20 and is widely expected to maintain rates at 4.5%. The BoE trimmed rates by a quarter-point in February. Inflation rose sharply in January to 3.0% y/y, up from 2.5% in December. The rise in inflation and weak GDP has raised concerns about stagflation, which is characterized by persistent inflation and weak growth.
Another headache for BoE policymakers is US President Donald Trump’s tariff policy. The UK had hoped to avoid the tariffs, but this week the US slapped 25% tariffs on all steel and aluminum imports, including on UK products. That could hurt UK growth and boost inflation.
GBP/USD Technical
- GBP/USD tested resistance at 1.2949 earlier. Above, there is resistance at 1.2978
- 1.2923 and 1.2894 are the next support levels
Gold Price Nears $3,000 for the First Time in History
As shown in the XAU/USD chart today, gold is at a record high, just $5 away from the key psychological level of $3,000. Moreover, on the futures market, COMEX data indicates that gold futures have already surpassed this barrier.
Bullish sentiment is driven by:
→ Low US inflation data (released on Wednesday), which boosted gold prices due to growing expectations of a more dovish Federal Reserve policy.
→ Uncertainty surrounding Trump’s tariffs, escalating global trade tensions. According to the latest reports, the US president has warned of a 200% tariff on European wine and other alcoholic beverages after the EU imposed a 50% tariff on American whiskey.
Technical Analysis of XAU/USD
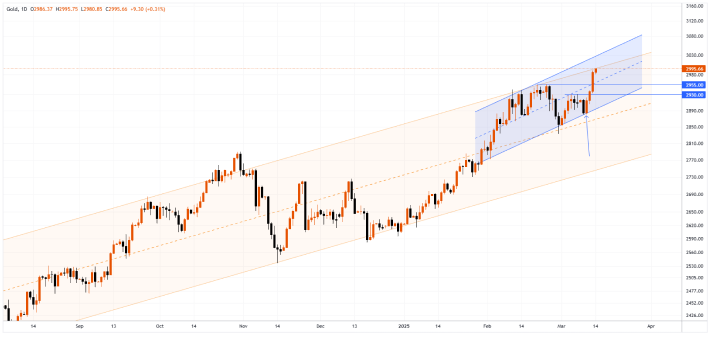
In our previous post on 6 March, we identified an upward channel (marked in blue) and suggested that its lower boundary would act as support, providing bulls with an opportunity to push towards the $3,000 level.
As indicated by the arrow, this scenario played out:
→ 10–11 March: The price rebounded from the lower blue boundary.
→ The price then broke through $2,930.
The large bullish candle formed on 13 March signals strong buyer dominance, suggesting that:
→ $2,930 and $2,950, which previously acted as resistance, could now provide support for bulls.
→ This month, gold may exceed the $3,000 mark for the first time, reaching the upper boundary of the long-term channel (marked in yellow).
Start trading commodity CFDs with tight spreads. Open your trading account now or learn more about trading commodity CFDs with FXOpen.
This article represents the opinion of the Companies operating under the FXOpen brand only. It is not to be construed as an offer, solicitation, or recommendation with respect to products and services provided by the Companies operating under the FXOpen brand, nor is it to be considered financial advice.
With Uncertainty on Russian Reaction Some Further Euro Caution Might Prevail
Markets
In a not that distant past EMU (equity) markets often were dominated by caution/reluctance, awaiting guidance from the US. Especially risk-on moves mostly originated from the US. This isn’t how things are working out these days. Optimism, if any, often is initiated in Europe, just to be overthrown in US dealings. This was also the case yesterday. US president Trump suggesting an escalation in the US-EMU trade war (potential 200% retaliation tariffs on wine, champagne and other alcoholic beverages) didn’t help to support a bottoming out process in US equity markets. US indices again closed with losses of up to 2.0% (Nasdaq). The EuroStoxx reversed early intraday gains to close 0.58% lower. The story-line on a potential end to the war in Ukraine didn’t yield a clear pointer for trading yet. Russia as expected wants additional issues to be discussed/addressed. In this developing risk-off context, yields gradually eased throughout the session, but in the end the overall picture didn’t change. US yields declined between 3.0 bps (2-y) and 4.4 bps (10-y). As was the case for US CPI data Wednesday, US PPI prices also printed softer than expected, but the immediate impact on US yields was limited. Yields were driven by risk sentiment. EMU yields also took a breather, but the curve again steepened. The German 2-y yield declined 4.2 bps. The 30-y didn’t succumb (+0.9 bps). Overall growth concerns evidently also remain a factor for EMU markets. Even so, we see next week’s political developments (outcome of the negotiations between CDU-SPD and the greens on the German constitutional budget rules) and the EU summit as potentially at least as important to assess the trajectory for EMU interest rate markets. Despite the ongoing (US-driven) risk-off, the dollar got some relief. DXY closed at 103.8 to be compared with a week low just below 104 earlier this week. EUR/USD also corrected further off the 1.09 area (close 1.085). Bent oil continues to hover around the $70 p/b pivot.
Sentiment in Asia turned positive again. The positive U-turn in market comments is attributed to the US likely avoiding a government shutdown as at least some Democratic Senators are expected to support the Republican funding bill. This indeed removes a source of short-term uncertainty. Still we’re not convinced it is a major driver, especially for markets outside the US. In this respect, (regional) markets hoping for additional measures to be announced in China to support domestic demand/consumption might be at least as important going forward. US yields rise modestly this morning as does the dollar. Later today, the data/economic sentiment storyline also again comes into play with the U. of Michigan Consumer confidence in the US. A further decline again might rekindle the potentially recessionary impact of the uncertainty created by the Trump administration. At the same time, markets also will look forward to what the weekend might bring with respect to the Russian reaction to the US proposal on a ceasefire in the war in Ukraine. The euro recently was supported by expectations of a fiscally inspired revival and this theme might again come into play next week. However, with the uncertainty on the Russian reaction some further euro caution might prevail going into the weekend. In the UK, the January production data undershoot expectations by a substantial margin (IP -0.9% M/M and -1.5% Y/Y). Sterling in a first reaction loses modest growth (EUR/GBP 0.8385).
News & Views
Spanish PM Sanchez made a case for extending the definition of defense spending in order to include things like cyber security our climate as well. Because of the geographic position of his country he thinks of Russia about a hybrid threat. Solely focusing on defense investment as deterrence is a tough sell in Spain where military spending is the lowest of any Nato member as a percentage of GDP (estimated at 1.28%). Other countries like Italy sought to include “competitiveness” in the spending carve-out. EU leaders meet next week at an official summit (March 20-21) with a NATO-summit scheduled by the end of June.
National Bank of Poland governor Glapinski warned in a hawkish press conference that Polish inflation might only drop to target in 2027 and that monetary policy won’t support growth until this happens. Dissenting votes within the board, like MPC Kotecki still see a chance of a rate cut in July (after presidential elections) despite the Glapinski comments and the upward revision to CPI forecasts. Kotecki is less pessimistic on inflation and more pessimistic on growth with a strong zloty also able to tilt the MPC towards sooner rate cuts. MPC Wnorowski is also a dissenting vote, though he indicates that chances of a July rate cut are a bit smaller now.