Sample Category Title
Is Bitcoin (BTC/USD) Heading Lower? Examining Mt. Gox, Tariffs, and Technical Indicators
- Bitcoins price volatility has been impacted by Trump’s tariff policies, recession fears and Mt. Gox Transfers.
- Glassnodes’s accumulation trend score shows shifts in investor sentiment and increased selling pressure.
- Mt. Gox transfers are affecting markets but are overshadowed by tariff concerns.
Bitcoin’s rollercoaster ride continues as President Donald Trump and his tariff policies ramp up and weigh on overall market sentiment. The bitcoin price has been flirting with the $80,000 per bitcoin handle, dragging down the wider crypto market that’s now erased $1 trillion of value in just a month.
The hype around President Trump and his pro-crypto policies have faded as the effects of a global trade war take hold of financial markets. The tariff proposals by President Trump has for now cast a shadow over markets with BlackRock CEO Larry Fink stating that If people become more focused on supporting their own country, often referred to as nationalism, it could lead to higher inflation. This isn’t necessarily a bad thing, as some might find it appealing, but it would likely have an impact on prices.
Fears of a recession have also ramped up and thus weighing on crypto markets. Goldman Sachs economists have increased the chances of a recession in the next year from 15% to 20%. They pointed to Trump’s economic policies as the main concern. Yardeni Research economists also raised their recession estimate, from 20% to 35%, blaming Trump’s rapid actions with executive orders, firings, and tariffs.
Crypto Heatmap, March 13, 2025
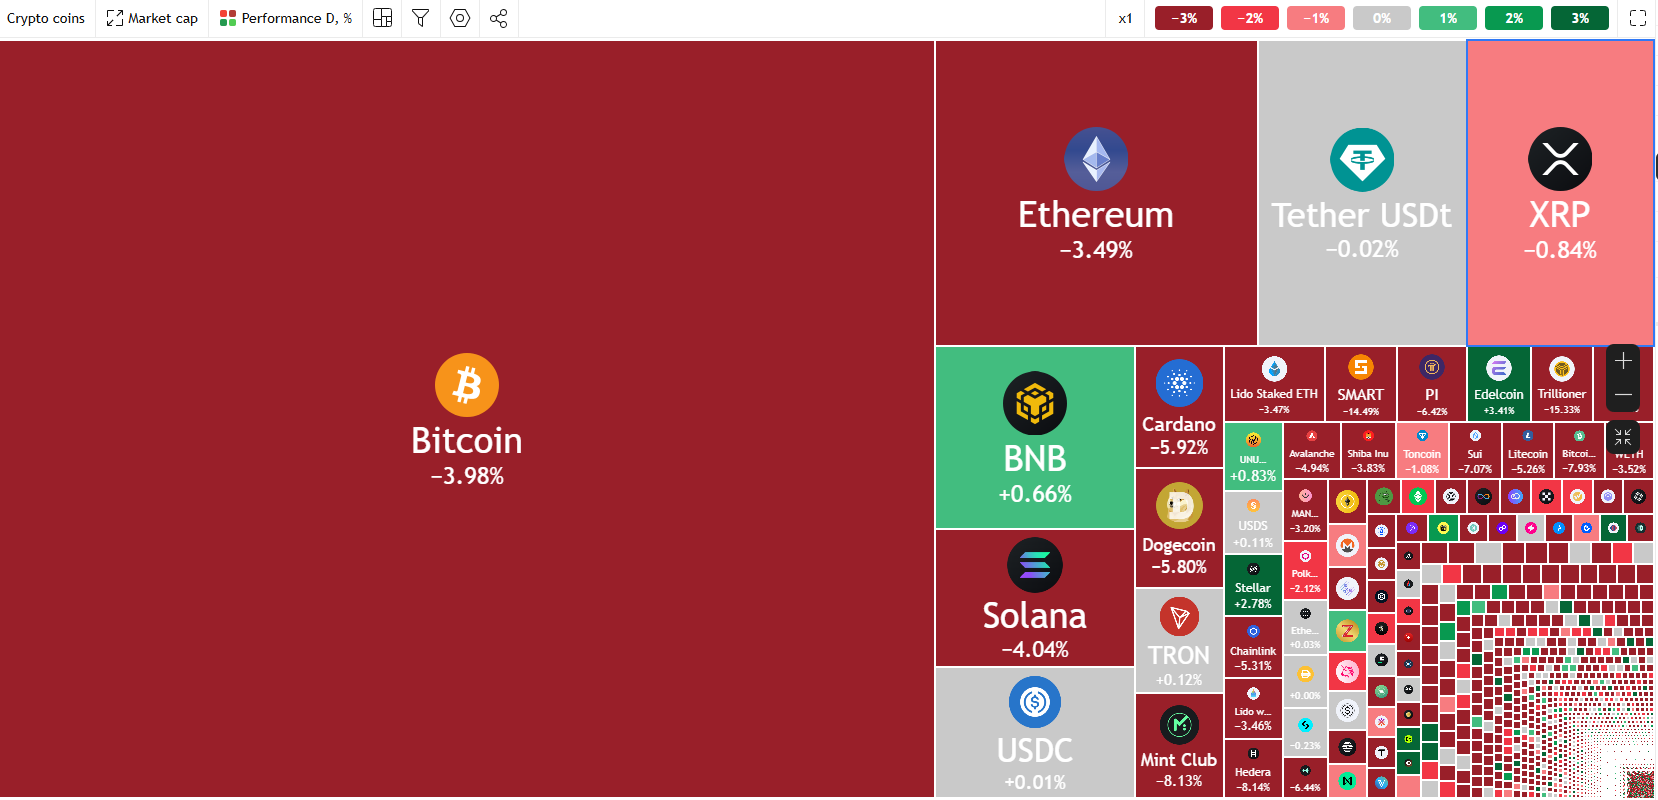
Source: TradingView (click to enlarge)
Was Mt. Gox Responsible for the Recent Selloff?
According to Look on chain, Mt. Gox moved 11,834 bitcoins this month, including 11,502 to an unknown wallet.
A recent transfer of $1.07 billion in March, followed by a complex repayment process starting in July 2023 and ending on October 31, has raised questions. Why now? The timing may be tied to the legal details of creditor repayments.
Every action from Mt. Gox still rattles the crypto world, even years after its 2014 bankruptcy. The platform still holds significant influence over the market.
However, so far, no large sell-offs have followed these repayments. Creditors, many of whom are experienced “hodlers,” appear to take a cautious approach rather than panicking. The extension of the repayment deadline to October 2024, announced at the end of 2023, has brought some relief. But the market operates on fear and instinct, and Mt. Gox continues to stir uncertainty. Fear, after all, often builds on itself.
Some bitcoins were moved to a hot wallet, which is often used for quick access to funds and could suggest a future sale. However, most of the bitcoins ended up in a “new wallet,” likely as a temporary step before being distributed further. This seems to be a cautious approach rather than an aggressive one. Still, the market tends to overreact, treating every unknown wallet as a potential threat and every transaction as a warning sign.
Thus the question is whether this was the reason for the selloff in crypto markets. While I believe this played a part, the ongoing pressure on Bitcoin prices is more indicative of fear across markets rather than a Mt.Gox situation.
Looking back at the market’s reaction during previous Mt. Gox moves and it is clear that the moves did not have a long lasting impact on crypto prices. The current decline and lack of a sustainable recovery suggest a different dynamic this time around.
Glassnode – The Week On-Chain
Bitcoin’s price cycles move between phases of buying (accumulation) and selling (distribution), with money shifting between different groups of investors over time. The Accumulation Trend Score measures these changes, with scores near 1 (dark purple) showing strong buying activity and scores near 0 (yellow) showing selling activity.
The chart shows that after periods of heavy accumulation, selling phases often follow, leading to weaker price movements. The most recent selling phase started in January 2025, matching Bitcoin’s drop from $108,000 to $93,000.
Right now, the Accumulation Trend Score is below 0.1, indicating ongoing strong selling pressure.
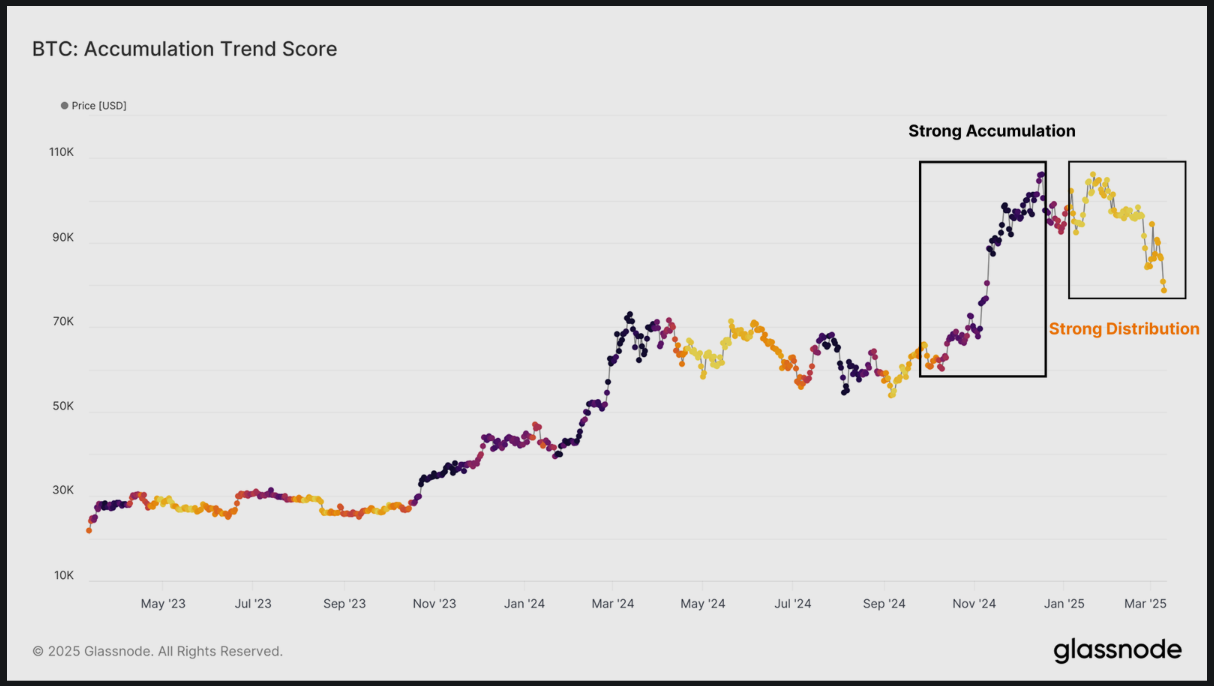
Source: Glassnode (click to enlarge)
The Accumulation Trend Score tracks how total Bitcoin balances on the blockchain are changing. However, it is influenced more by the actions of big players and doesn’t show where the Bitcoin was bought. While it’s useful for spotting general buying or selling trends, it doesn’t provide detailed information about key price levels where Bitcoin was acquired.
The cost-basis of Short-Term Holders (STH) shows that market momentum has turned negative, with less demand and growing uncertainty among investors.
Signs of fear-driven selling are clear, as the STH-SOPR (a measure showing profit or loss for short-term sellers) stays below 1, meaning most are selling at a loss. At the same time, STH-CDD (a measure of recent-holder activity) has jumped, showing more selling by short-term investors.
This wave of selling matches the market trading near its lower range. Many recent buyers are likely feeling significant financial pressure during this time.
All of the above does not currently inspire confidence for a sustained bullish move. The biggest takeaway and something which we are seeing in US Equity markets is the lack of dip-buying this time around. Not a surprise as markets are currently in a phase of capital preservation and risk aversion with no end in sight given the pending universal tariffs being proposed by the Trump administration.
It looks like a bumpy road ahead, so strap in and enjoy the ride.
Technical Analysis – BTC/USD
Bitcoin (BTC/USD) from a technical standpoint on the daily timeframe remains in a bearish trend.
A daily candle close above the 90000 handle will be needed for a change in structure and this remains some distance away at present.
Today it was the 200-day MA which served as a significant area of resistance and capped yesterdays attempted rally to the upside as well.
The decline today, found support at the 80000 handle with a brief foray below being met with some buying pressure. However, the daily candle closed as a bearish engulfing candle which hints at further downside ahead.
Looking at the potential of a break to the downside and we have support at the 78197 handle before the 75000 handle comes into focus. Below the 75000 mark the swing high from October 2024 at 73777 may be a key area to keep an eye on.
A move higher from current prices may find resistance at 82133 and the 200-day MA at 83636. Next focus will shift to the 85000 handle and the 90000 handle respectively.
Bitcoin (BTC/USD) Daily Chart, March 13, 2024
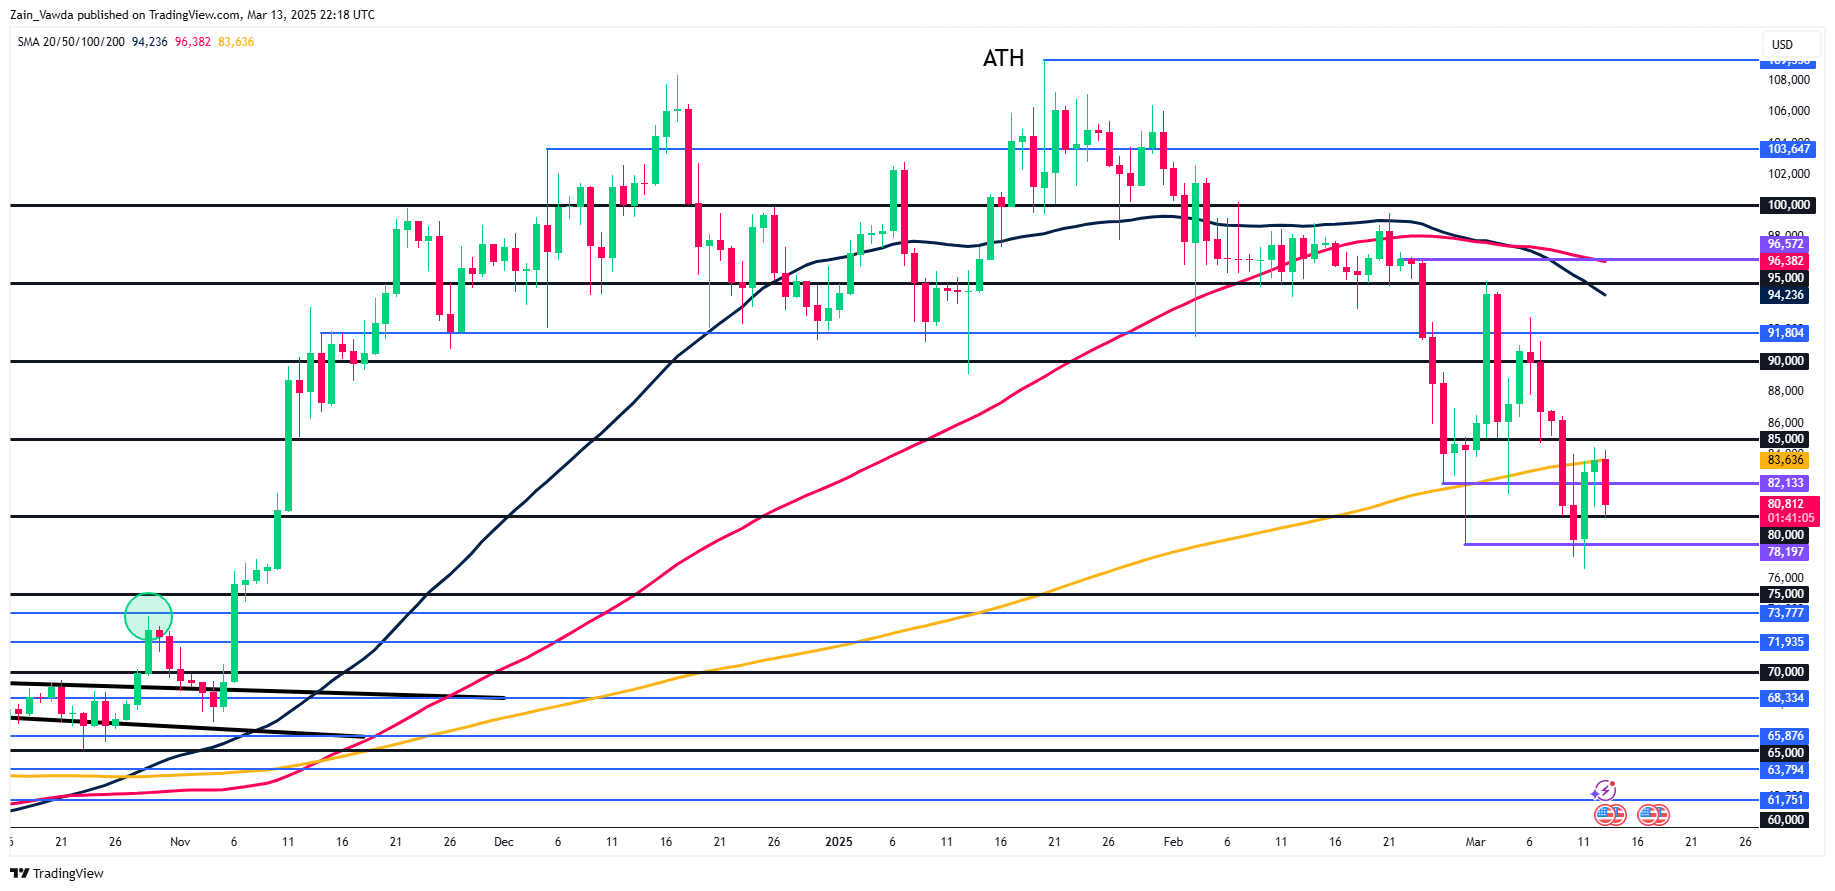
Source: TradingView.com (click to enlarge)
Support
- 80000
- 78197
- 75000
Resistance
- 82133
- 83636 (200-day MA)
- 85000
GOLD (XAUUSD) Elliott Wave: Forecasting the Rally From Equal Legs Area
Hello fellow traders,
In this technical article, we are going to present Elliott Wave charts of GOLD (XAUUSD) . As our members know we are long in GOLD from previous equal legs area. As a result, members are enjoying profits in risk-free positions. Recently ,the commodity completed its intraday correction at the Equal Legs zone. In the following sections, we will explain the Elliott Wave count.
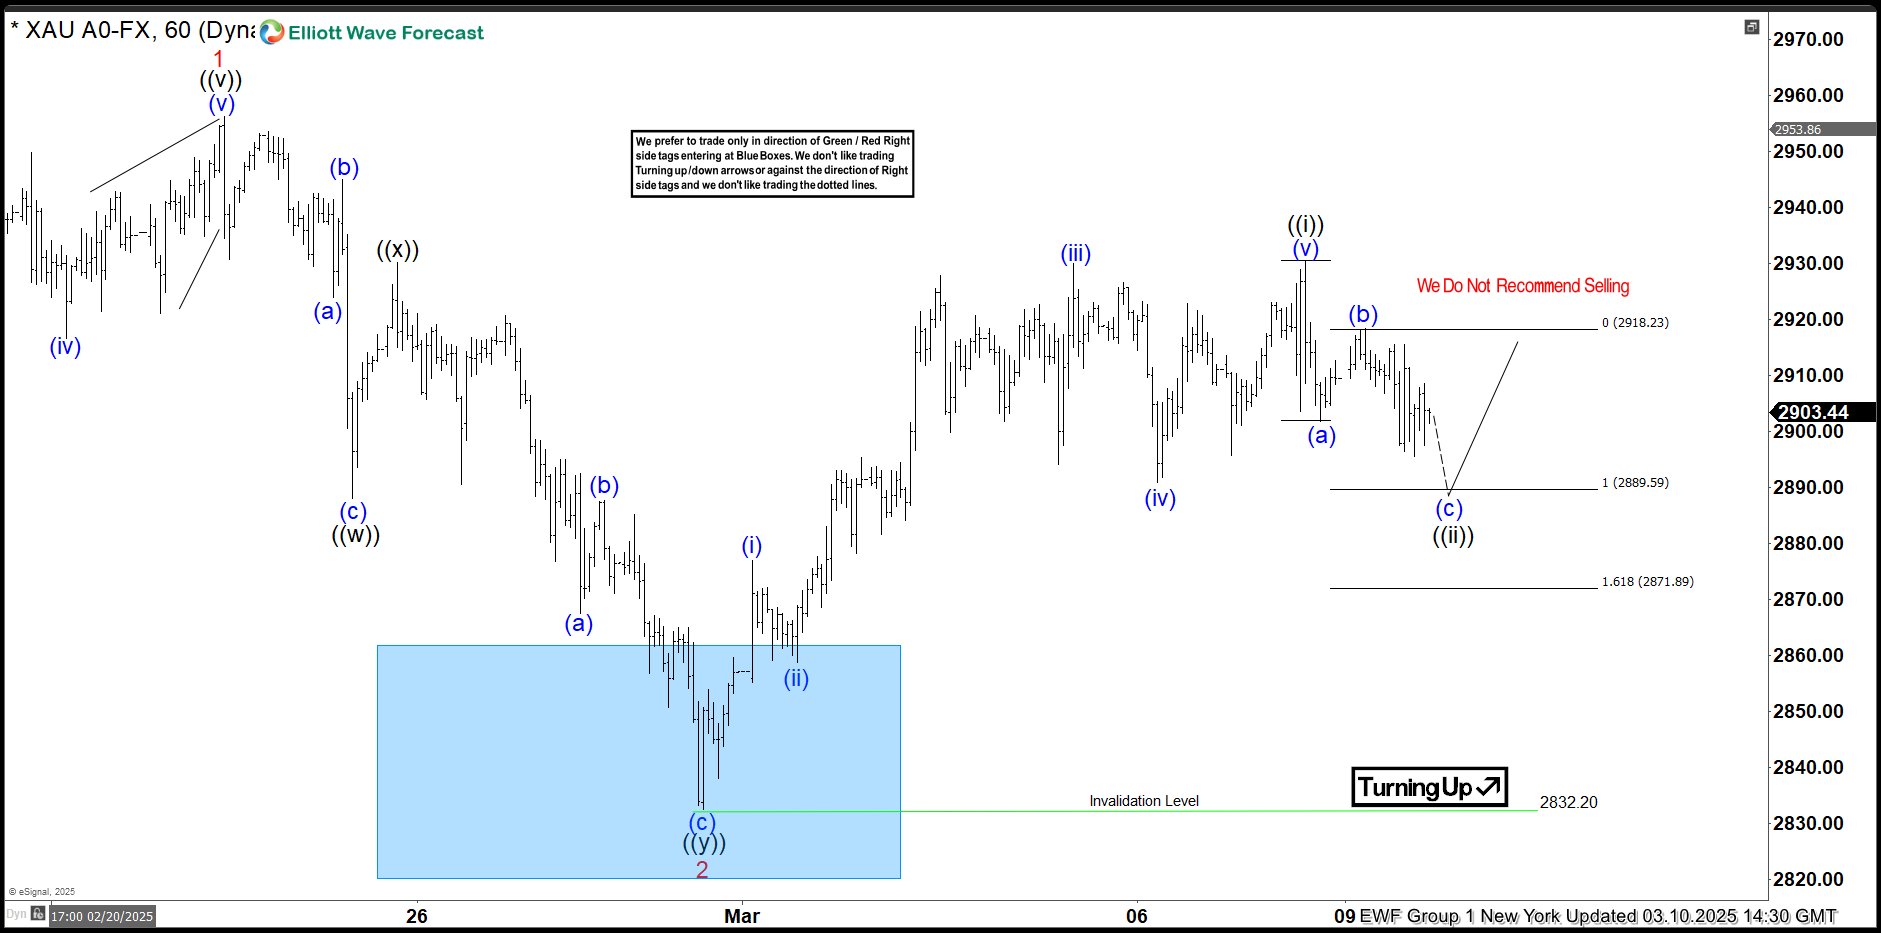
GOLD Elliott Wave 1 Hour Chart 03.10.2025
The current view suggests XAUUSD has completed a 5-waves pattern in the cycle from the 2832.2 low. GOLD is now forming a wave ((ii)) black correction. The price shows an incomplete sequence in the decline from the peak. This suggests more short-term weakness. We expect an extension toward the extreme zone at 2889.59–2871.89. At that zone buyers should re-enter, which could lead to a further rally. We recommend that members avoid selling gold.
Official trading strategy on How to trade 3, 7, or 11 swing and equal leg is explained in details in Educational Video, available for members viewing inside the membership area.
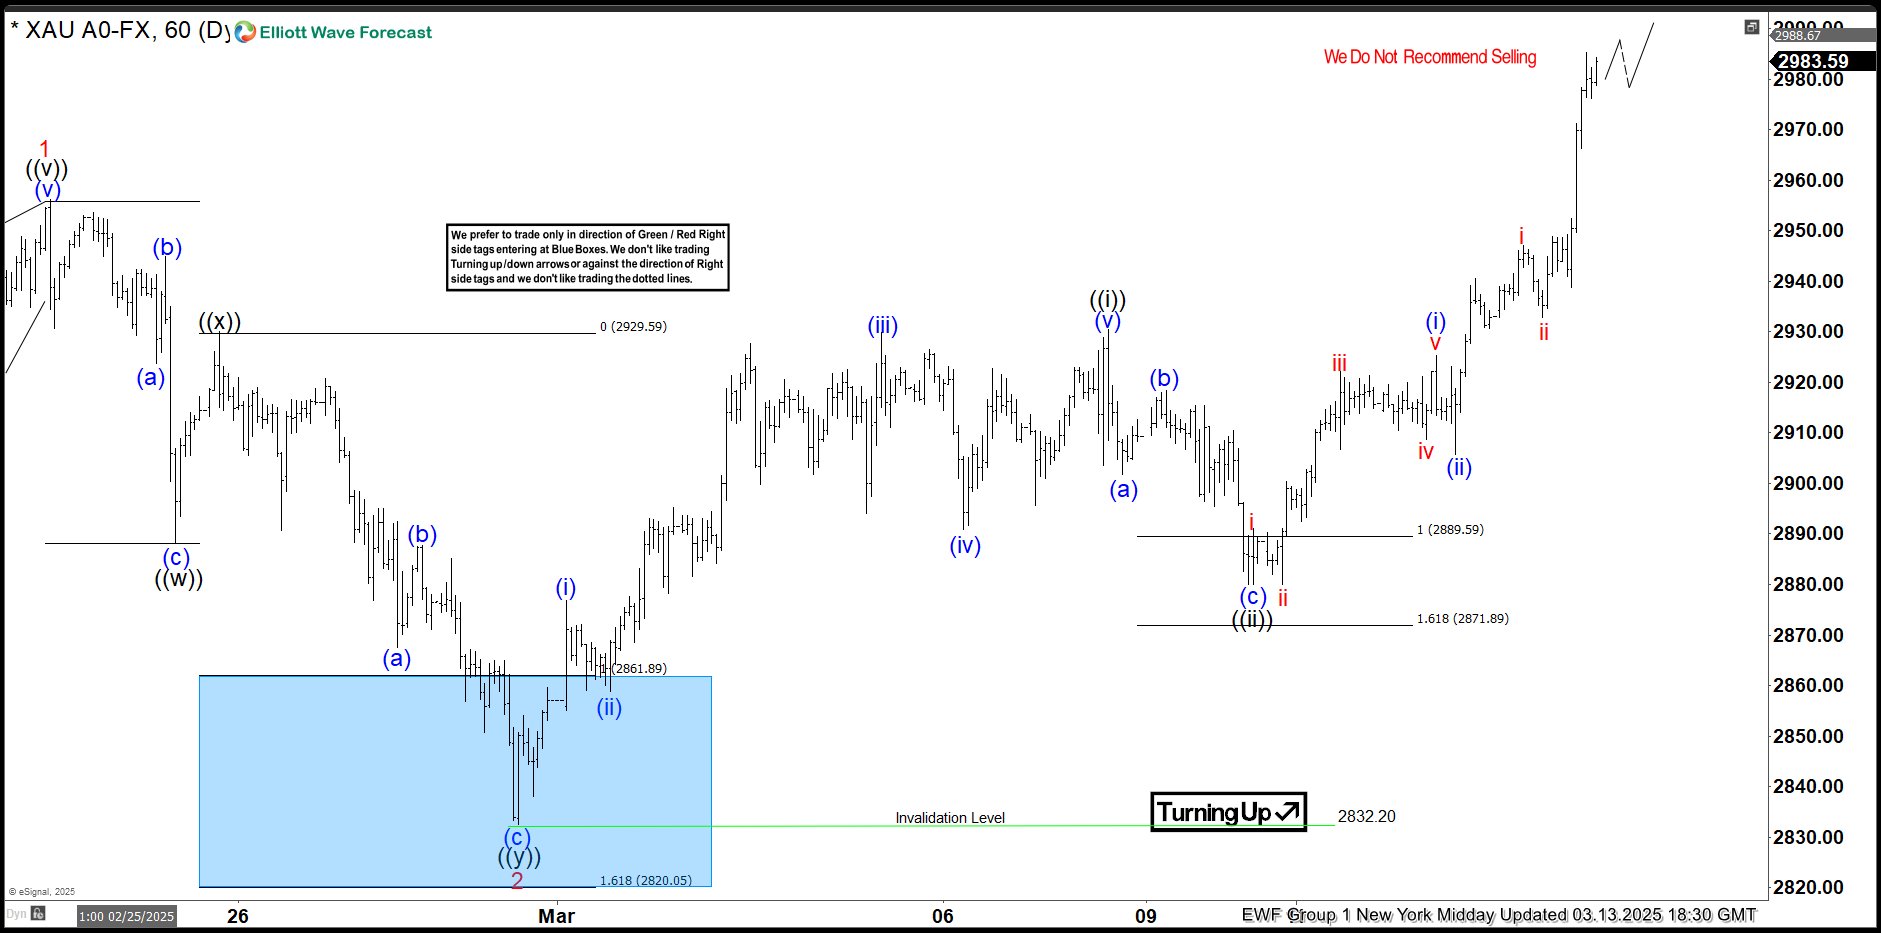
GOLD Elliott Wave 1 Hour Chart 03.04.2025
The commodity made another leg down toward the Equal Legs area and found buyers, as expected. XAUUSD is now showing a solid rally from the buying zone. The price has broken to new highs. This confirms further upward extension, provided the pivot at the 2832 low holds.
EURGBP Wave Analysis
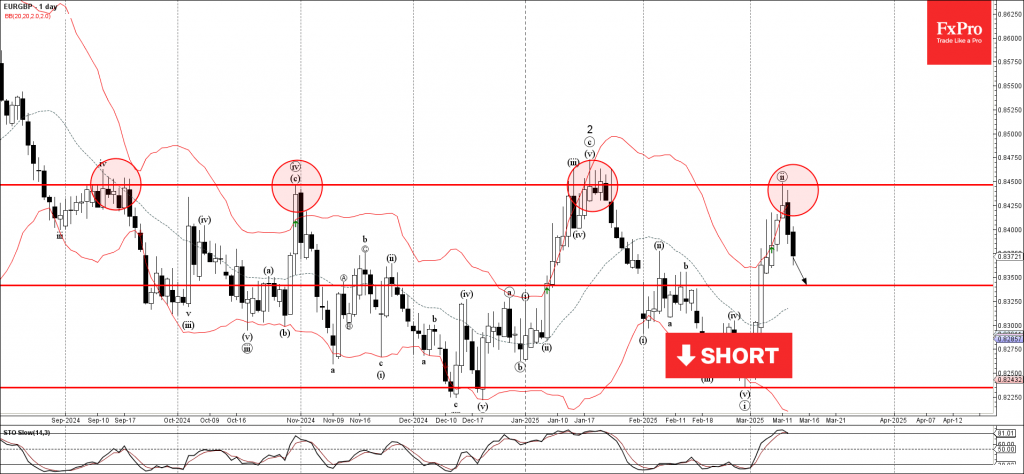
EURGBP: ⬇️ Sell
- EURGBP reversed from key resistance level 0.8450
- Likely to fall to support level 0.8340
EURGBP currency pair recently reversed down with the daily Shooting Star from the resistance area between the key resistance level 0.8450 (which has been reversing the price from September) and the upper daily Bollinger Band.
The downward reversal from this resistance area stopped the earlier short-term ABC correction ii from the end of February.
Given the strength of the resistance level 0.8450 and the overbought daily Stochastic, EURGBP currency pair can be expected to fall to the next support level 0.8340.
Gold Wave Analysis
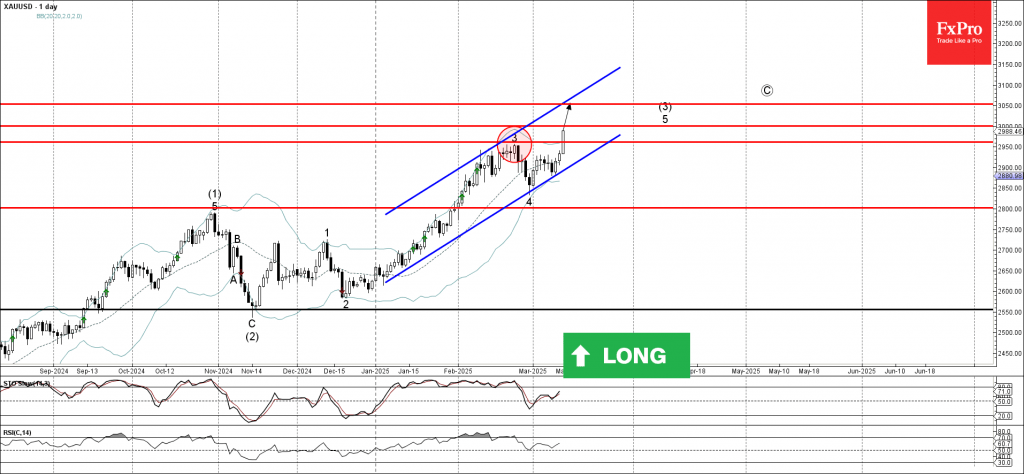
Gold: ⬆️ Buy
- Gold broke resistance level 2962.00
- Likely to rise to resistance level 3000.00
Gold rose sharply after breaking above the resistance level 2962.00 (top of the previous sharp upward impulse wave 3 from the end of February).
The breakout of the resistance level 2962.00 continues the active impulse wave 5 of the extended upward impulse sequence (3) from November.
Given the clear daily uptrend, Gold can be expected to rise to the next round resistance level 3000.00 – the breakout of which can lead to further gains toward 3050.00.
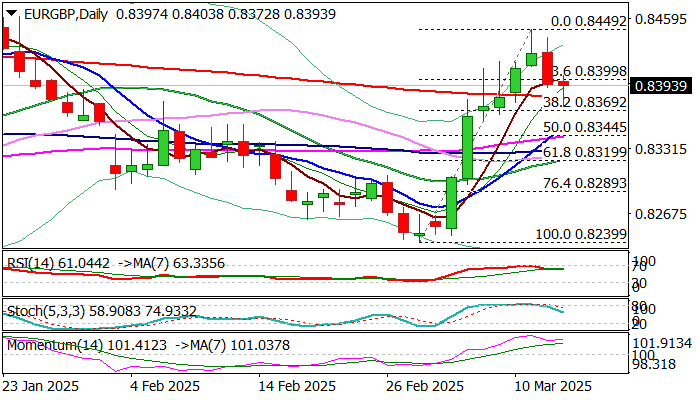
EUR/GBP: Pullback Needs to Register Close Below Key Supports to Validate Reversal Signal
EURGBP eases for the second day, with fresh weakness from new multi-month high being boosted by the latest threats that the US would impose 200% tariff in imports of wine from the EU, if the union does not ease tariffs on US whiskey.
The latest rhetoric adds to growing fears that escalating trade war would cause strong negative impact on global economy.
There is interesting situation on daily chart where reversal signal is developing.
Wednesday’s large red daily candle (the first bearish candle after six consecutive green candles) formed bearish engulfing pattern.
Today’s extension lower broke below 200DMA (0.8382) and pressured Fibo support at 0.8369 (38.2% of 0.8239/0.8449 upleg), with daily close below these levels needed to confirm reversal signal and open way for deeper correction.
However, bounce back above 200DMA sidelines immediate hopes of reversal and signals potential alternative scenario on formation of bear trap under 200DMA.
Predominantly bullish daily studies favor scenario of limited dips before larger bulls regain full control.
Look for reaction on 0.8382/69 levels for fresh direction signals.
Res: 0.8417; 0.8449; 0.8473; 0.8500
Sup: 0.8383; 0.8369; 0.8344; 0.8330
Sunset Market Commentary
Markets
EUR/USD’s stellar rally over the last couple of days ran into resistance recently. After hitting 1.09 for the first time since October of last year, it is trading around 1.085 currently on a combination of both euro weakness and dollar strength. We spotted a few drivers, including a special session in the outgoing German parliament today to discuss the €500bn infrastructure fund and the sweeping changes to the country’s debt brake proposed by the CDU/CSU and SPD. While it’s widely assumed the Greens, whose support is critical in reaching the two-third majority, will support it eventually, they are aiming for some last minute concessions. They have time on their side with the final vote scheduled for next Tuesday. The political scene undermines some of the initial optimism. Next we have Donald Trump. The US president is on a roll again on Truth Social, threatening the EU with a 200% tariff on wine, champagne and other alcoholic beverages. The rant came as the EU unveiled countermeasures, including a 50% tariff on imported bourbon, in response to the 25% US levy on steel and aluminum introduced earlier this week. Finally, Russia poured cold water over the US-Ukrainian 30-day ceasefire agreement. President Putin’s foreign policy adviser told state television that they don’t want a temporary truce and instead push for a long-term peace settlement that takes into account all of their “concerns”. The rejection comes as Russia is gaining the upper hand in the Kursk region, which fell into Ukrainian hands after a surprise attack last August. US officials today landed in Moscow for talks. The (geo)political developments also benefit traditional FX safe havens including JPY (in particular against the euro) and the Swiss franc. Core bonds trade mixed with US Treasury yields extending their tentative bottoming. Rates add between 1.4-2.7 bps with lower-than-expected February PPIs only temporarily interrupting the move higher. Headline PPI was flat on a monthly basis (3.2% y/y) compared to the 0.3% expected rise. Core gauges (ex food, ex energy) missed the bar too. Some of them came with an upward January revision though, offsetting some of the downside miss. It’s also likely that the March import tariffs will have upside consequences for next month’s reading. Weekly jobless claims printed in line with expectations (220k vs 225k). German Bunds outperform in a bear steepening move (2-yr eases 2.7 bps). Stock markets are back in the defensive again after yesterday’s recovery attempt. The EuroStoxx50 sheds 0.5%. WS pared opening losses between 0.4% and 1.3% to around half.
News & Views
The Kiel IFW German economic institute in its spring economic forecast kept its projection for German economic growth at stagnation (0.0%) this year, but sharply upwardly revised its outlook for 2026 (1.5% from 0.9%). For this year, structural issues are unlikely to abate. The forecast assumes the US administration raising tariffs on German imports to further dampen GDP. Uncertainty on the US trade policy as such also is a negative in a context were the Germany already became noticeably less competitive. However, for next year, the institute assumes that some of the plans agreed in the initial government negotiations between SPD and CDU will lead to a much more expansionary fiscal policy. Investment is expected to bottom out after four years of decline to grow again in 2026 due to less restrictive monetary policy, an improving economic environment and an increase in public investment. Employment should pick up next year after falling this year. The budget deficit would rise to 3.4% of GDP in 2026, after falling to 2.4% this year. The debt-to-GDP ratio is projected to increase from 63.3% in 2024 to 65.4% in 2026. The more expansionary fiscal policy is expected to only become increasingly apparent in debt levels in the years after.
Retail sales in the Czech Republic in January were substantially weaker than expected. According to the Czech statistical office, real sales (ex motor vehicles) decreased 0.5% M/M, easing Y/Y growth to a 7-month low of 2.7% from 6.4% in December and vs expectations of 4.2% Y/Y. Sale of automotive fuel by rose 5.4% Y/Y, of non-food goods by 3.1% and of food by 1.5%. Lower sales were recorded for information and communication equipment. Signs of subdued domestic demand, if confirmed, might support the debate on further easing by the Czech central bank (CNB). After reducing the policy rate by 25 bps to 3.75% in February, governor Michl indicated CNB would be very cautious. Vice governor Zamrazilova in an interview yesterday suggested two more cuts this year given recent inflation data (2.7%). She assessed the neutral rate to be somewhere just above 3.0%.
Greenback Strengthens as Euro Pulls Back and US-EU Trade Tensions Escalate
Dollar is staging a notable rebound as markets transition into US session, though the exact catalyst behind the move is unclear. Part of Dollar’s strength could be attributed to a broad pullback in Euro, as traders begin to take profits after this month's strong gain. Euro’s retreat is providing the greenback with some temporary relief. However, broader geopolitical and trade tensions may also be influencing the market’s cautious sentiment.
Trade tensions between the U.S. and Europe continue to escalate following fresh threats from US President Donald Trump. In response to the EU’s plan to impose retaliatory tariffs on American whiskey, Trump warned of a potential 200% tariff on European wine, champagne, and spirits. This marks an escalation in the ongoing trade dispute that began with Washington’s 25% tariffs on steel and aluminum imports.
At the same time, geopolitical uncertainties are deepening as U.S. officials arrive in Moscow for ceasefire discussions over the Ukraine conflict. Russia appears to be taking a hardline stance, with Presidential Aide Yuri Ushakov dismissing the proposed truce as nothing more than a temporary reprieve for Ukraine’s military. Ushakov emphasized that Russia’s ultimate objective remains a long-term peace settlement that prioritizes its own national interests. This rigid position suggests that negotiations may not yield immediate breakthroughs.
Against this backdrop, Dollar is emerging as the strongest performer of the day, followed by Yen and Loonie. On the other hand, Kiwi is currently the weakest performer, followed by Aussie and Euro. Sterling and the Swiss Franc are positioned in the middle.
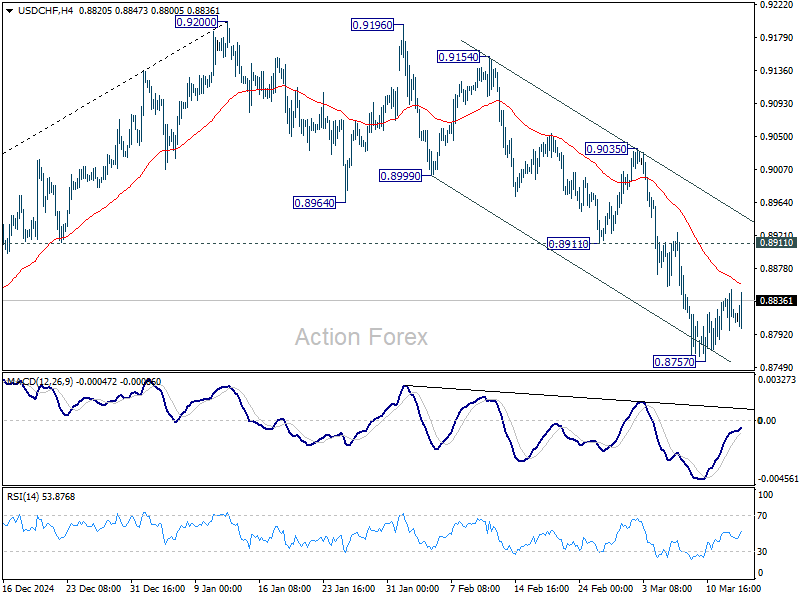
Technically, though, it's way too early to conclude that Dollar is reversing its near term down trend. For example, USD/CHF's recovery from 0.8757 is seen as a corrective pattern that should be limited below 0.8911 support turned resistance. Fall from 0.9200 is still expected to resume at a later stage.
In Europe, at the time of writing, FTSE is up 0.07%. DAX is down -0.49%. CAC is down -0.33%. UK 10-year yield is up 0.018 at 4.698. Germany 10-year yield is flat at 2.882. Earlier in Asia, Nikkei fell 0.08%. Hong Kong HSI fell -0.58%. China Shanghai SSE fell -0.39%. Singapore Strait Times rose 0.12%. Japan 10-year JGB yield rose 0.023 to 1.547.
US PPI at 0.0% mom, 3.2% yoy in Feb, below expectations
US PPI for final demand as unchanged in February, coming in below expectations of 0.3% mom rise. The 0.3% mom increase in goods prices was offset by -0.2% mom decline in services.
On an annual basis, PPI slowed to 3.2% yoy, down from January’s 3.7% yoy and missing the expected 3.3% yoy reading.
PPI excluding food, energy, and trade services, rose 0.2% mom. Over the past 12 months, this measure advanced 3.3% yoy, maintaining a relatively steady pace.
US intial jobless claims tick down to 220k, vs exp 224k
US initial jobless claims fell -2k to 220k in the week ending March 8, slightly below expectation of 224k. Four-week moving average of initial claims rose 1.5k to 226k.
Continuing claims fell -27k to 1870k in the week ending March 1. Four-week moving average of continuing claims rose 6k to 1872k.
ECB’s Nagel: Tariffs could push Germany into recession again, but Fiscal shift provides stability
German ECB Governing Council member Joachim Nagel warned that Germany could face a third consecutive year of economic contraction if US tariffs take full effect. Speaking to BBC, Nagel noted that without the tariffs, Germany’s economy was already expected to stagnate with minimal growth of around 0.2%. With escalating trade tensions, the risk of another recession looms large.
Nagel sharply criticized US President Donald Trump’s tariff policies, calling them “economics from the past” and “definitely not a good idea.” He defended the EU’s decision to impose retaliatory tariffs, adding that such a response was a "necessity" rather than a choice.
Addressing Germany’s recent shift in fiscal policy, Nagel described the decision to increase borrowing for defense and infrastructure spending as an "extraordinary measure for an extraordinary time."
He pointed out that the global economy is undergoing “tectonic changes,” which justify a more flexible approach to fiscal management. While Germany has traditionally maintained strict budget discipline, this shift would provide "some financial breathing room" to support recovery in the coming years, and send a "stability signal" to markets.
Eurozone industrial production rises 0.8% mom, led by intermediate and capital goods
Eurozone industrial production posted a solid 0.8% mom increase in January, aligning with market expectations. The gains were driven primarily by a 1.6% rise in intermediate goods output and a 0.5% increase in capital goods production. However, declines were seen in other categories, with energy production falling by -1.2%, durable consumer goods slipping -0.2%, and non-durable consumer goods dropping -3.1%.
Across the broader European Union, industrial production rose by a more modest 0.3% mom. Among individual member states, Lithuania (+4.6%), Portugal (+3.7%), and Austria (+3.3%) recorded the strongest gains, while Malta (-12.9%), Denmark (-10.6%), and Slovakia (-7.3%) saw the sharpest declines.
BoJ’s Ueda expects real wages to rise, boosting consumption
BoJ Governor Kazuo Ueda signaled optimism about Japan’s economic outlook, telling the parliament today that "import-cost-driven inflation" is expected to moderate while wages continue to "rise steadily." This shift could lead to an improvement in real wages and consumption, a critical factor for sustaining domestic demand.
Ueda’s comments align with recent developments in Japan’s annual "shunto" wage negotiations, which have resulted in record pay hikes across major companies.
Hitachi announced a record 6.2% rise in monthly wages, fully meeting union demands. Toyota’s key auto parts supplier, Denso, also committed to historic pay hikes, while Toyota itself stated that the overall wage increase for its manufacturing staff would match last year’s levels—the highest seen since 1999.
Further clarity on the scale of wage hikes will come on March 14, when Rengo, Japan’s largest labor union federation representing 7 million workers, releases its preliminary report. Rengo had been seeking an average wage increase of 6.09%, up from last year’s 5.85%.
EUR/USD Mid-Day Outlook
Daily Pivots: (S1) 1.0867; (P) 1.0897; (R1) 1.0919; More...
Intraday bias in EUR/USD stays neutral first. Deeper retreat might be seen towards 55 4H EMA (now at 1.0762). But strong support should be seen from 38.2% retracement of 1.0358 to 1.0946 at 1.0721 to contain downside. On the upside, break of 1.0946 will resume the rally from 1.0176 to retest 1.1274 key resistance next.
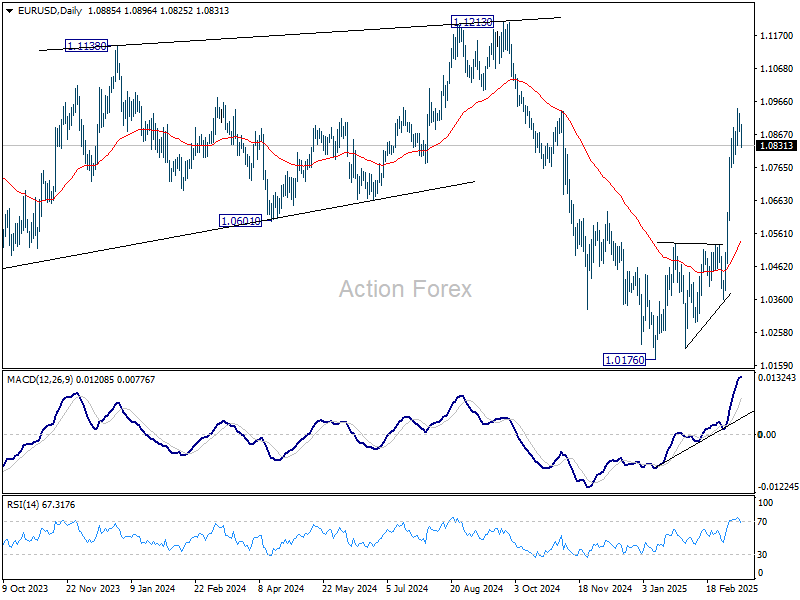
In the bigger picture, the strong break of 55 W EMA (now at 1.0675) suggests that fall from 1.1274 (2024 high) has completed as a three wave correction to 1.0176. Rise from 0.9534 is still intact, and might be ready to resume. Decisive break of 1.1274 will target 100% projection of 0.9534 to 1.1274 from 1.0176 at 1.1916. Also, that will send EUR/USD through a multi-decade channel resistance will carries larger bullish implication. This will now be the favored case as long as 1.0531 resistance turned support holds.
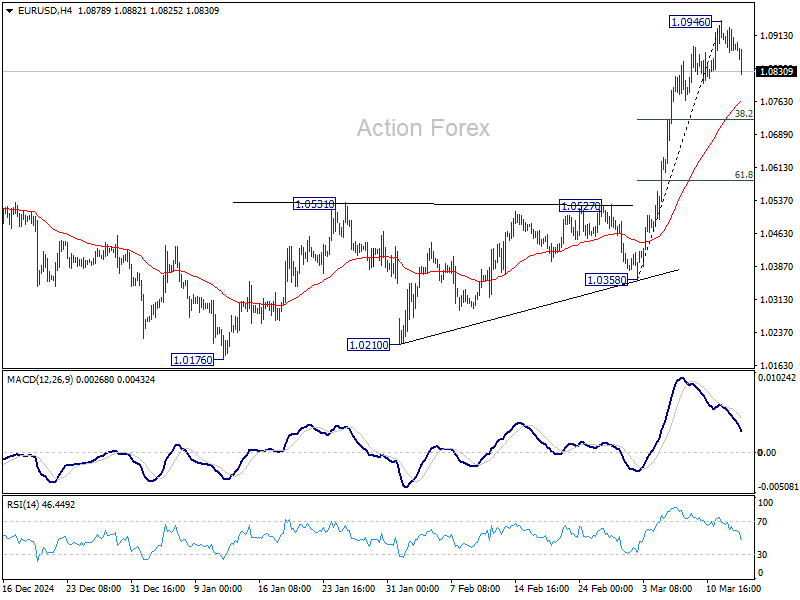
EUR/USD Mid-Day Outlook
Daily Pivots: (S1) 1.0867; (P) 1.0897; (R1) 1.0919; More...
Intraday bias in EUR/USD stays neutral first. Deeper retreat might be seen towards 55 4H EMA (now at 1.0762). But strong support should be seen from 38.2% retracement of 1.0358 to 1.0946 at 1.0721 to contain downside. On the upside, break of 1.0946 will resume the rally from 1.0176 to retest 1.1274 key resistance next.
In the bigger picture, the strong break of 55 W EMA (now at 1.0675) suggests that fall from 1.1274 (2024 high) has completed as a three wave correction to 1.0176. Rise from 0.9534 is still intact, and might be ready to resume. Decisive break of 1.1274 will target 100% projection of 0.9534 to 1.1274 from 1.0176 at 1.1916. Also, that will send EUR/USD through a multi-decade channel resistance will carries larger bullish implication. This will now be the favored case as long as 1.0531 resistance turned support holds.
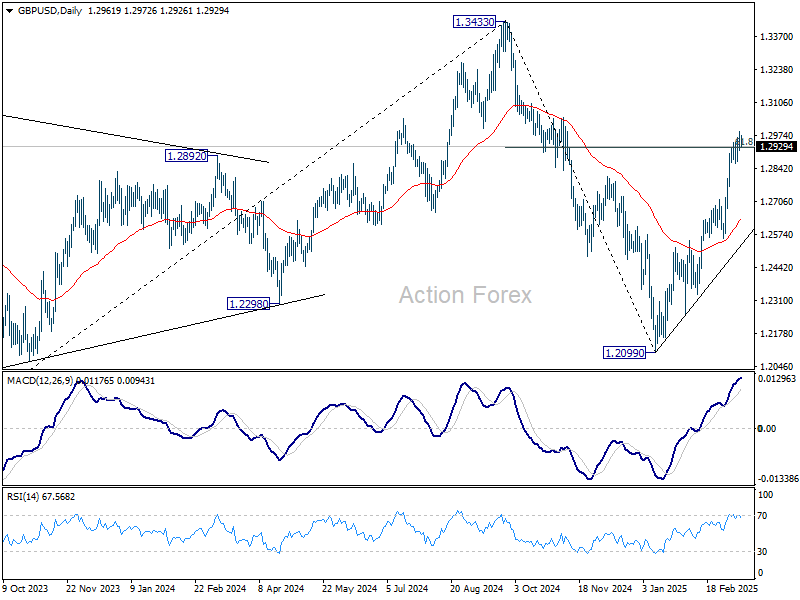
GBP/USD Mid-Day Outlook
Daily Pivots: (S1) 1.2925; (P) 1.2955; (R1) 1.2997; More...
Further rise remains mildly in favor with 1.2860 minor support intact. Sustained trading above 61.8% retracement of 1.3433 to 1.2099 at 1.2923 will resume the rise from 1.2099, and pave the way back to 1.3433 high. Nevertheless, break of 1.2860 support should indicate short term topping and turn bias back to the downside for deeper pullback.
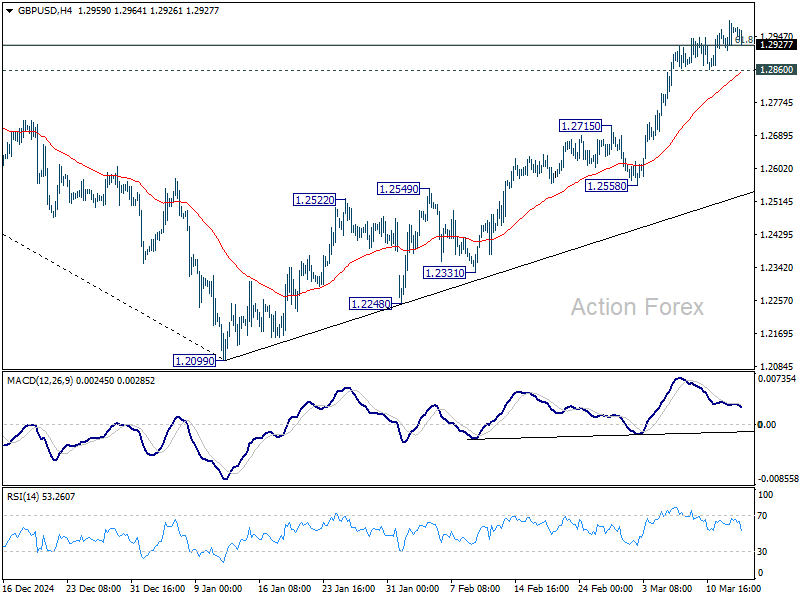
In the bigger picture, fall from 1.3433 (2024 high) should have completed at 1.2099 as a corrective move. Up trend from 1.3051 (2022 low) is still in progress but it's too early to say that it's resuming. Corrective pattern from 1.3433 could extend with one more down leg. But after all, eventual upside breakout is expected at a later stage.