
Sample Category Title
USD/CHF Mid-Day Outlook
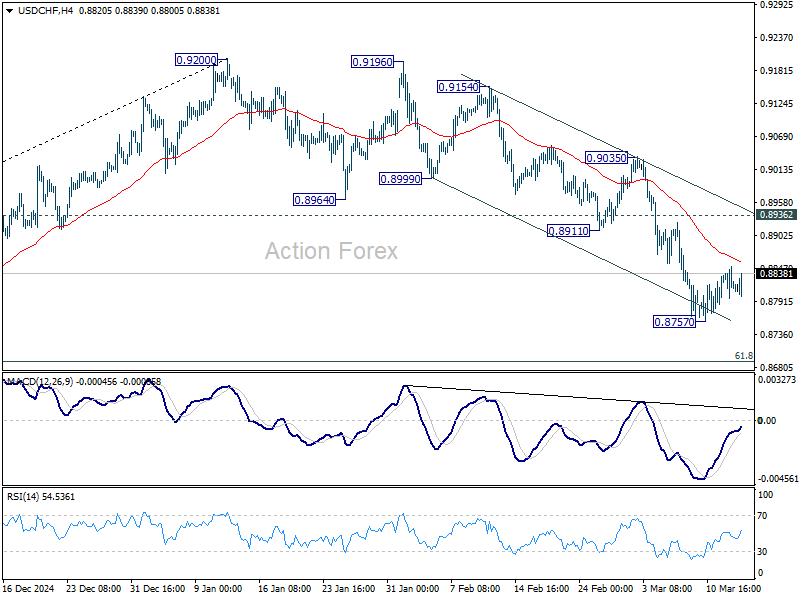
Daily Pivots: (S1) 0.8790; (P) 0.8821; (R1) 0.8849; More…
USD/CHF is still bounded in consolidation from 0.8757 and intraday bias remains neutral for the moment. Upside of recovery should be limited by 0.8911 support turned resistance to bring another fall. On the downside, below 0.8757 will resume the fall from 0.9200 and target 61.8% retracement of 0.8374 to 0.9200 at 0.8690. Sustained break there will pave the way back to 0.8374 support.
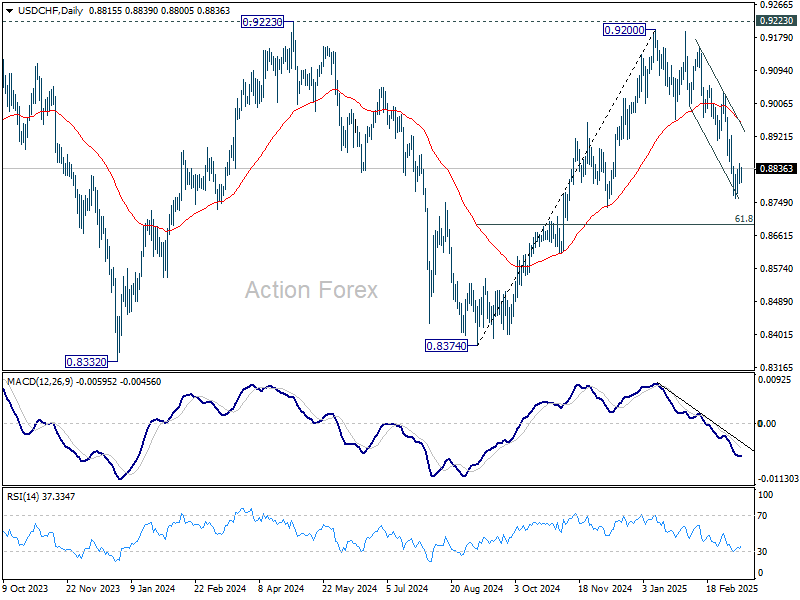
In the bigger picture, rejection by 0.9223 key resistance keep medium term outlook bearish. That is, larger fall from 1.0342 (2017 high) is not completed yet. Firm break of 0.8332 (2023 low) will confirm down trend resumption.
USD/JPY Mid-Day Outlook
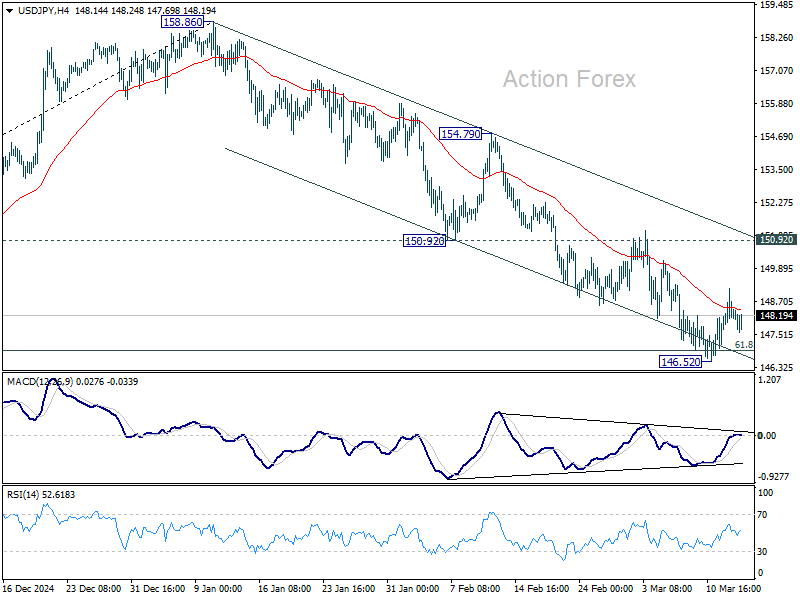
Daily Pivots: (S1) 147.51; (P) 148.35; (R1) 149.10; More...
USD/JPY is still extending consolidation from 146.52 and intraday bias remains neutral at this point. Upside of recovery should be limited by 150.92 support turned resistance. On the downside, sustained trading below 61.8% retracement of 139.57 to 158.86 at 146.32 will pave the way to 139.57 support.
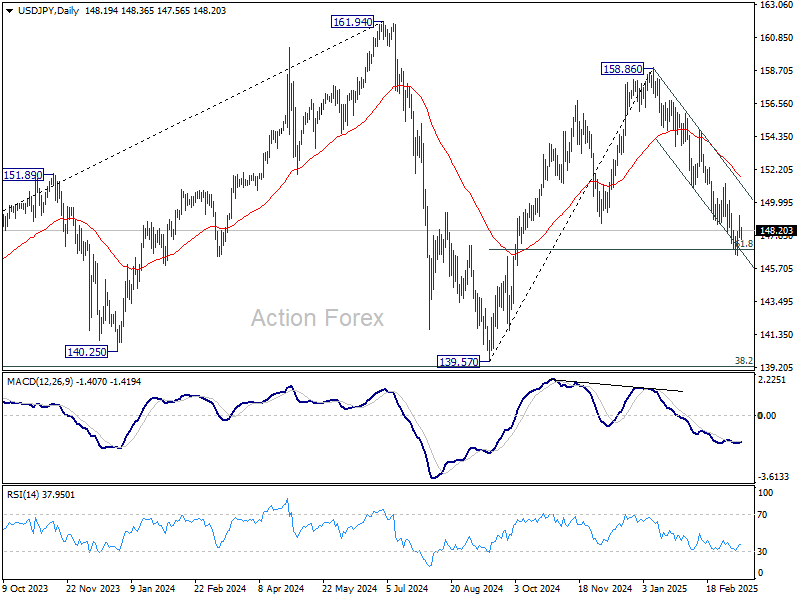
In the bigger picture, price actions from 161.94 are seen as a corrective pattern to rise from 102.58 (2021 low), with fall from 158.86 as the third leg. Strong support should be seen from 38.2% retracement of 102.58 to 161.94 at 139.26 to bring rebound. However, sustained break of 139.26 would open up deeper medium term decline to 61.8% retracement at 125.25.
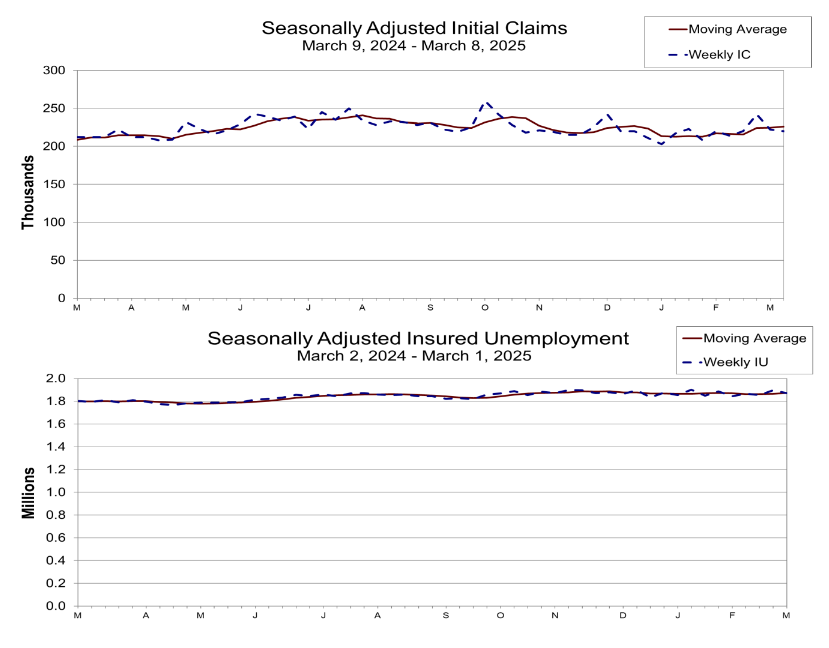
US intial jobless claims tick down to 220k, vs exp 224k
US initial jobless claims fell -2k to 220k in the week ending March 8, slightly below expectation of 224k. Four-week moving average of initial claims rose 1.5k to 226k.
Continuing claims fell -27k to 1870k in the week ending March 1. Four-week moving average of continuing claims rose 6k to 1872k.
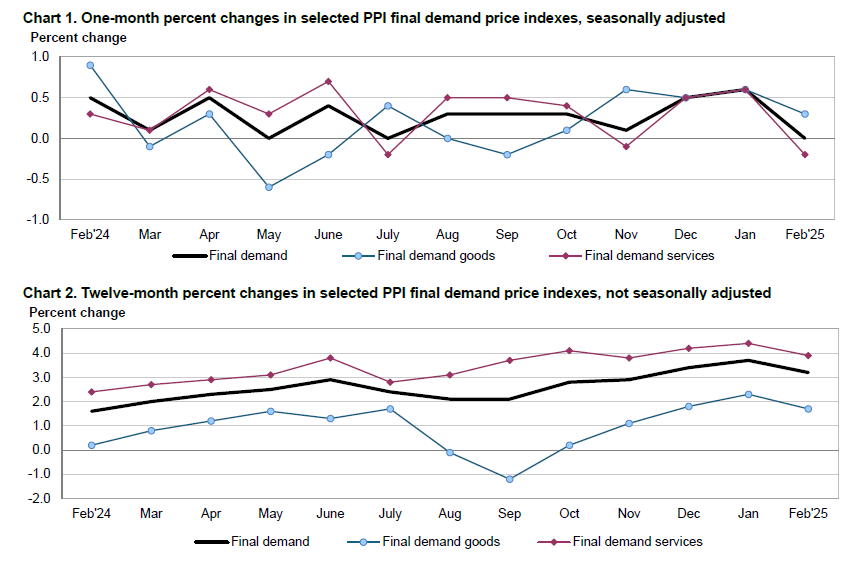
US PPI at 0.0% mom, 3.2% yoy in Feb, below expectations
US PPI for final demand as unchanged in February, coming in below expectations of 0.3% mom rise. The 0.3% mom increase in goods prices was offset by -0.2% mom decline in services.
On an annual basis, PPI slowed to 3.2% yoy, down from January’s 3.7% yoy and missing the expected 3.3% yoy reading.
PPI excluding food, energy, and trade services, rose 0.2% mom. Over the past 12 months, this measure advanced 3.3% yoy, maintaining a relatively steady pace.
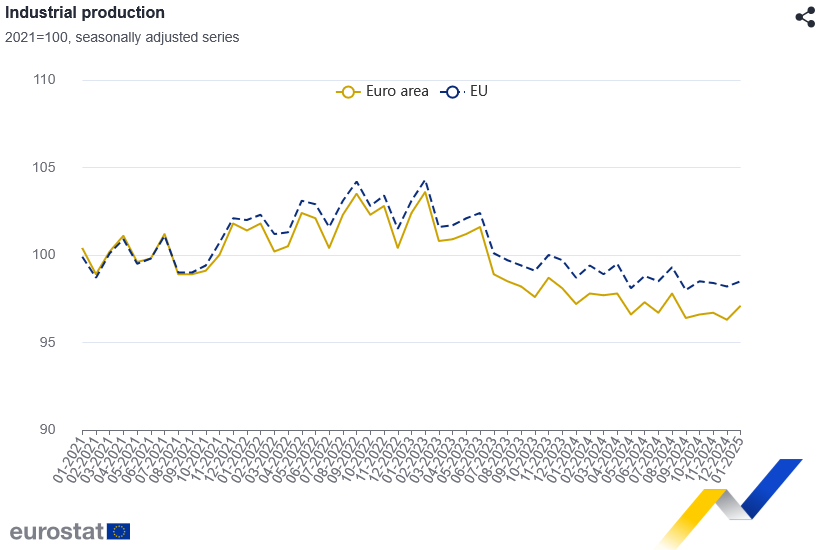
Eurozone industrial production rises 0.8% mom, led by intermediate and capital goods
Eurozone industrial production posted a solid 0.8% mom increase in January, aligning with market expectations. The gains were driven primarily by a 1.6% rise in intermediate goods output and a 0.5% increase in capital goods production. However, declines were seen in other categories, with energy production falling by -1.2%, durable consumer goods slipping -0.2%, and non-durable consumer goods dropping -3.1%.
Across the broader European Union, industrial production rose by a more modest 0.3% mom. Among individual member states, Lithuania (+4.6%), Portugal (+3.7%), and Austria (+3.3%) recorded the strongest gains, while Malta (-12.9%), Denmark (-10.6%), and Slovakia (-7.3%) saw the sharpest declines.
Gold: Price Nears New Record High as Growing Uncertainty Continues to Fuel Safe Haven Demand
Gold price rose further on Thursday and pressure all-time high $2956 (Feb 24) after fresh post-US CPI acceleration took out last significant barriers at $2926/30.
Growing fears of economic slowdown on escalating trade war that contributes to scenario of more Fed rate cuts, along with lower than expected US inflation in February, further boosted demand for the yellow metal.
Technical studies on daily chart improved following the latest advance that extends into third straight day, as MA’s turned to full bullish setup and 14-d momentum broke into positive territory.
The latest action also contributes to signals that correction ($2956/$2832) is likely over and bulls may challenge new top for continuation of larger uptrend, paused for a healthy correction.
Firm break of $2956 trigger to expose targets at $2985 (Fibo 123.6% projection ff the upleg from $2832) and psychological $3000 barrier.
However, bulls may face increased headwinds at $2956 zone, due to significance of resistance, and consolidate before final break higher, with former pivots at $2930/26 (lower platform / Fibo 76.4%) offering solid supports which should keep the downside protected.
Res: 2956; 2985; 3000; 3003.
Sup: 2930; 2926; 2908; 2900.

ETH/USD Analysis: Ethereum Price Consolidates Near a 16-Month Low
As shown in the ETH/USD chart today, 11 March, Ethereum’s price dropped below $1,800 for the first time since autumn 2023. However:
→ the daily candle closed near its highs;
→ if the bearish candle on 14 March was an attempt to resume the downtrend, it proved unsuccessful.
Thus, we observe:
→ Ethereum’s price fluctuating around $1,880 with no signs of a renewed downtrend;
→ indications that the market has reached a temporary supply-demand equilibrium—suggesting price consolidation. It seems that selling pressure has weakened.
What could happen next?
Technical Analysis of the ETH/USD Chart
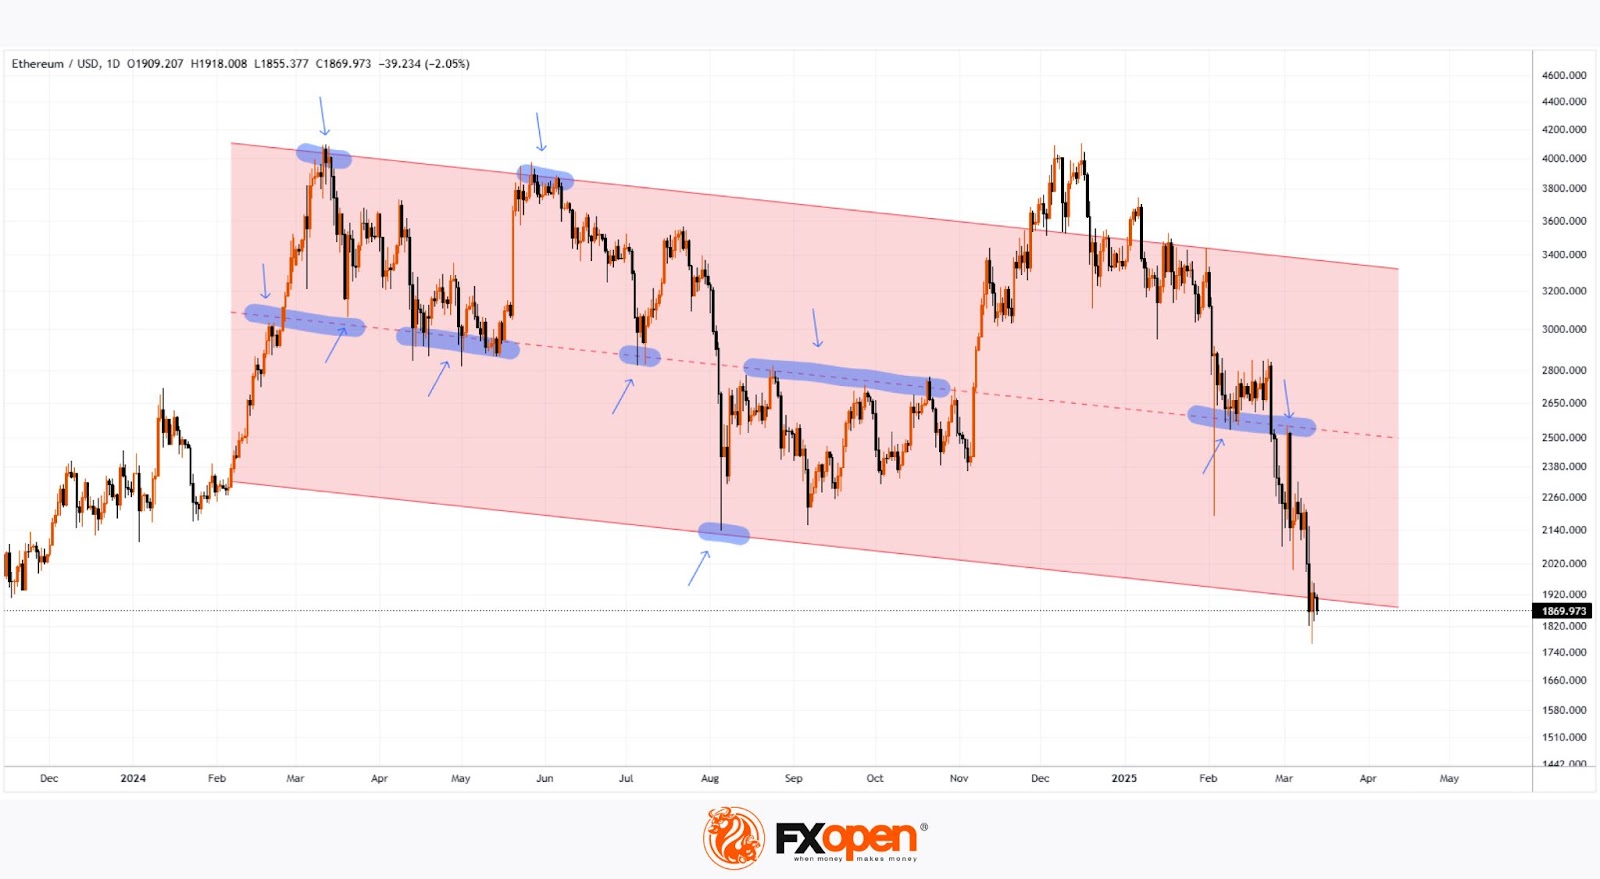
To assess ETH/USD price movements in a broader perspective over the past year:
→ the red channel illustrates Ethereum’s price dynamics;
→ blue markers highlight key interaction points between the price and channel lines (boundaries and median), reinforcing the channel’s relevance.
Applying the theory of cyclical fluctuations and market pendulum dynamics—popularised by Howard Marks in Mastering the Market Cycle—we can assume:
→ when ETH surged above the channel’s upper boundary in December 2024, driven partly by optimism surrounding Trump’s election victory, the market pendulum accumulated significant energy for the next movement (which appears to be the decline seen since early 2025);
→ now, the pendulum is nearing its lower point (where an asset’s price falls below its intrinsic value). Therefore, the next movement could be an upward shift towards the median, which currently sits around $2,500.
FXOpen offers the world's most popular cryptocurrency CFDs*, including Bitcoin and Ethereum. Floating spreads, 1:2 leverage — at your service. Open your trading account now or learn more about crypto CFD trading with FXOpen.
*Important: At FXOpen UK, Cryptocurrency trading via CFDs is only available to our Professional clients. They are not available for trading by Retail clients. To find out more information about how this may affect you, please get in touch with our team.
This article represents the opinion of the Companies operating under the FXOpen brand only. It is not to be construed as an offer, solicitation, or recommendation with respect to products and services provided by the Companies operating under the FXOpen brand, nor is it to be considered financial advice.
ECB’s Nagel: Tariffs could push Germany into recession again, but Fiscal shift provides stability
German ECB Governing Council member Joachim Nagel warned that Germany could face a third consecutive year of economic contraction if US tariffs take full effect. Speaking to BBC, Nagel noted that without the tariffs, Germany’s economy was already expected to stagnate with minimal growth of around 0.2%. With escalating trade tensions, the risk of another recession looms large.
Nagel sharply criticized US President Donald Trump’s tariff policies, calling them “economics from the past” and “definitely not a good idea.” He defended the EU’s decision to impose retaliatory tariffs, adding that such a response was a "necessity" rather than a choice.
Addressing Germany’s recent shift in fiscal policy, Nagel described the decision to increase borrowing for defense and infrastructure spending as an "extraordinary measure for an extraordinary time."
He pointed out that the global economy is undergoing “tectonic changes,” which justify a more flexible approach to fiscal management. While Germany has traditionally maintained strict budget discipline, this shift would provide "some financial breathing room" to support recovery in the coming years, and send a "stability signal" to markets.
EUR/USD Holds onto Hopes of Further Growth as Investors Assess the Risks
The EUR/USD pair is trading near 1.0887 on Thursday as investors cautiously evaluate the impact of escalating global trade tensions on the economy and consumer behaviour. Despite the uncertainty, the currency pair shows resilience, with market participants closely monitoring key developments.
Key market factors affecting EUR/USD
The primary focus remains on the ongoing global trade war, which has intensified following recent announcements by US President Donald Trump. Trump has pledged to impose additional tariffs on trading partners in response to the EU and Canada's retaliatory measures triggered by earlier US tariffs on steel and aluminium imports.
Further adding to the uncertainty, Trump reaffirmed his commitment to imposing additional retaliatory duties scheduled for April. This has intensified concerns about potential spillover effects on global markets and economic stability.
On the economic data front, US consumer inflation figures for February relieved the currency market. The Consumer Price Index (CPI) rose by 0.2% month-on-month, falling short of the expected 0.3% increase. Year-over-year, inflation eased to 2.8%, down from 3.0% in January. However, the full impact of recent tariffs is yet to materialise, leaving markets cautious about potential inflationary pressures in the coming months.
Investors are now focusing on the Federal Reserve's upcoming policy meeting next week. Market consensus suggests that the Fed will hold interest rates steady, but all eyes will be on the updated economic forecasts and any signals regarding future monetary policy. The decision could play a pivotal role in shaping the near-term trajectory of the EUR/USD pair.
Technical analysis of EUR/USD
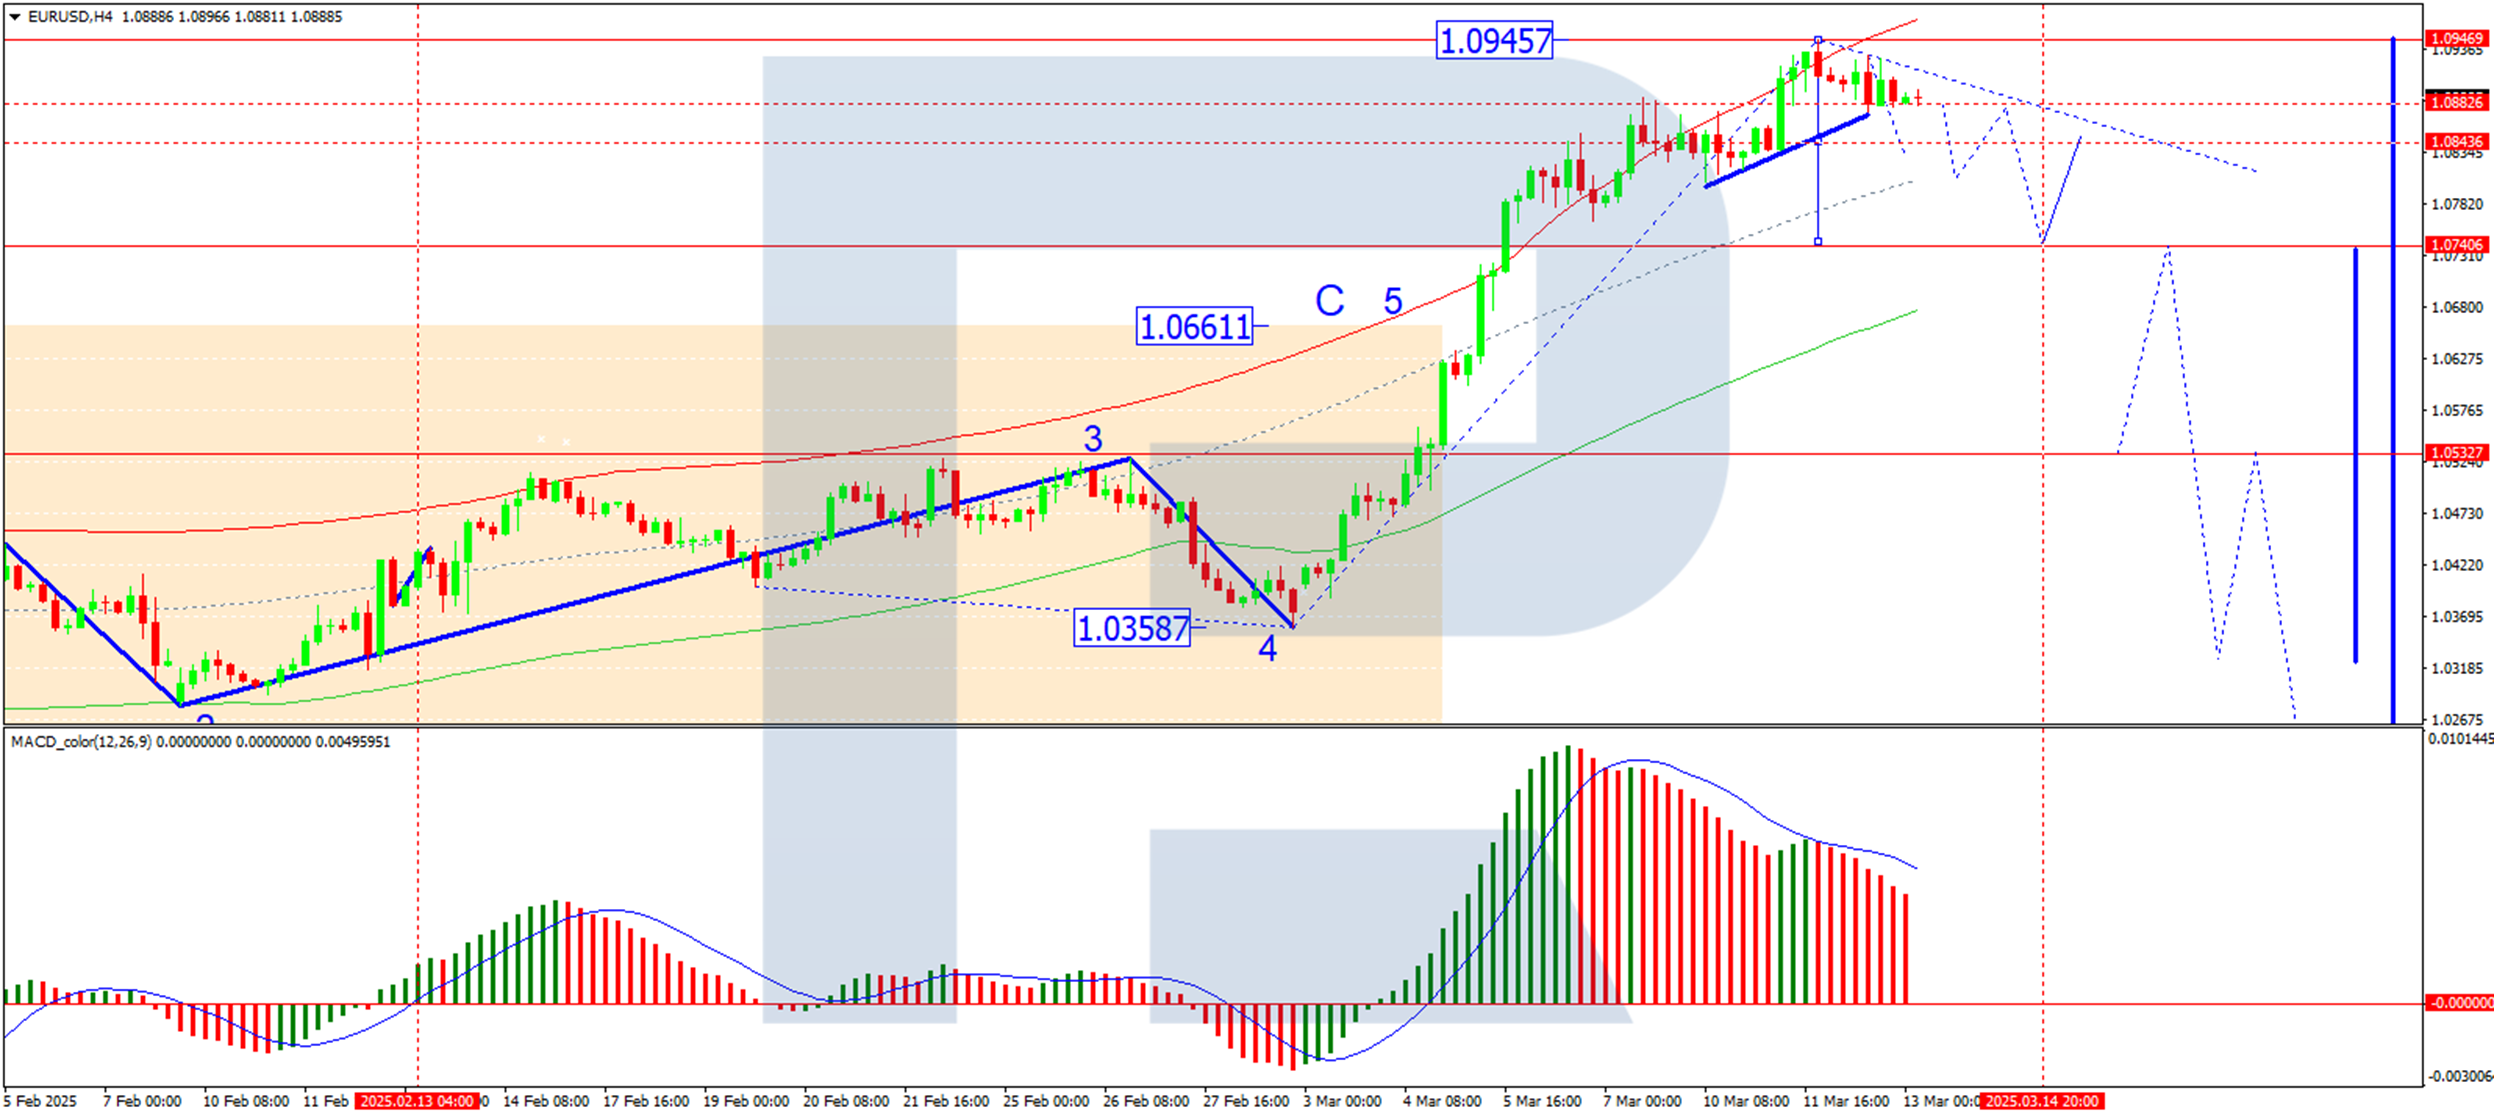
On the H4 chart, the EUR/USD pair recently completed a growth wave, reaching a high of 1.0944. Currently, the market is consolidating near the top of this wave. A downward breakout from this range is anticipated, potentially initiating the first wave of decline toward the 1.0533 level. Following this, a corrective rebound to 1.0740 could occur. This scenario is supported by the MACD indicator, whose signal line remains above zero but is trending downward, signalling weakening momentum.
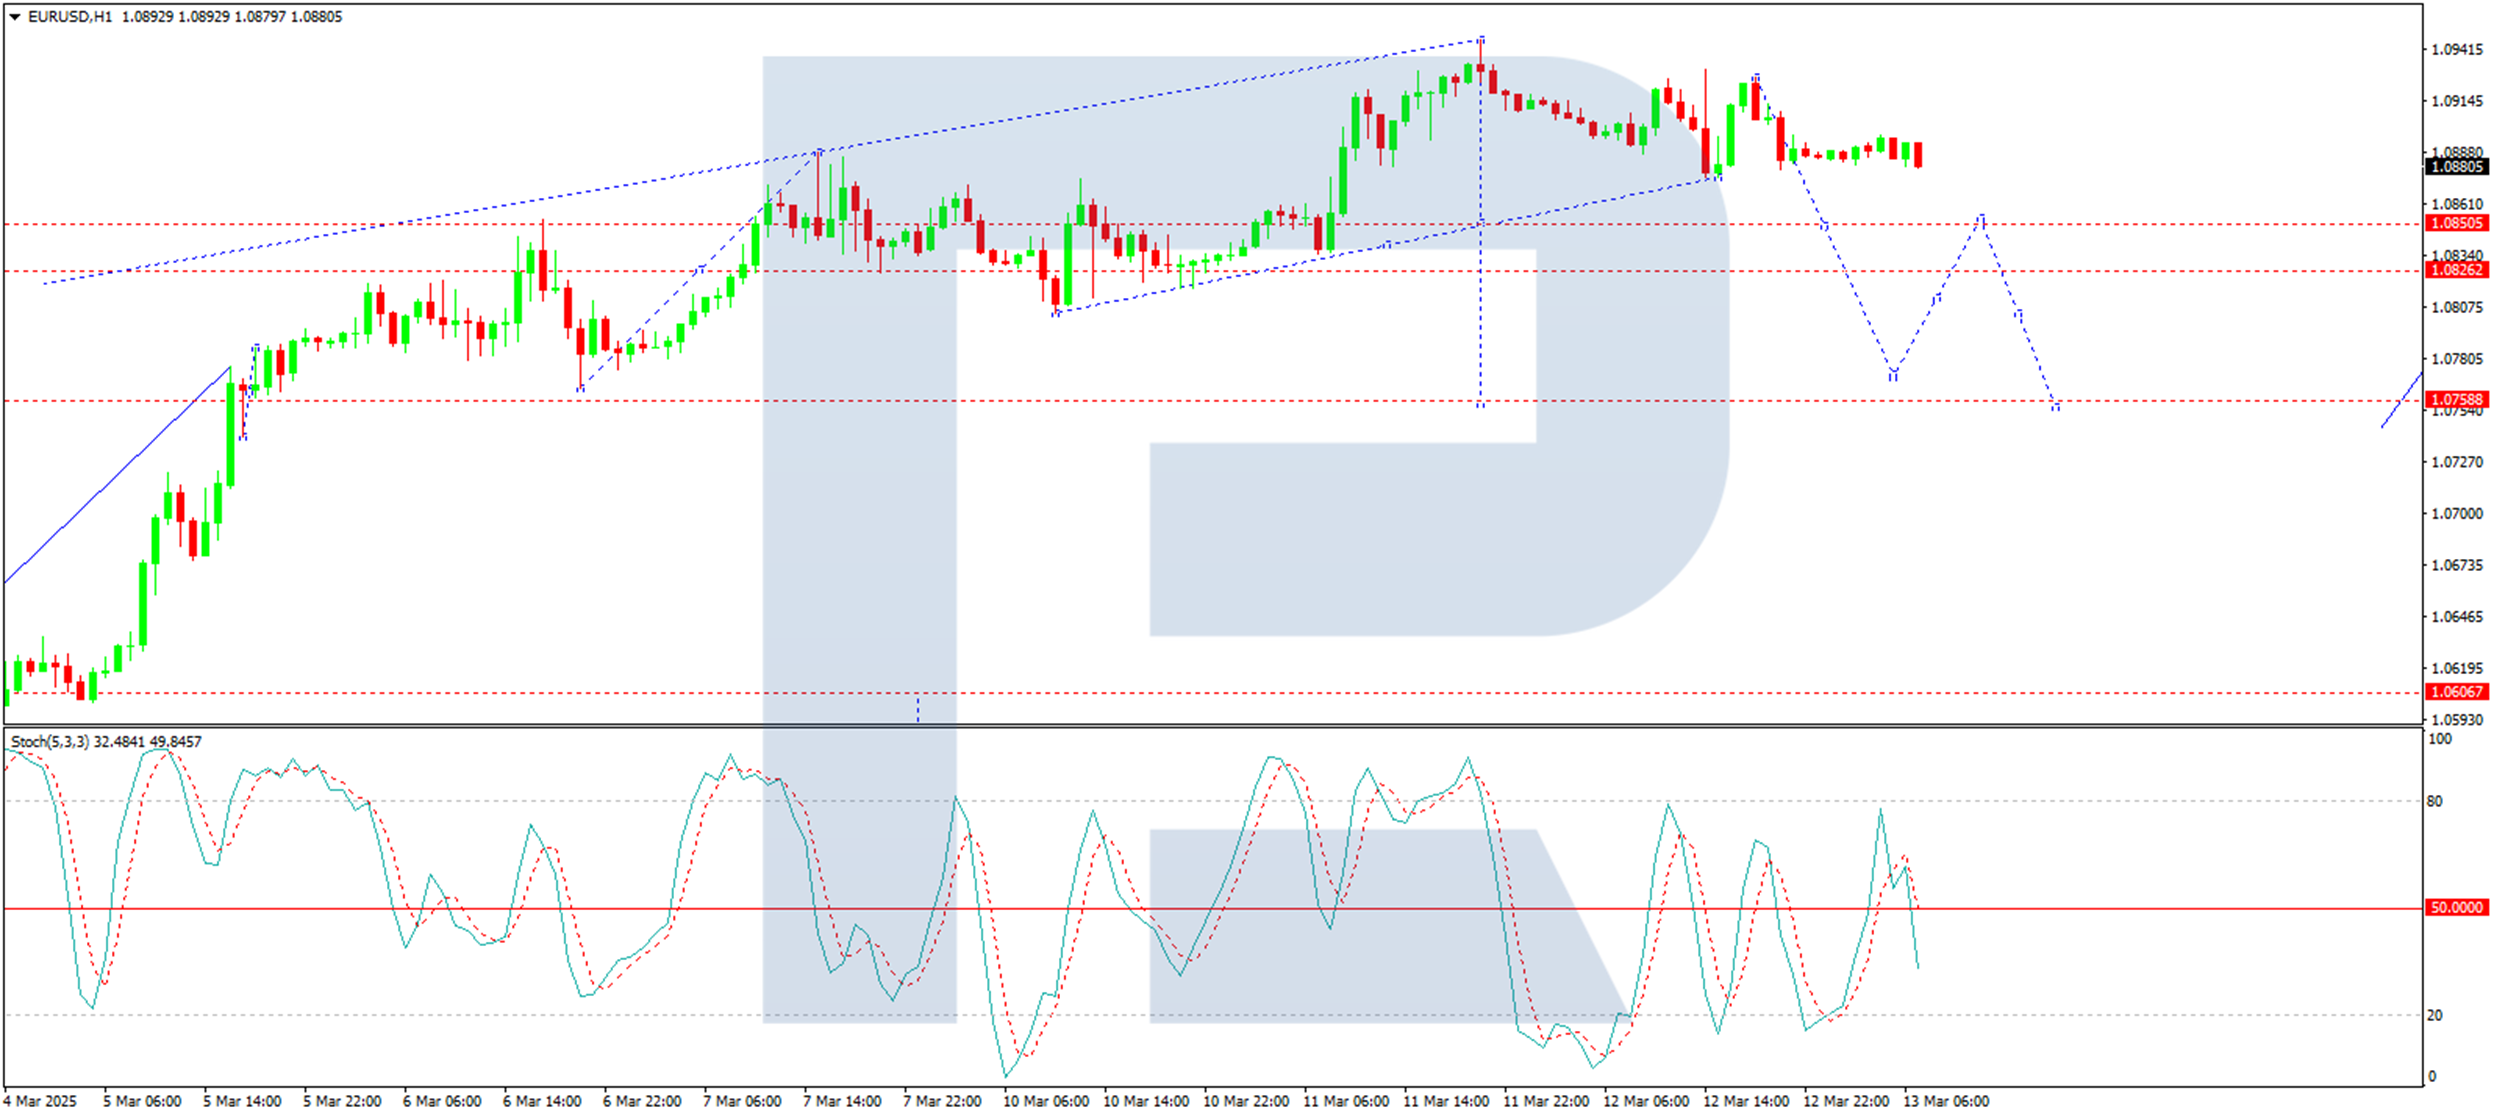
On the H1 chart, the pair is forming a consolidation range around 1.0830, extending up to 1.0944. A decline towards the lower boundary of this range is expected, potentially leading to a breakout and a drop to 1.0750. A subsequent retest of 1.0830 (from below) may follow before a further decline to 1.0533. The Stochastic oscillator reinforces this bearish outlook, with its signal line below the 50 mark and trending downward toward 20.
Conclusion
The EUR/USD pair remains precarious as investors navigate the dual challenges of escalating trade tensions and impending central bank decisions. While technical indicators point to a bearish near-term outlook, market sentiment remains highly sensitive to trade negotiations and macroeconomic data developments. Traders should remain alert to potential volatility and be prepared to adapt their strategies as new information emerges.
Euro and Pound Strengthen to Strategic Levels
The chaos brought by Donald Trump to the US economy, introducing tariffs on China, Canada, and Mexico, has contributed to the strengthening of the euro, pound, and Swiss franc. The situation remained unchanged even after the release of US inflation data yesterday. According to the published figures, the core consumer price index declined more than analysts had forecast (2.8% versus 2.9%). In the long run, this may lead to an earlier Fed rate cut and a continued downward movement in the dollar.
EUR/USD
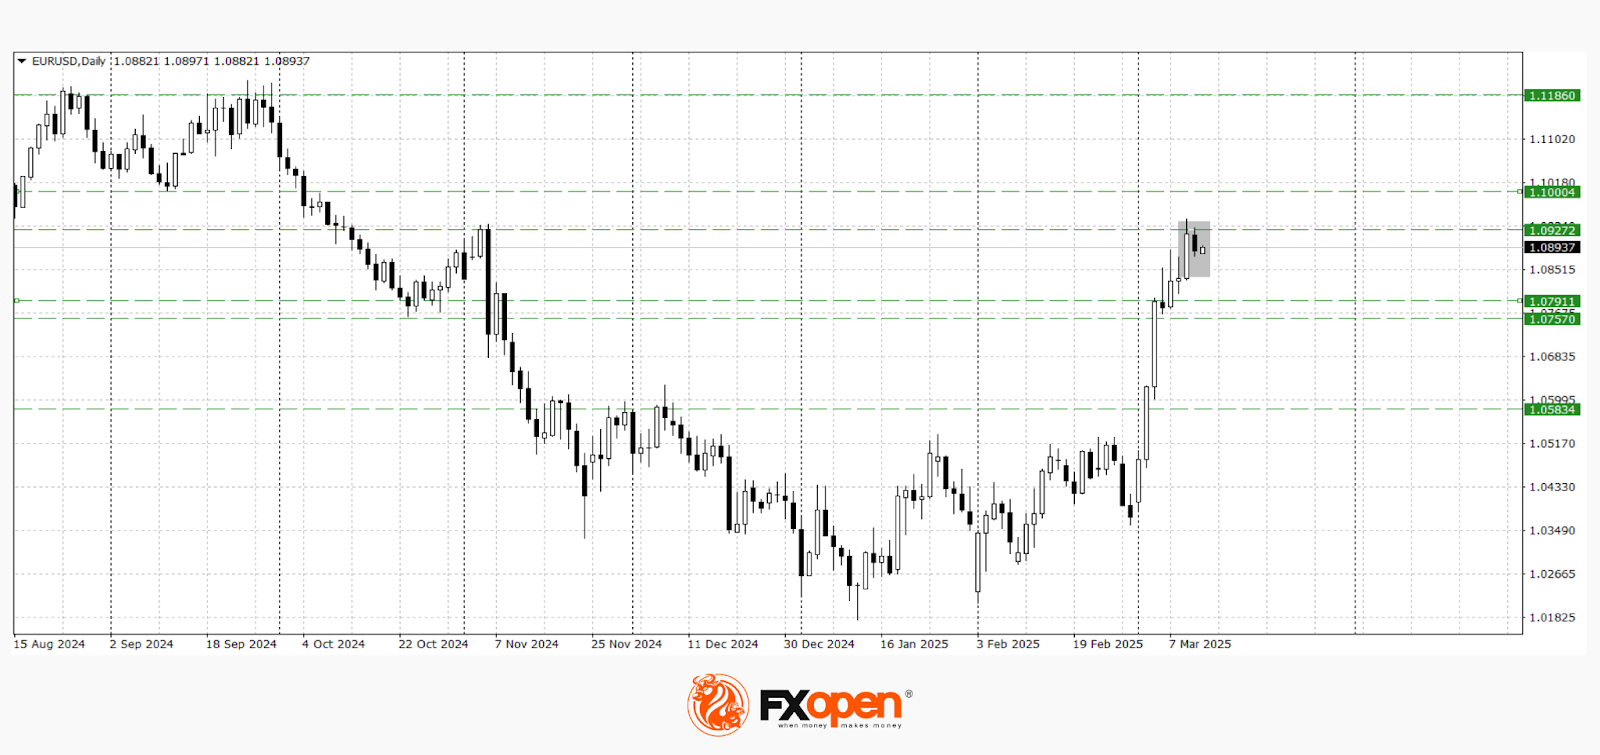
The euro has been strengthening for more than two consecutive weeks and is currently trading near last year’s October highs at 1.0950–1.0920. With the right news impulse, the price may break yesterday’s highs and test the psychological resistance level at 1.1000.
Yesterday, a “bearish harami” pattern formed on the daily timeframe. If confirmed, EUR/USD may start a downward correction towards 1.0830–1.0760.
In the upcoming trading sessions, the following events may influence EUR/USD pricing:
- Today at 12:50 (GMT+2): Speech by European Central Bank Vice President Luis de Guindos.
- Today at 13:00 (GMT+2): Eurozone industrial production data.
- Today at 20:00 (GMT+2): Speech by Burkhard Balz from the Bundesbank.
- Tomorrow at 10:00 (GMT+2): Germany’s Consumer Price Index (CPI).
GBP/USD
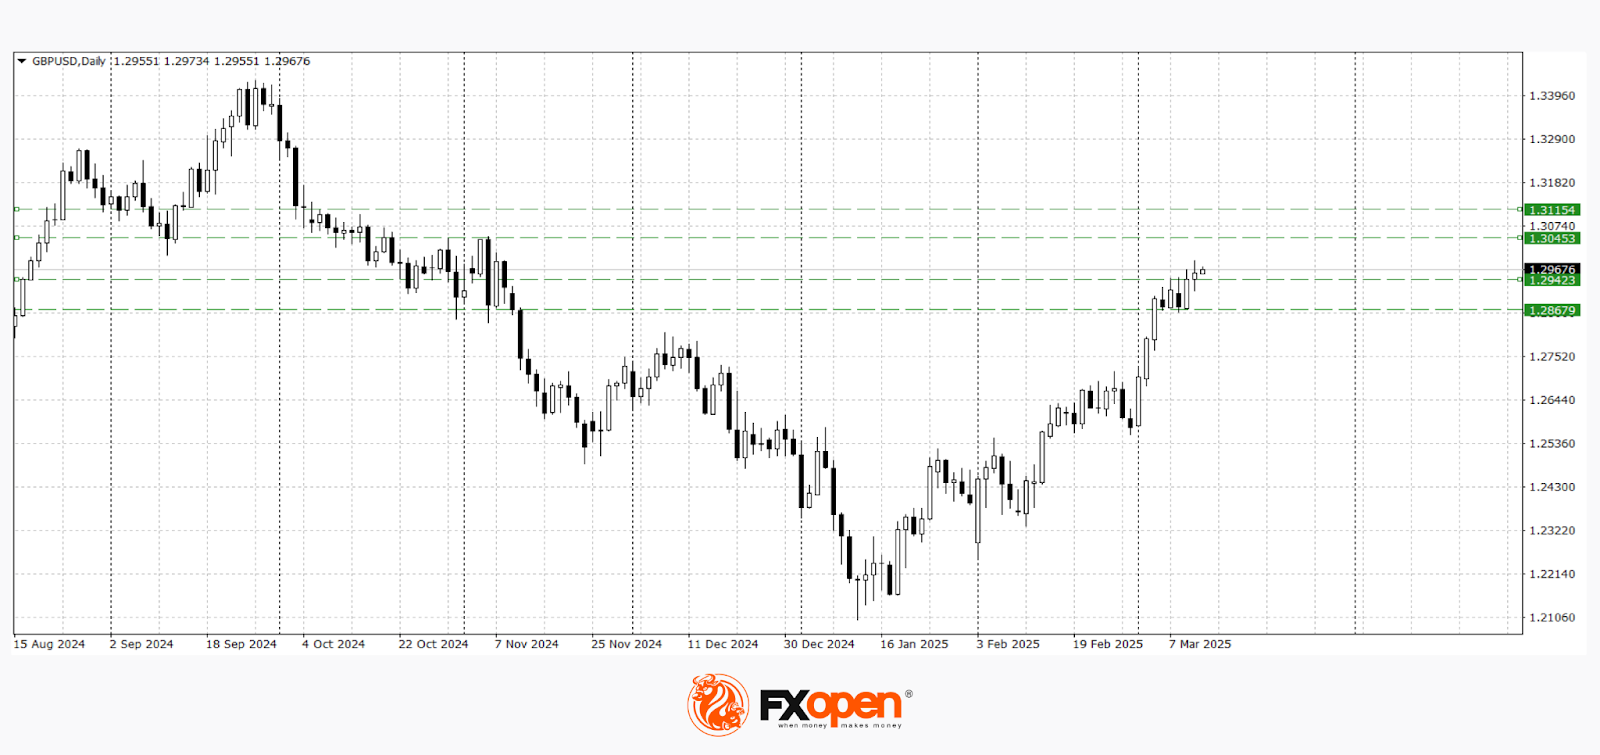
GBP/USD buyers managed to break out of a week-long flat movement between 1.2940–1.2870. The price has consolidated above the upper boundary of this range and may test a key resistance level at 1.3000. If the current levels turn into support, the uptrend may continue towards 1.3120–1.3050. A reversal of the bullish scenario is possible if the price drops below 1.2870.
By the end of the current trading week, the following events may affect GBP/USD pricing:
- Today at 15:30 (GMT+2): US initial jobless claims.
- Today at 15:30 (GMT+2): US Producer Price Index (PPI) (m/m).
- Tomorrow at 10:00 (GMT+2): UK Gross Domestic Product (GDP).
- Tomorrow at 10:00 (GMT+2): UK manufacturing production data.
Trade over 50 forex markets 24 hours a day with FXOpen. Take advantage of low commissions, deep liquidity, and spreads from 0.0 pips. Open your FXOpen account now or learn more about trading forex with FXOpen.
This article represents the opinion of the Companies operating under the FXOpen brand only. It is not to be construed as an offer, solicitation, or recommendation with respect to products and services provided by the Companies operating under the FXOpen brand, nor is it to be considered financial advice.