Sample Category Title
EUR/USD Daily Outlook
Daily Pivots: (S1) 1.0867; (P) 1.0897; (R1) 1.0919; More...
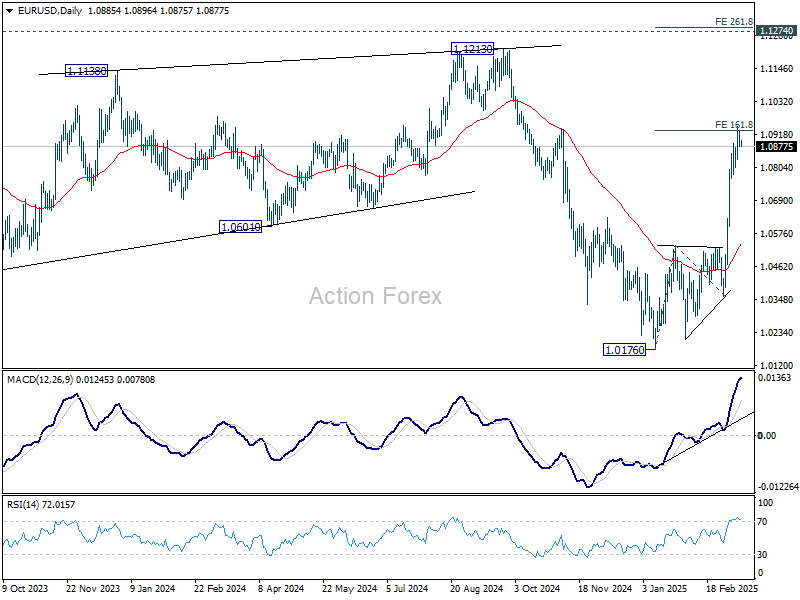
Intraday bias in EUR/USD is turned neutral with current retreat. Some consolidations would be seen first but downside should be contained well above 1.0531 resistance turned support. On the upside sustained trading above 161.8% projection of 1.0176 to 1.0531 from 1.0358 at 1.0932 will target 261.8% projection at 1.1287, which is slightly above 1.1274 key resistance.
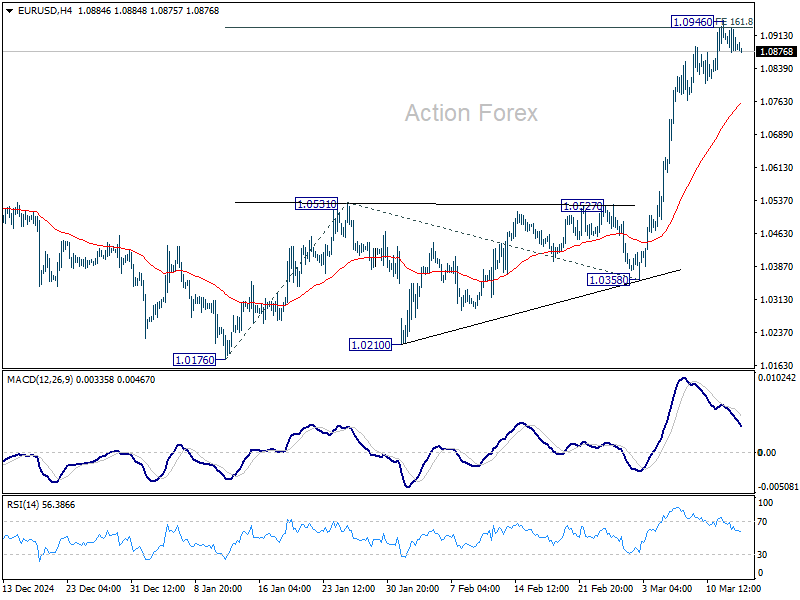
In the bigger picture, the strong break of 55 W EMA (now at 1.0675) suggests that fall from 1.1274 (2024 high) has completed as a three wave correction to 1.0176. Rise from 0.9534 is still intact, and might be ready to resume. Decisive break of 1.1274 will target 100% projection of 0.9534 to 1.1274 from 1.0176 at 1.1916. Also, that will send EUR/USD through a multi-decade channel resistance will carries larger bullish implication. This will now be the favored case as long as 1.0531 resistance turned support holds.
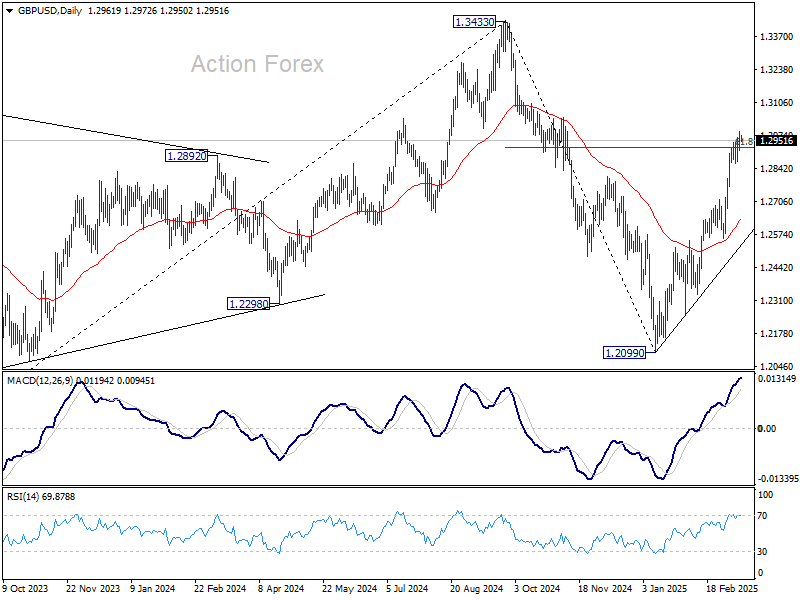
GBP/USD Daily Outlook
Daily Pivots: (S1) 1.2925; (P) 1.2955; (R1) 1.2997; More...
Intraday bias in GBP/USD remains on the upside for the moment. Sustained trading above 61.8% retracement of 1.3433 to 1.2099 at 1.2923 will resume the rise from 1.2099, and pave the way back to 1.3433 high. Nevertheless, break of 1.2860 support should indicate short term topping and bring deeper pullback.
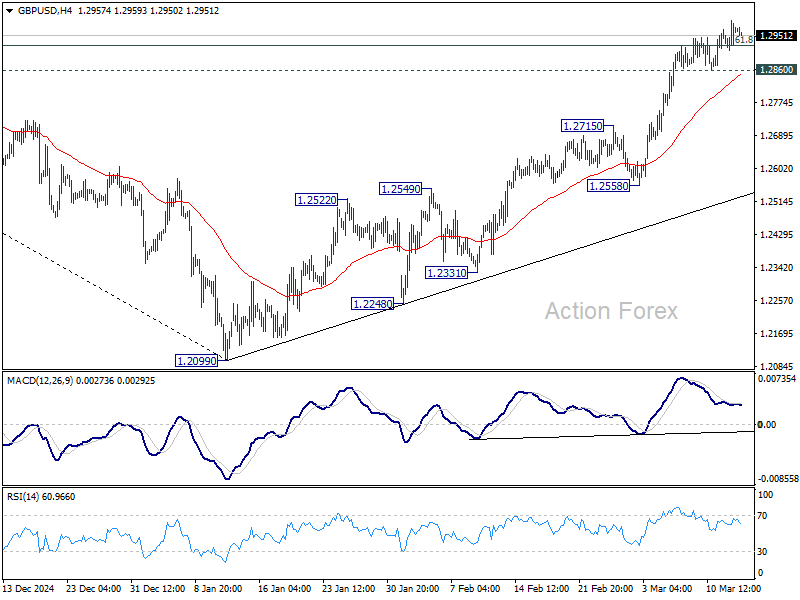
In the bigger picture, fall from 1.3433 (2024 high) should have completed at 1.2099 as a corrective move. Up trend from 1.3051 (2022 low) is still in progress but it's too early to say that it's resuming. Corrective pattern from 1.3433 could extend with one more down leg. But after all, eventual upside breakout is expected at a later stage.
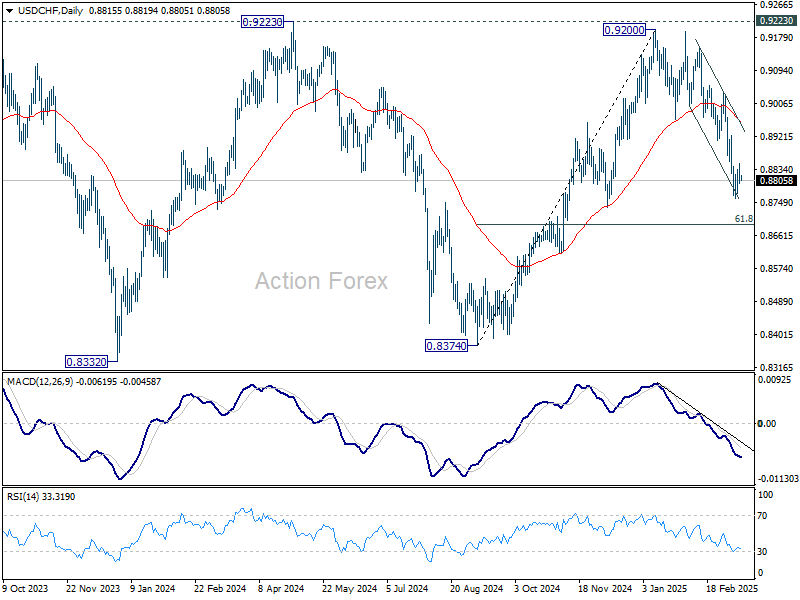
USD/CHF Daily Outlook
Daily Pivots: (S1) 0.8790; (P) 0.8821; (R1) 0.8849; More…
USD/CHF is staying in consolidation from 0.8757 and intraday bias remains neutral. Upside of recovery should be limited by 0.8911 support turned resistance to bring another fall. On the downside, below 0.8757 will resume the fall from 0.9200 and target 61.8% retracement of 0.8374 to 0.9200 at 0.8690. Sustained break there will pave the way back to 0.8374 support.
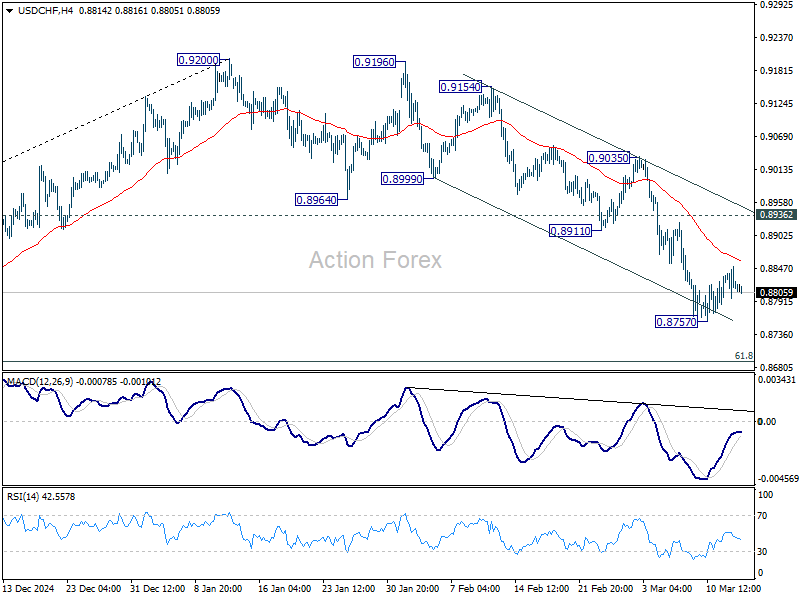
In the bigger picture, rejection by 0.9223 key resistance keep medium term outlook bearish. That is, larger fall from 1.0342 (2017 high) is not completed yet. Firm break of 0.8332 (2023 low) will confirm down trend resumption.
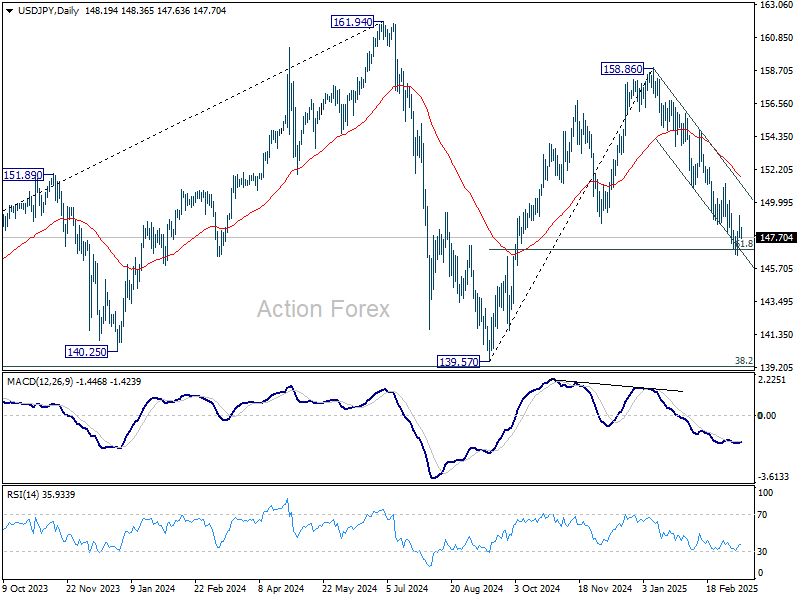
USD/JPY Daily Outlook
Daily Pivots: (S1) 147.51; (P) 148.35; (R1) 149.10; More...
Intraday bias in USD/JPY remains neutral for the moment, and more consolidations could be seen above 146.52. Upside of recovery should be limited by 150.92 support turned resistance. On the downside, sustained trading below 61.8% retracement of 139.57 to 158.86 at 146.32 will pave the way to 139.57 support.
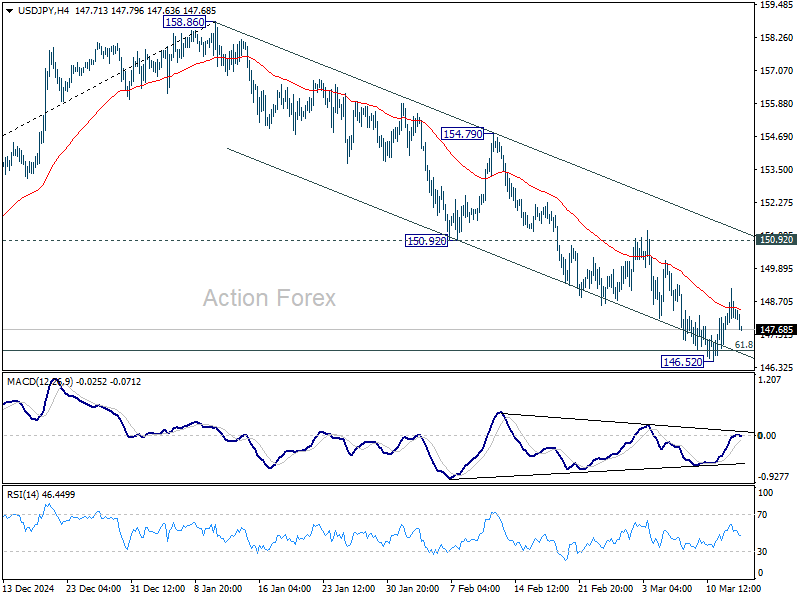
In the bigger picture, price actions from 161.94 are seen as a corrective pattern to rise from 102.58 (2021 low), with fall from 158.86 as the third leg. Strong support should be seen from 38.2% retracement of 102.58 to 161.94 at 139.26 to bring rebound. However, sustained break of 139.26 would open up deeper medium term decline to 61.8% retracement at 125.25.
Forex Steadies Despite Fresh Tariff Escalations, Euro Starting to Retreat
Forex markets are holding steady in Asian session today, with major currency pairs and crosses all confined within yesterday’s ranges. This lack of movement comes despite a significant escalation in the US-led trade war, as newly effective 25% tariffs on all imported steel and aluminum products have prompted swift retaliation from key trading partners.
In swift response, European Commission President Ursula von der Leyen announced that the EU would implement retaliatory tariffs of equal value, totaling USD 28B, on a range of U.S. goods beyond just metals. These measures, set to take effect on April 1, will target products including textiles, home appliances, and agricultural goods. Meanwhile, Canada—the largest supplier of steel and aluminum to the U.S.—is hitting back with USD 20.7B in countermeasures, including a 25% tariff on steel products and increased taxes on US imports ranging from computers and servers to sports equipment and cast-iron products.
The UK has so far taken a more measured stance, with Prime Minister Keir Starmer stating that his government is adopting a "pragmatic approach" while keeping "all options on the table." Australia, on the other hand, has opted against imposing retaliatory tariffs for now. Instead, Prime Minister Anthony Albanese has urged Australians to support local industries in response to Trump’s refusal to grant an exemption for Australian steel and aluminum.
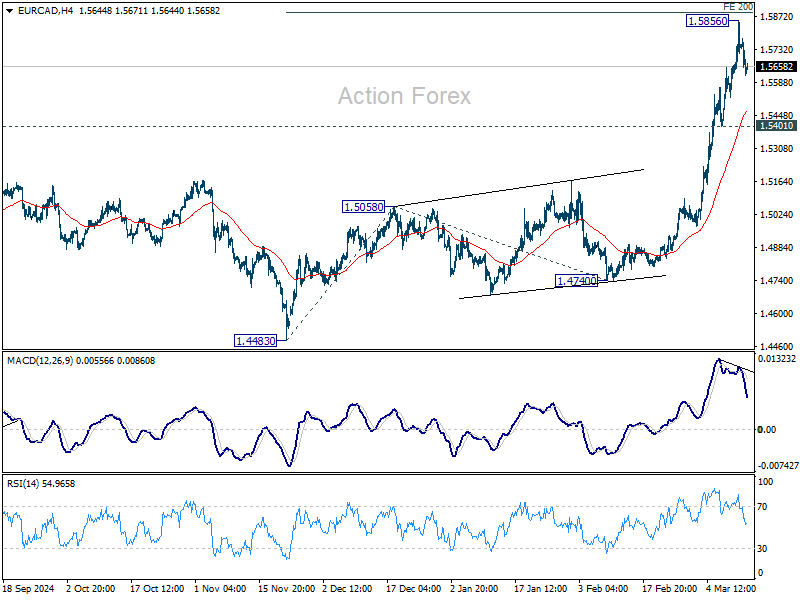
On the currency front, Swiss Franc is so far the weakest performer this week, followed by Loonie and then Dollar. Euro remains the strongest but has begun to pull back in some crosses, with Sterling and Kiwi following. Yen and Aussie are positioned in the middle.
Technically, EUR/CAD could have formed a short term top at 1.5856, ahead of 200% projection of 1.4483 to 1.5058 from 1.4740 at 1.5890. Some consolidations would be seen with risk of deeper retreat to 55 4H EMA (now at 1.5470). But downside should be contained by 1.5401 support to bring rebound, and up trend resumption later.
In Asia, at the time of writing, Nikkei is up 0.09%. Hong Kong HSI is down -1.44%. China Shanghai SSE is down -0.73%. Singapore Strait Times is down -0.03%. Japan 10-year JGB yield is up 0.017 at 1.541. Overnight, DOW fell -0.20%. S&P 500 rose 0.49%. NASDAQ rose 1.22%. 10-year yield rose 0.030 to 4.318.
BoJ’s Ueda expects real wages to rise, boosting consumption
BoJ Governor Kazuo Ueda signaled optimism about Japan’s economic outlook, telling the parliament today that "import-cost-driven inflation" is expected to moderate while wages continue to "rise steadily." This shift could lead to an improvement in real wages and consumption, a critical factor for sustaining domestic demand.
Ueda’s comments align with recent developments in Japan’s annual "shunto" wage negotiations, which have resulted in record pay hikes across major companies.
Hitachi announced a record 6.2% rise in monthly wages, fully meeting union demands. Toyota’s key auto parts supplier, Denso, also committed to historic pay hikes, while Toyota itself stated that the overall wage increase for its manufacturing staff would match last year’s levels—the highest seen since 1999.
Further clarity on the scale of wage hikes will come on March 14, when Rengo, Japan’s largest labor union federation representing 7 million workers, releases its preliminary report. Rengo had been seeking an average wage increase of 6.09%, up from last year’s 5.85%.
US stocks find temporary support, but downside risks persist
Risk sentiment showed signs of stabilization in the US overnight, with S&P 500 and NASDAQ posting gains. However, stocks are merely digesting recent steep losses rather than having a decisive turnaround.
The reaction to lower-than-expected US consumer inflation data was relatively muted. The market's cautious interpretation of the data is justified, as the latest CPI figures do not yet capture the full effects of tariff-related price pressures. There is still a lack clarity on how inflation will evolve under the new tariff regime, particularly when reciprocal tariffs come into play on April 2. Nevertheless, for the moment at least, disinflationary momentum is leaning in the Fed’s favor.
Interestingly, market pricing has shifted the expected timing of Fed’s next rate cut back from May to June. Futures now show just 31% probability of a 25bps cut in May, while the odds for a June cut have climbed to 78%.
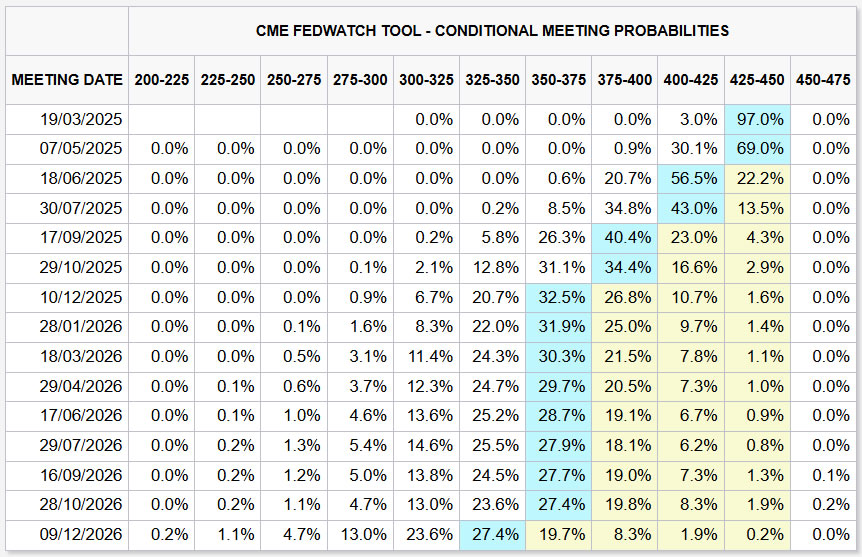
Traders appear to believe Fed will need additional time to assess the economic impact of tariffs before making a policy move. From a timing perspective, June would align better with Fed’s next round of economic projections, allowing policymakers to incorporate more data into their decision-making.
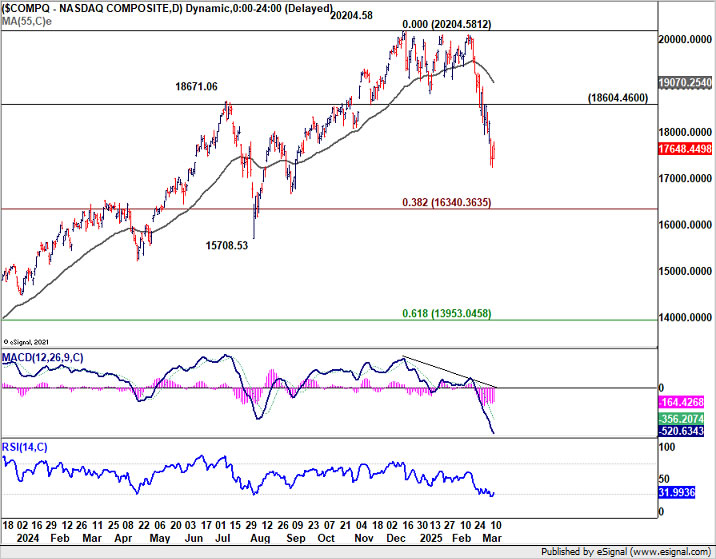
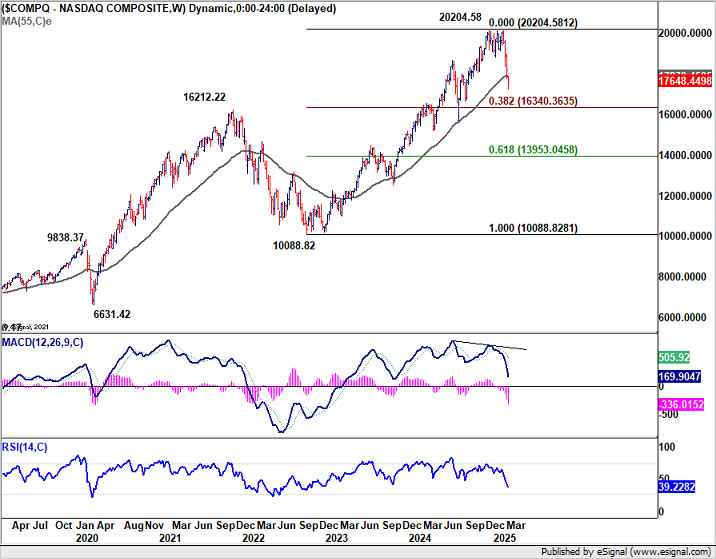
As for NASDAQ, oversold condition as seen in D RSI could start to slow downside momentum, and some near term consolidations cannot be ruled out. But risk will stay on the downside as long as 18604.46 resistance holds. Fall from 20204.58 is seen as a correction to the whole up trend from 10088.82 (2022 low) at least. It should extend to 38.2% retracement of 10088.82 to 20204.58 at 16340.36 before bottoming.
Gold gains as markets await Russia’s response to ceasefire proposal
Gold picked up momentum as investors closely monitor Kremlin’s response to the proposed ceasefire deal in Ukraine, as US officials head to Russia for negotiations.
Russia has yet to publicly endorse an immediate ceasefire, but has indicated that it is reviewing the plan, and a phone call between US President Donald Trump and Russian President Vladimir Putin is on the table.
However, Trump remains skeptical, stating that while he has received “positive messages” about the ceasefire, such reassurances “mean nothing” without concrete action from Putin.
Trump also warned that if Putin refuses to sign the deal, the US could take “financially very bad” actions against Russia, likely hinting at severe sanctions.
Ukrainian President Volodymyr Zelenskyy said earlier in the week that stronger Western financial and military support would follow should the ceasefire negotiations fail.
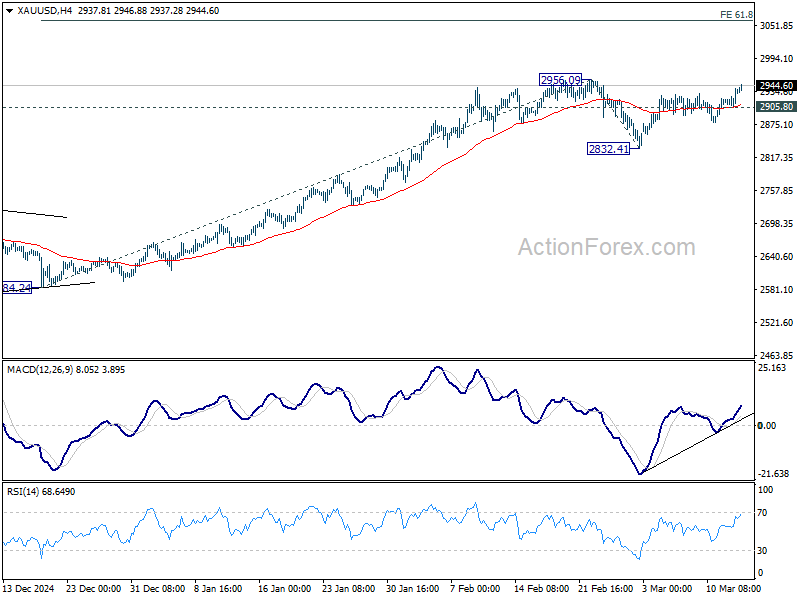
Technically, Gold's near term rebound from 2832.41 extended higher today and focus is now on 2956.09 resistance. Decisive break there will resume the larger up trend to 3000 psychological, and possibly further to 61.8% projection of 2584.24 to 2956.09 from 2832.41 at 3062.21.
However, break of 2905.80 support should extend the corrective pattern from 2956.09 with another falling leg back to 2832.41 and possibly below.
USD/JPY Daily Outlook
Daily Pivots: (S1) 147.51; (P) 148.35; (R1) 149.10; More...
Intraday bias in USD/JPY remains neutral for the moment, and more consolidations could be seen above 146.52. Upside of recovery should be limited by 150.92 support turned resistance. On the downside, sustained trading below 61.8% retracement of 139.57 to 158.86 at 146.32 will pave the way to 139.57 support.
In the bigger picture, price actions from 161.94 are seen as a corrective pattern to rise from 102.58 (2021 low), with fall from 158.86 as the third leg. Strong support should be seen from 38.2% retracement of 102.58 to 161.94 at 139.26 to bring rebound. However, sustained break of 139.26 would open up deeper medium term decline to 61.8% retracement at 125.25.
BoJ’s Ueda expects real wages to rise, boosting consumption
BoJ Governor Kazuo Ueda signaled optimism about Japan’s economic outlook, telling the parliament today that "import-cost-driven inflation" is expected to moderate while wages continue to "rise steadily." This shift could lead to an improvement in real wages and consumption, a critical factor for sustaining domestic demand.
Ueda’s comments align with recent developments in Japan’s annual "shunto" wage negotiations, which have resulted in record pay hikes across major companies.
Hitachi announced a record 6.2% rise in monthly wages, fully meeting union demands. Toyota’s key auto parts supplier, Denso, also committed to historic pay hikes, while Toyota itself stated that the overall wage increase for its manufacturing staff would match last year’s levels—the highest seen since 1999.
Further clarity on the scale of wage hikes will come on March 14, when Rengo, Japan’s largest labor union federation representing 7 million workers, releases its preliminary report. Rengo had been seeking an average wage increase of 6.09%, up from last year’s 5.85%.
Gold gains as markets await Russia’s response to ceasefire proposal
Gold picked up momentum as investors closely monitor Kremlin’s response to the proposed ceasefire deal in Ukraine, as US officials head to Russia for negotiations.
Russia has yet to publicly endorse an immediate ceasefire, but has indicated that it is reviewing the plan, and a phone call between US President Donald Trump and Russian President Vladimir Putin is on the table.
However, Trump remains skeptical, stating that while he has received “positive messages” about the ceasefire, such reassurances “mean nothing” without concrete action from Putin.
Trump also warned that if Putin refuses to sign the deal, the US could take “financially very bad” actions against Russia, likely hinting at severe sanctions.
Ukrainian President Volodymyr Zelenskyy said earlier in the week that stronger Western financial and military support would follow should the ceasefire negotiations fail.
Technically, Gold's near term rebound from 2832.41 extended higher today and focus is now on 2956.09 resistance. Decisive break there will resume the larger up trend to 3000 psychological, and possibly further to 61.8% projection of 2584.24 to 2956.09 from 2832.41 at 3062.21.
However, break of 2905.80 support should extend the corrective pattern from 2956.09 with another falling leg back to 2832.41 and possibly below.
US stocks find temporary support, but downside risks persist
Risk sentiment showed signs of stabilization in the US overnight, with S&P 500 and NASDAQ posting gains. However, stocks are merely digesting recent steep losses rather than having a decisive turnaround.
The reaction to lower-than-expected US consumer inflation data was relatively muted. The market's cautious interpretation of the data is justified, as the latest CPI figures do not yet capture the full effects of tariff-related price pressures. There is still a lack clarity on how inflation will evolve under the new tariff regime, particularly when reciprocal tariffs come into play on April 2. Nevertheless, for the moment at least, disinflationary momentum is leaning in the Fed’s favor.
Interestingly, market pricing has shifted the expected timing of Fed’s next rate cut back from May to June. Futures now show just 31% probability of a 25bps cut in May, while the odds for a June cut have climbed to 78%.
Traders appear to believe Fed will need additional time to assess the economic impact of tariffs before making a policy move. From a timing perspective, June would align better with Fed’s next round of economic projections, allowing policymakers to incorporate more data into their decision-making.
As for NASDAQ, oversold condition as seen in D RSI could start to slow downside momentum, and some near term consolidations cannot be ruled out. But risk will stay on the downside as long as 18604.46 resistance holds. Fall from 20204.58 is seen as a correction to the whole up trend from 10088.82 (2022 low) at least. It should extend to 38.2% retracement of 10088.82 to 20204.58 at 16340.36 before bottoming.
GBP/USD Pushes Higher—Will The Rally Continue?
Key Highlights
- GBP/USD started a decent increase above the 1.2800 resistance zone.
- A key bullish trend line is forming with support at 1.2720 on the 4-hour chart.
- EUR/USD climbed above the 1.0880 resistance zone.
- Bitcoin failed to recover above the $85,000 resistance zone.
GBP/USD Technical Analysis
The British Pound formed a base and started a fresh increase above 1.2800 against the US Dollar. GBP/USD broke the 1.2850 resistance to enter a positive zone.
Looking at the 4-hour chart, the pair settled above the 1.2850 level, the 100 simple moving average (red, 4-hour), and the 200 simple moving average (green, 4-hour). The pair even cleared the 1.2920 resistance zone.
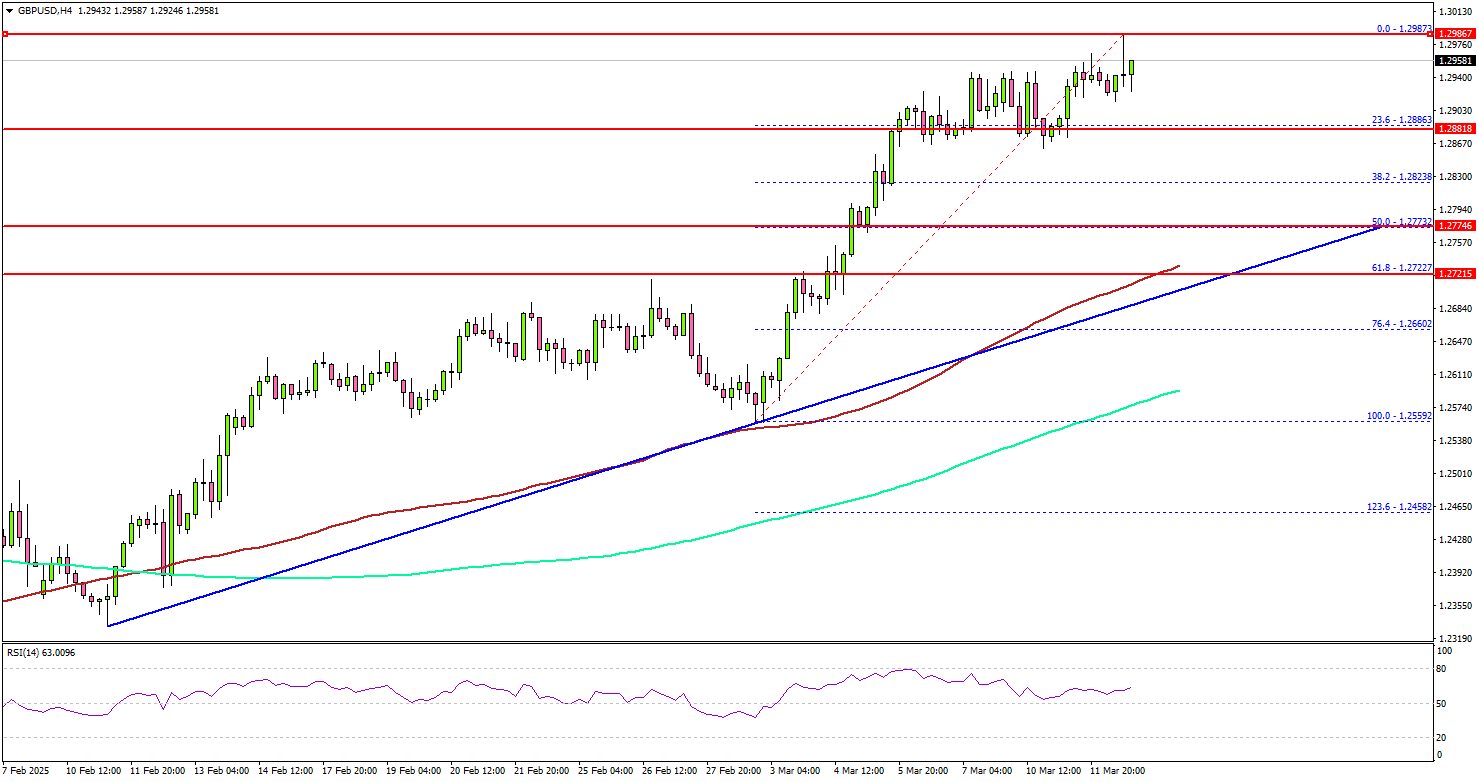
It seems to be aiming for a move above the 1.3000 resistance zone, which is a major hurdle for the bulls. The next major resistance is near the 1.3050 level.
The main resistance is now forming near the 1.3120 zone. A close above the 1.3120 level could set the tone for another increase. In the stated case, the pair could even clear the 1.3200 resistance.
On the downside, immediate support sits near the 1.2880 level. The next key support sits near the 1.2850 level. Any more losses could send the pair toward the 1.2800 level. The main support could be 1.2740. There is also a key bullish trend line forming with support at 1.2720 on the same chart.
Looking at EUR/USD, the pair also started a decent increase and the pair could now aim for a move toward the 1.1000 resistance.
Upcoming Economic Events:
- US Initial Jobless Claims - Forecast 225K, versus 221K previous.
- US Producer Price Index for Feb 2025 (YoY) – Forecast +3.3%, versus +3.5% previous.
March Flashlight for the FOMC Blackout Period: On Hold Through the Policy Fog
Summary
- A moderation in economic activity since the FOMC last met in January is unlikely to shift the Committee out of wait-and-see mode at its upcoming meeting on March 19. We look for the Committee to maintain its target for the fed funds rate at its current range of 4.25%-4.50%.
- Concerns over the growth outlook have intensified in recent weeks amid the swirl of policy uncertainty related to U.S. trade and federal spending. Yet the labor market's cooling has continued to be gradual on trend, while inflation remains frustratingly high. With Chair Powell reiterating ahead of the blackout period that the FOMC does "not need to be in a hurry" to adjust policy, we expect the FOMC will continue to await greater clarity on how policy changes affect its employment and inflation mandates.
- We expect the post-meeting statement to make a nod to the recent moderation in growth and labor market conditions, but to otherwise be little changed. The Committee likely will state that risks to its employment and inflation goals are "roughly in balance." That said, we would not be surprised for Chair Powell to make a dovish comment or two at the press conference that reveal a slight easing bias by acknowledging that the downside risks to the labor market have increased somewhat.
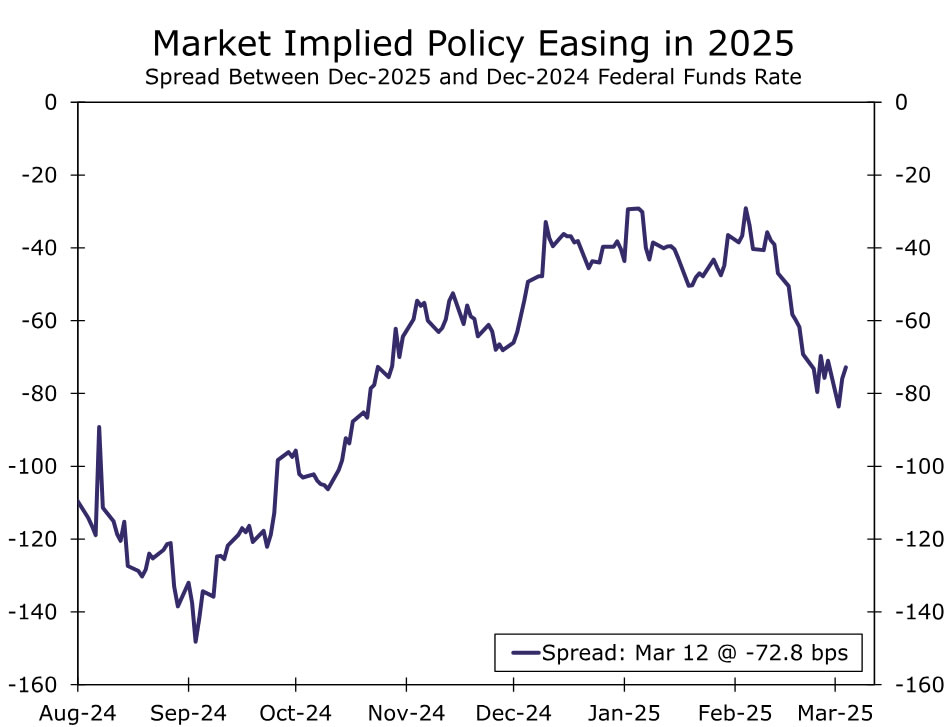
- The updated Summary of Economic Projections likely will show the median participant continues to expect 50 bps of easing this year. With markets currently pricing in 73 bps of cuts by the end of the year, a shift to one cut could further tighten financial conditions. Yet, as inflation remains roughly 50 bps above target and officials are cognizant of keeping inflation expectations anchored, three or more cuts might be too much for the Committee's hawks. If the median dot for 2025 does change, we think it is more likely to signal 75 bps of easing rather than only 25 bps of rate cuts.
- Elsewhere in the SEP, we expect to see a modest downgrade to GDP growth for 2025, with the median estimate dipping a touch below 2.0%. At 4.3%, the median estimate for the unemployment rate at year-end still looks about right, although an increase to 4.4% would not surprise us. Estimates for inflation are likely to edge up further; we look for the median estimate for core PCE inflation at the end of the year to rise from 2.5% to 2.7%.
- The March meeting likely will include a discussion about whether a shift in balance sheet policy is warranted. This marks the next step toward an eventual end to runoff. We do not expect any changes to balance sheet runoff until the May 7 meeting when we expect the Committee to announce the end of quantitative tightening.
On Hold For Now
The economy entered 2025 with solid momentum, prompting the FOMC to leave the fed funds rate unchanged at its January 29 meeting after having cut its target range by 100 bps over the three previous meetings. While the Committee did not update its economic projections, there was little in the statement or press conference to indicate the FOMC was contemplating another rate cut in the near future. Indeed, Chair Powell noted multiple times in the press conference that the FOMC did not need to be in a "hurry" to adjust its policy stance. Rather, the Committee could afford to wait to see how potential policy changes under the new administration affected the Fed's employment and inflation mandates.
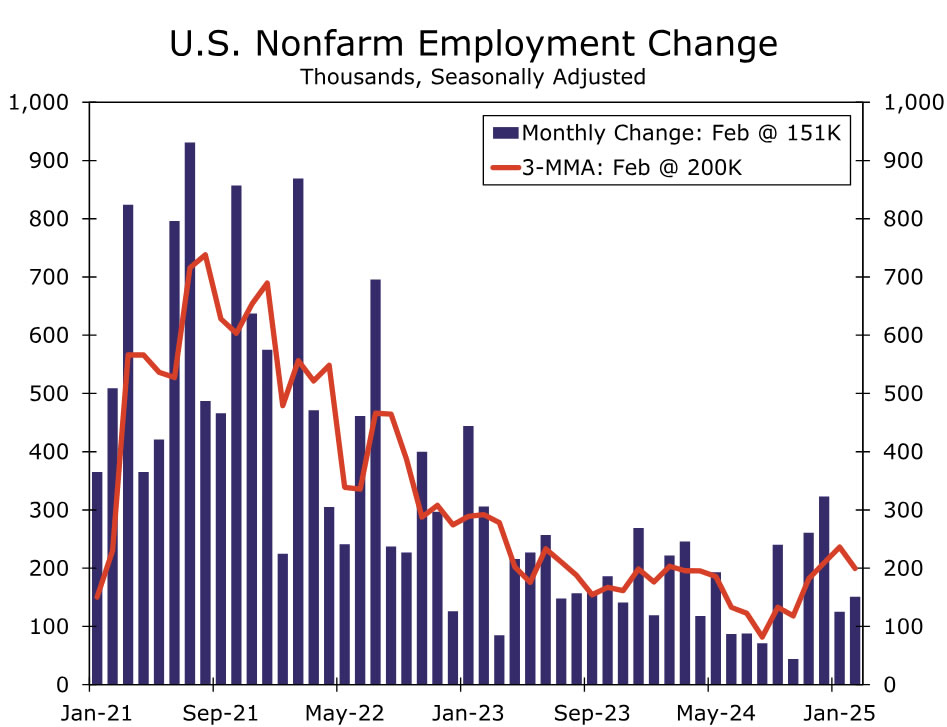
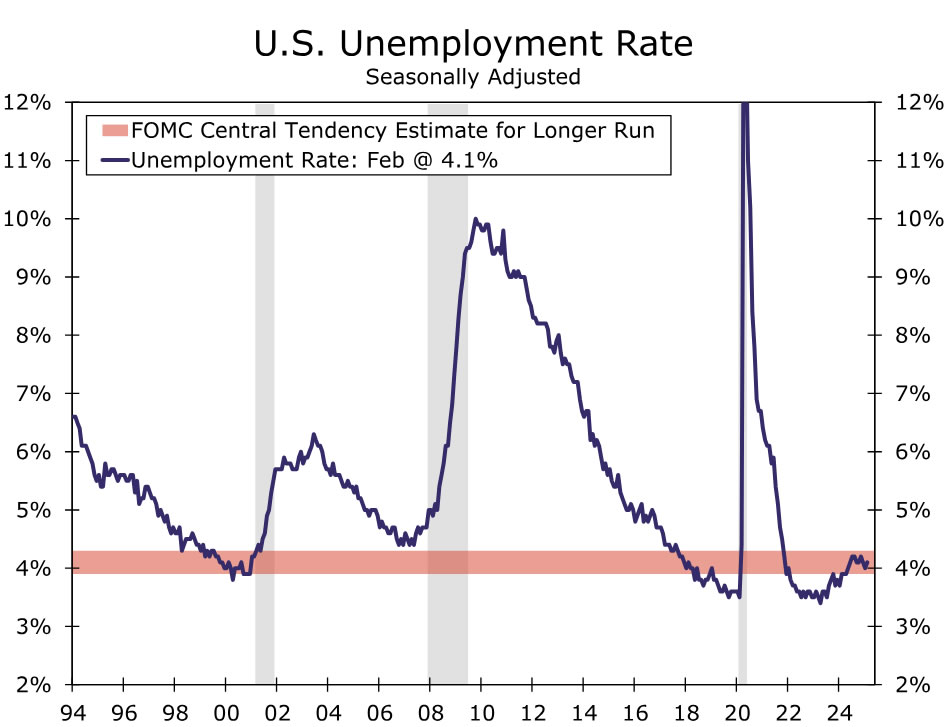
Since then, data have pointed to the economy losing a bit of steam. Monthly growth in nonfarm payrolls averaged 138K in the first two months of the year compared to 209K in the fourth quarter (Figure 1). Further signs of a cooler jobs market were evident in the headline unemployment rate and broader U-6 measure of under-employment moving up in February. Consumer spending also declined in January which, along with a widening trade balance, point to a slowing in Q1 GDP growth.
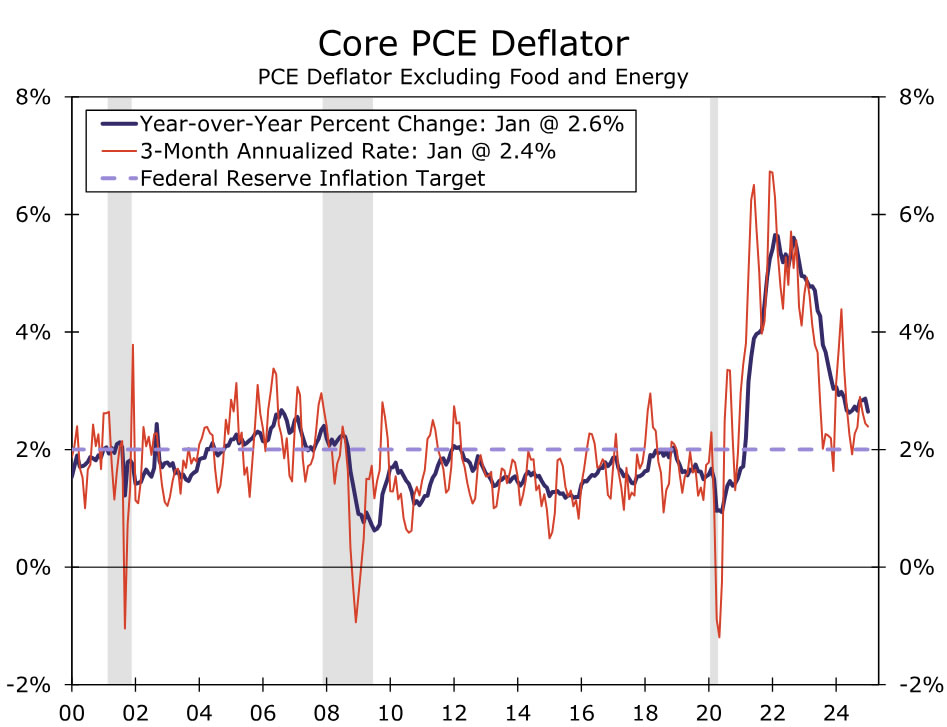
In our view, however, the recent moderation in activity is unlikely to shift the FOMC out of a wait-and-see mode at its upcoming meeting on March 19. The labor market's cooling has continued to be gradual on trend, and the unemployment rate remains comfortably within the FOMC's estimate of full employment (Figure 2). At the same time, inflation remains frustratingly high. Despite easing slightly in February, core CPI inflation is up 3.6% on both a three- and six-month annualized basis. Inflation as measured by the core PCE index looks somewhat closer to the Fed's target, having slowed to a 2.4% annualized pace in the three months through January (Figure 3). Yet, that still leaves it running above the FOMC's target, with the implementation of higher tariffs likely to stymie additional progress in lowering inflation in the months ahead. As a result, we expect the FOMC will keep the fed funds rate unchanged at 4.25%-4.50% at its March meeting. In Chair Powell's last speaking engagement on March 7, he reiterated that the Committee does not need to be in a hurry to react to recent policy changes.
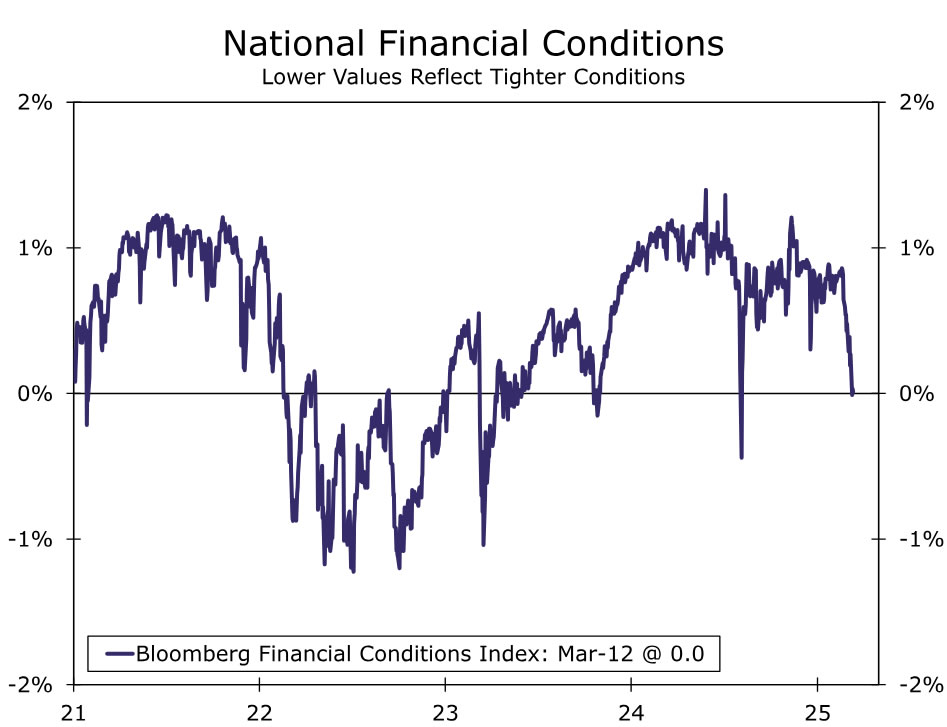
That said, concerns about an economic slowdown have extended beyond the mild softening in recent data as consumers, businesses and market participants grapple with policy uncertainty at levels unseen since the spring of 2020. Trade tensions have ratcheted higher, with an additional 20% tariff levied on Chinese imports and only a partial reprieve on 25% tariffs with Canada and Mexico. Efforts to curtail federal spending have also renewed concerns over the path of hiring ahead. As the growth-dampening effects of higher tariffs and fiscal tightening have come front-and-center, equity markets have neared correction territory and financial conditions have tightened (Figure 4).
We expect the post-meeting statement will nod to the recent moderation in growth and labor market conditions, but otherwise we expect the statement will be little changed. While risks to the employment side of the Fed's mandate have edged up over the inter-meeting period, so too have the risks to inflation. We suspect the statement will thus continue to characterize the risks to the FOMC's mandates as "roughly in balance". That said, we would not be surprised if, when answering reporters' questions in the post-meeting press conference, Chair Powell makes a dovish comment or two that acknowledge downside risks to the labor market and growth have increased in light of the recent policy environment.
SEP: Dots To Be Left Unchanged?
The uncertain and conflicting economic backdrop should make for an interesting Summary of Economic Projections (SEP). The Committee previously updated the SEP in December, and the median projection at that time looked for the fed funds rate to be reduced by 50 bps in 2025, 50 bps in 2026 and 25 bps in 2027 (Figure 5). Our expectation is that these projections will remain largely the same when updated next week. Given concerns about escalating trade tensions and the impact on economic growth, we doubt the Committee will want to send a hawkish message via a 2025 median dot that signals just one or zero cuts. Financial markets are priced for 73 bps of easing this year (Figure 6), so a signal from the FOMC that the base case forecast is one cut likely would lead to a tightening in financial conditions, an outcome we doubt the Committee is seeking.
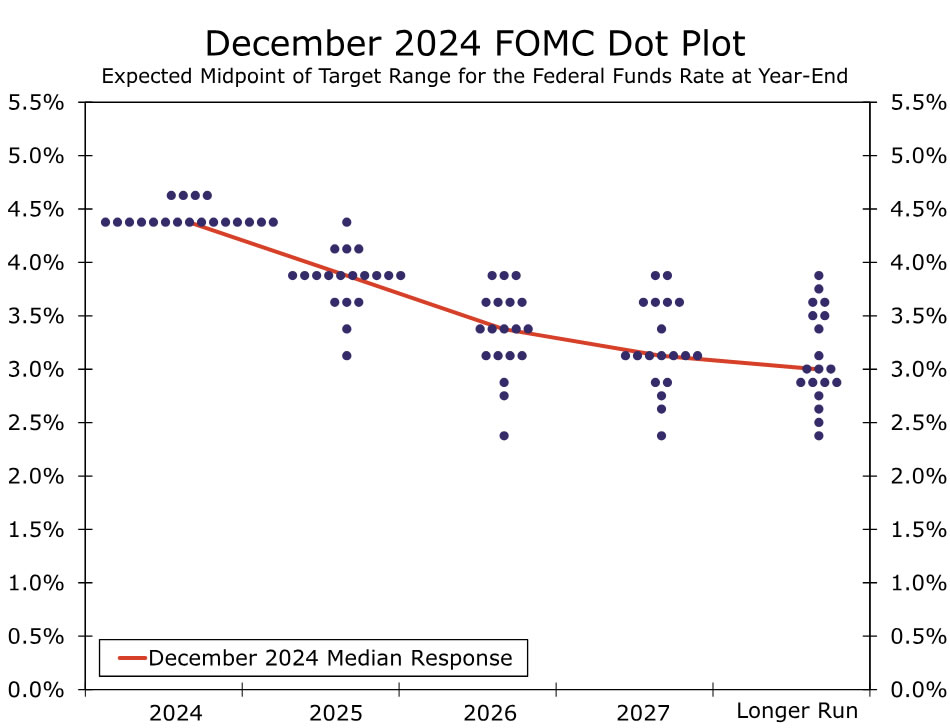
Similarly, we believe the FOMC will be cautious about coming across as overly dovish. Inflation is still roughly 50 bps above the central bank's target, and tariffs threaten to raise spot inflation and inflation expectations. While the FOMC generally seems inclined to "look through" a one-time increase in inflation from higher tariffs, various Committee members have expressed concerns about keeping inflation expectations anchored. A signal that three or more rate cuts are coming this year might worry the hawks who are concerned about the inflation outlook. Although individual dots may shift a little, we think that, on net, no change in the median dots is the most probable outcome. If the median dot for 2025 does change, we think it is more likely to signal 75 bps of easing than only 25 bps of rate cuts.
Elsewhere in the SEP, we expect to see a modest downgrade to economic projections for 2025. The median December projection looked for 2.1% real GDP growth in 2025. But, the initial tracking data suggest Q1 economic growth will be weak, while tariffs threaten the outlook for later in the year. We do not expect a major decline in the projections, but a dip below 2.0% seems to be in store. The previous projection for the unemployment rate was 4.3% each year from 2025-2027. This still looks about right for 2025, although it may rise by one-tenth of a percentage point to maintain consistency with the changes in real GDP growth.
We also expect the FOMC will revise upwardly its inflation projections. The current median projection for the core PCE deflator in 2025 is 2.5%. Changes to tariff rates since December probably argue for a slightly higher figure. Our own forecast for the core PCE deflator is 2.7%, and we expect the median Committee projection will be near this figure in next week's SEP.
The End of QT Is Coming into View
The FOMC is getting closer to making a change to the Fed's balance sheet runoff program, more commonly known as quantitative tightening (QT). QT has been ongoing since June 2022, when the Federal Reserve began reducing its holdings of Treasury securities and mortgage-backed securities (MBS) by up to $60 billion and $35 billion per month, respectively. These caps remained in place until June 2024, at which time the Committee reduced the monthly cap for Treasury securities to $25 billion in an effort to slow, but not stop, the pace of balance sheet runoff. Those monthly caps remain in place today.
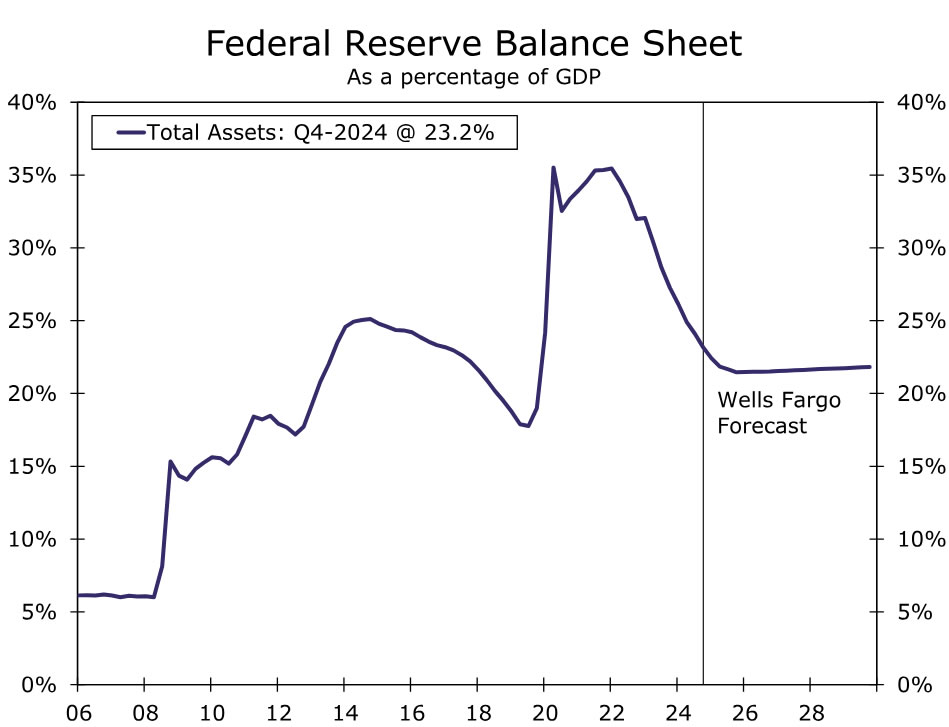
At present, the Federal Reserve's security holdings total $6.4 trillion, a $2 trillion decline from the central bank's peak holdings in 2022. The Federal Reserve's balance sheet has fallen even more as a share of GDP, declining from 35% at the peak to 23% today (Figure 7). This passive balance sheet runoff has been a secondary form of monetary policy tightening and likely has contributed to some modest upward pressure on longer-term interest rates, perhaps on the order of 20-40 bps or so.
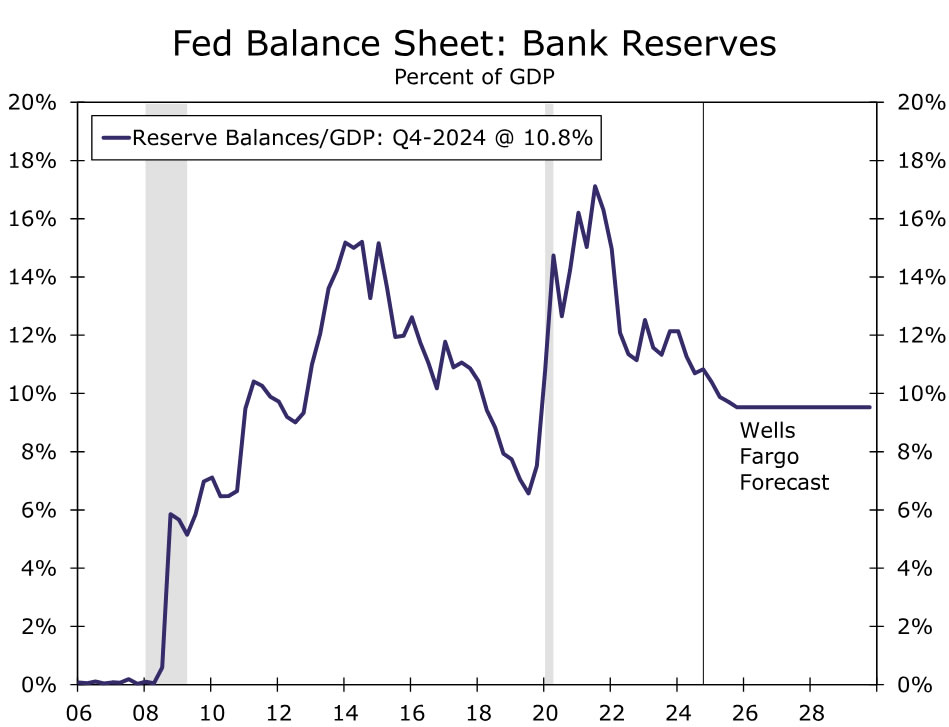
The upshot of the reduction in the Fed's security holdings has been a reduction of the abundant liquidity in the financial system. Banks' holdings of reserves at the Fed have declined considerably from their peak both in dollar terms and as a share of GDP (Figure 8). The Federal Reserve aims to maintain reserves that are "ample" enough such that the financial system operates smoothly but not so ample that the central bank's balance sheet is larger than is necessary.
Identifying that Goldilocks zone of not-too-big and not-too-small is no easy task, and it has been made harder recently by the debt ceiling. The federal government's borrowing capacity is currently constrained by the debt ceiling, which has been binding since it was reinstated at the start of the year. Because of the debt ceiling, the federal government has been financing itself less with new debt and more with its cash on hand (Figure 9). A reduction in the cash balance that the Treasury Department holds at the central bank (a liability on the Fed's balance sheet) generally corresponds to an increase in bank reserves (another liability on the Fed's balance sheet), all else equal.
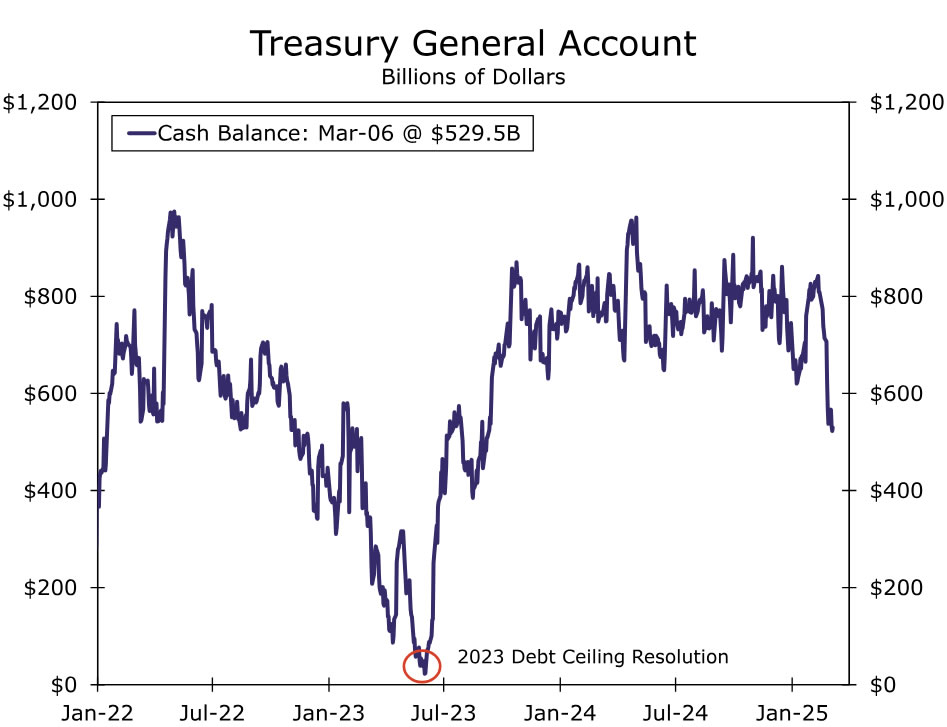
Of course, once the debt ceiling is eventually lifted, the process will swing into reverse. The Treasury will issue new debt rapidly to rebuild the TGA, and this will reduce bank reserves sharply in a short period of time. These volatile swings in bank reserves make it even more difficult to get a read on how close the Federal Reserve is to the Goldilocks zone. The minutes from the January FOMC meeting signaled that "various participants" noted that it may be appropriate to consider pausing or slowing balance sheet runoff until the debt ceiling has been resolved.
Thus, we expect the March meeting to be a "live" meeting when it comes to the balance sheet, meaning we expect Committee members to actively debate whether a policy shift is warranted. Our expectation is that the Committee will maintain the current pace of QT for one more meeting and then announce the end of balance sheet runoff at the May 7 meeting. Starting June 1, we expect the Federal Reserve to keep its balance sheet flat through at least the end of the year.
Note that even if aggregate balance sheet runoff ceases, that does not mean that balance sheet policy has shifted to neutral. If the Fed's balance sheet is held flat for an extended period of time, then it will still be shrinking as a share of GDP. Furthermore, the composition of the balance sheet can continue to evolve such that policy accommodation is still being removed. We look for MBS runoff to continue past June indefinitely as the Federal Reserve strives to reduce its mortgage holdings and slowly return to holding primarily Treasury securities. In order to keep the total balance sheet unchanged amid ongoing MBS runoff, we look for the Federal Reserve to start buying Treasury securities such that they replace MBS paydowns one-for-one. Returning to a primarily Treasury security portfolio would reduce the support that the central bank lends to the mortgage market.
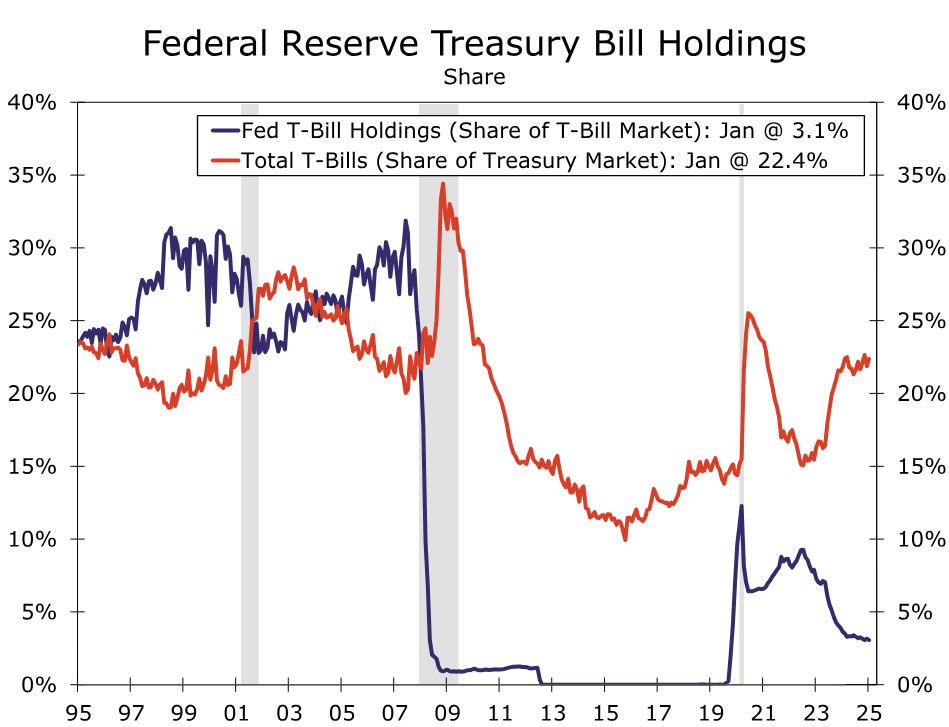
Another factor to consider is the weighted-average maturity of the central bank's Treasury security holdings. At present, the Federal Reserve's security holdings generally skew longer-dated than the overall market. For example, the Federal Reserve currently holds just 3% of T-bills outstanding despite T-bills accounting for roughly 22% of the overall Treasury market (Figure 10). Slowly replacing MBS with shorter-dated Treasury securities, such as Treasury bills, would re-weight the Fed's balance sheet away from longer-dated securities and toward shorter-dated securities, putting some very modest upward pressure on longer-term yields, all else equal. Over time, if the Federal Reserve's Treasury security portfolio broadly reflects the overall market, the central bank's balance sheet should exert a more market neutral impact on yields. The end of QT may be coming soon, but the balance sheet's role as the secondary policy tool will continue for the foreseeable future.