Sample Category Title
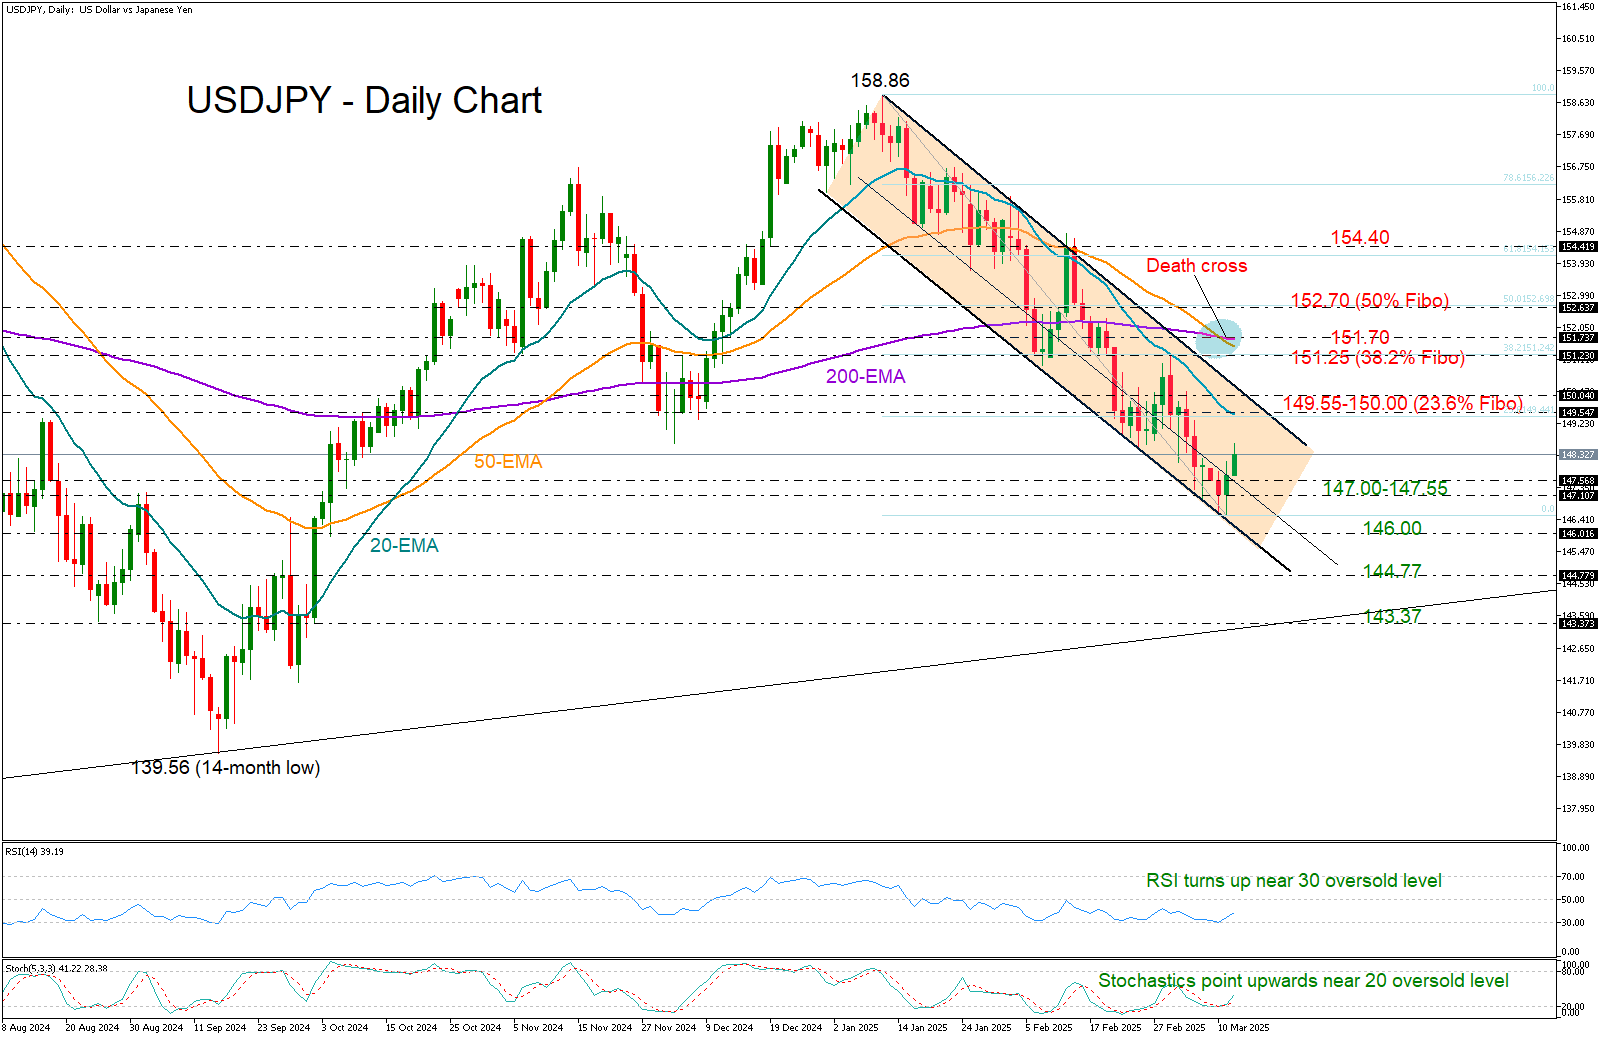
USD/JPY Hopes for Some Recovery
- USDJPY aims for a rebound after hitting five-month low.
- Recovery could be short-lived within the bearish channel.
- US CPI inflation data due at 12:30 GMT.
USDJPY kicked off Wednesday’s session on a strong positive note ahead of the much-awaited US CPI inflation figures, building on its rebound from a five-month low of 146.52 to a weekly high of 148.59.
There is hope for further gains as both the RSI and stochastic oscillator are pivoting from oversold levels, signaling that recent selling pressures may have been excessive.
However, the pair remains trapped within a bearish channel, suggesting that any bullish attempts might be short-lived and limited below the 149.55-150.00 resistance zone. The bearish outlook is further reinforced by the death cross created between the 50- and 200-day exponential moving averages (EMAs), limiting the potential for a trend reversal.
If the rally manages to break above the 150.00 level, the next key resistance could emerge within the 151.25-151.70 zone, where the 23.6% Fibonacci retracement of the 2025 downfall and the 50- and 200-day EMAs are currently positioned. A sustained push higher could pave the way for a test of 152.70, aligning with the 50% Fibonacci mark, followed by a potential surge toward the 154.40 ceiling.
In the event the bears retake control, the focus could shift back to the 147.00-147.55 support region. A deeper decline may challenge the lower boundary of the bearish channel near 146.00, with further losses likely targeting the constraining zone of 144.77.
Overall, while USDJPY is showing signs of a bullish revival, this recovery may still be a temporary correction within the broader 2025 downtrend.
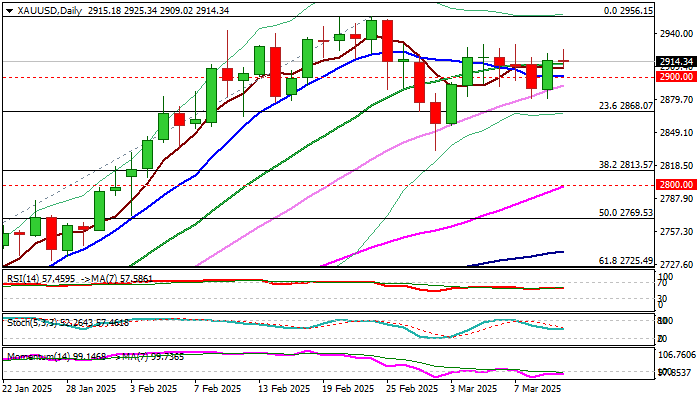
XAU/USD: Gold Remains Constructive, Eyes US CPI Data/Tariffs for Fresh Signals
Gold price is held in a narrow range on Wednesday morning and pressuring near-term congestion ceiling ($2930).
Near term bias is expected to remain with bulls while the action stays above psychological $2900 level, although daily indicators are mixed (negative momentum / MA’s in bullish setup).
Markets await release of US Feb inflation report (2.9% f/c vs 3.0% in Jan) for more signals to the central bank about the stance on monetary policy.
Another key factor that could strongly influence metal’s performance are US tariff policies, which were extended by the latest decision to impose 25% tariff on all imports of steel and aluminium to the US.
Escalation of trade war would further undermine global economy and negatively impact economic growth, as many developed economies struggle to speed up recovery or being in recession.
Economists also point out the growing risk of stronger slowdown of the US economy which would add to already fragile global economic situation, with heated geopolitical situation contributing to overall supportive environment for gold.
Initial support at $2900 is reinforced by 10DMA, followed by a higher base at $2880 and Fibo level at $2868 (23.6% of $2582/$$2956 upleg).
Res: 2930; 2942; 2956; 2985.
Sup: 2908; 2900; 2891; 2880.
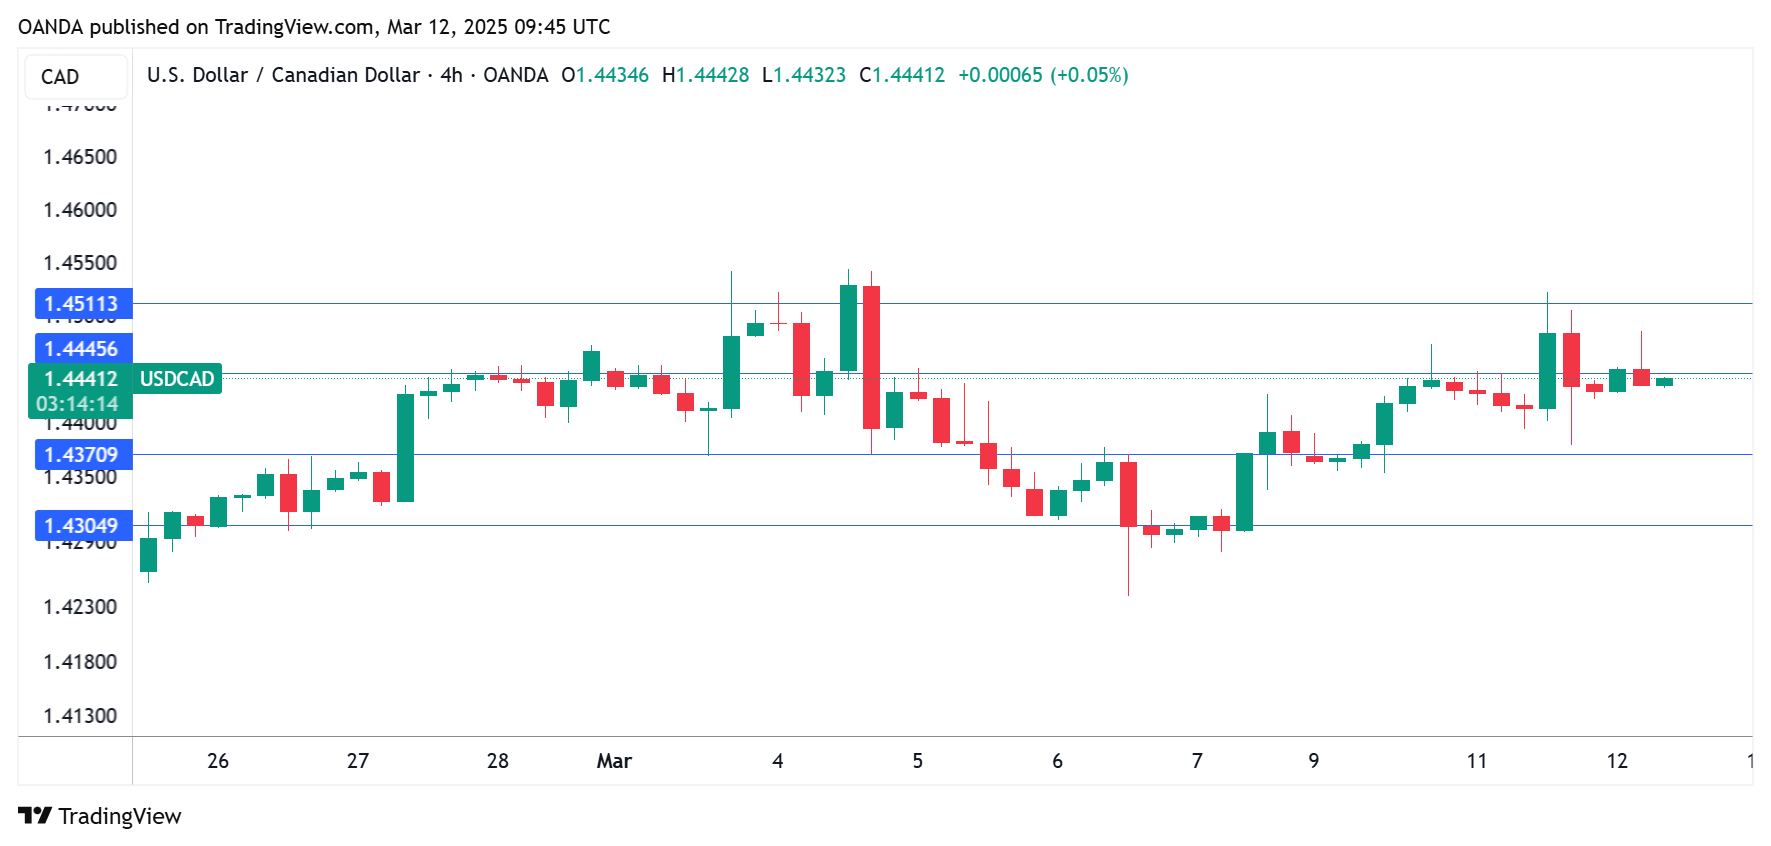
Canadian Dollar Calm ahead of BoC, US Inflation
The Canadian dollar posted gains earlier but couldn’t consolidate. In the European session, USD/CAD is trading at 1.4439, up 0.03% on the day.
Bank of Canada likely to cut by 25 bps
It’s decision day at the Bank of Canada, which is widely expected to lower rates by 25 basis points. This would lower the cash rate to 2.75%, its lowest level since July 2022. The BoC has been aggressive and has lowered rates at five straight meetings, chopping 200 basis points during that time.
The economy remains weak despite the sharp drop in interest rates and the central bank plans to continue lowering rates in order to boost economic growth. The BoC finds itself in a difficult position as far as rate policy. The labor market is showing weakness, with almost no job growth in February, while at the same time inflation remains sticky, above the BoC’s 2% target. Throw into the mix the Trump administration’s tariffs on Canada, and the situation has become fluid. The specter of a long trade war between Canada and the US would be disastrous for Canada and has complicated matters for the BoC.
US inflation expected to tick lower
In the US, inflation has been contained but remains above the Federal Reserve’s target of 2%. Headline CPI for February is expected to ease to 0.3% m/m, down from 0.5% in January, and down to 2.9% y/y from 3.0%. The core rate is projected to drop to 0.3% m/m from 0.4% and to 3.2% from 3.3%.
If the CPI estimates prove to be on target, it would point to little movement in inflation and investors may feel relieved that Trump’s tariffs policies have not yet raised inflation. The Federal Reserve is widely expected to hold rates at next week’s meeting but it’s unclear what happens after that, with the chances of a May cut at around 50/50.
USD/CAD Technical
- USD/CAD is testing resistance at 1.4445. Above, there is resistance at 1.4511
- 1.4370 and 1.4304 are the next support levels
Crypto Bounces Back from Extreme Fear
Market picture
The cryptocurrency market bounced 2% in the last 24 hours to $2.67 trillion. So far, the situation looks like a small rebound after the collapse. We should not talk about the beginning of recovery as long as the market is below its 200-day moving average of $2.83 trillion.
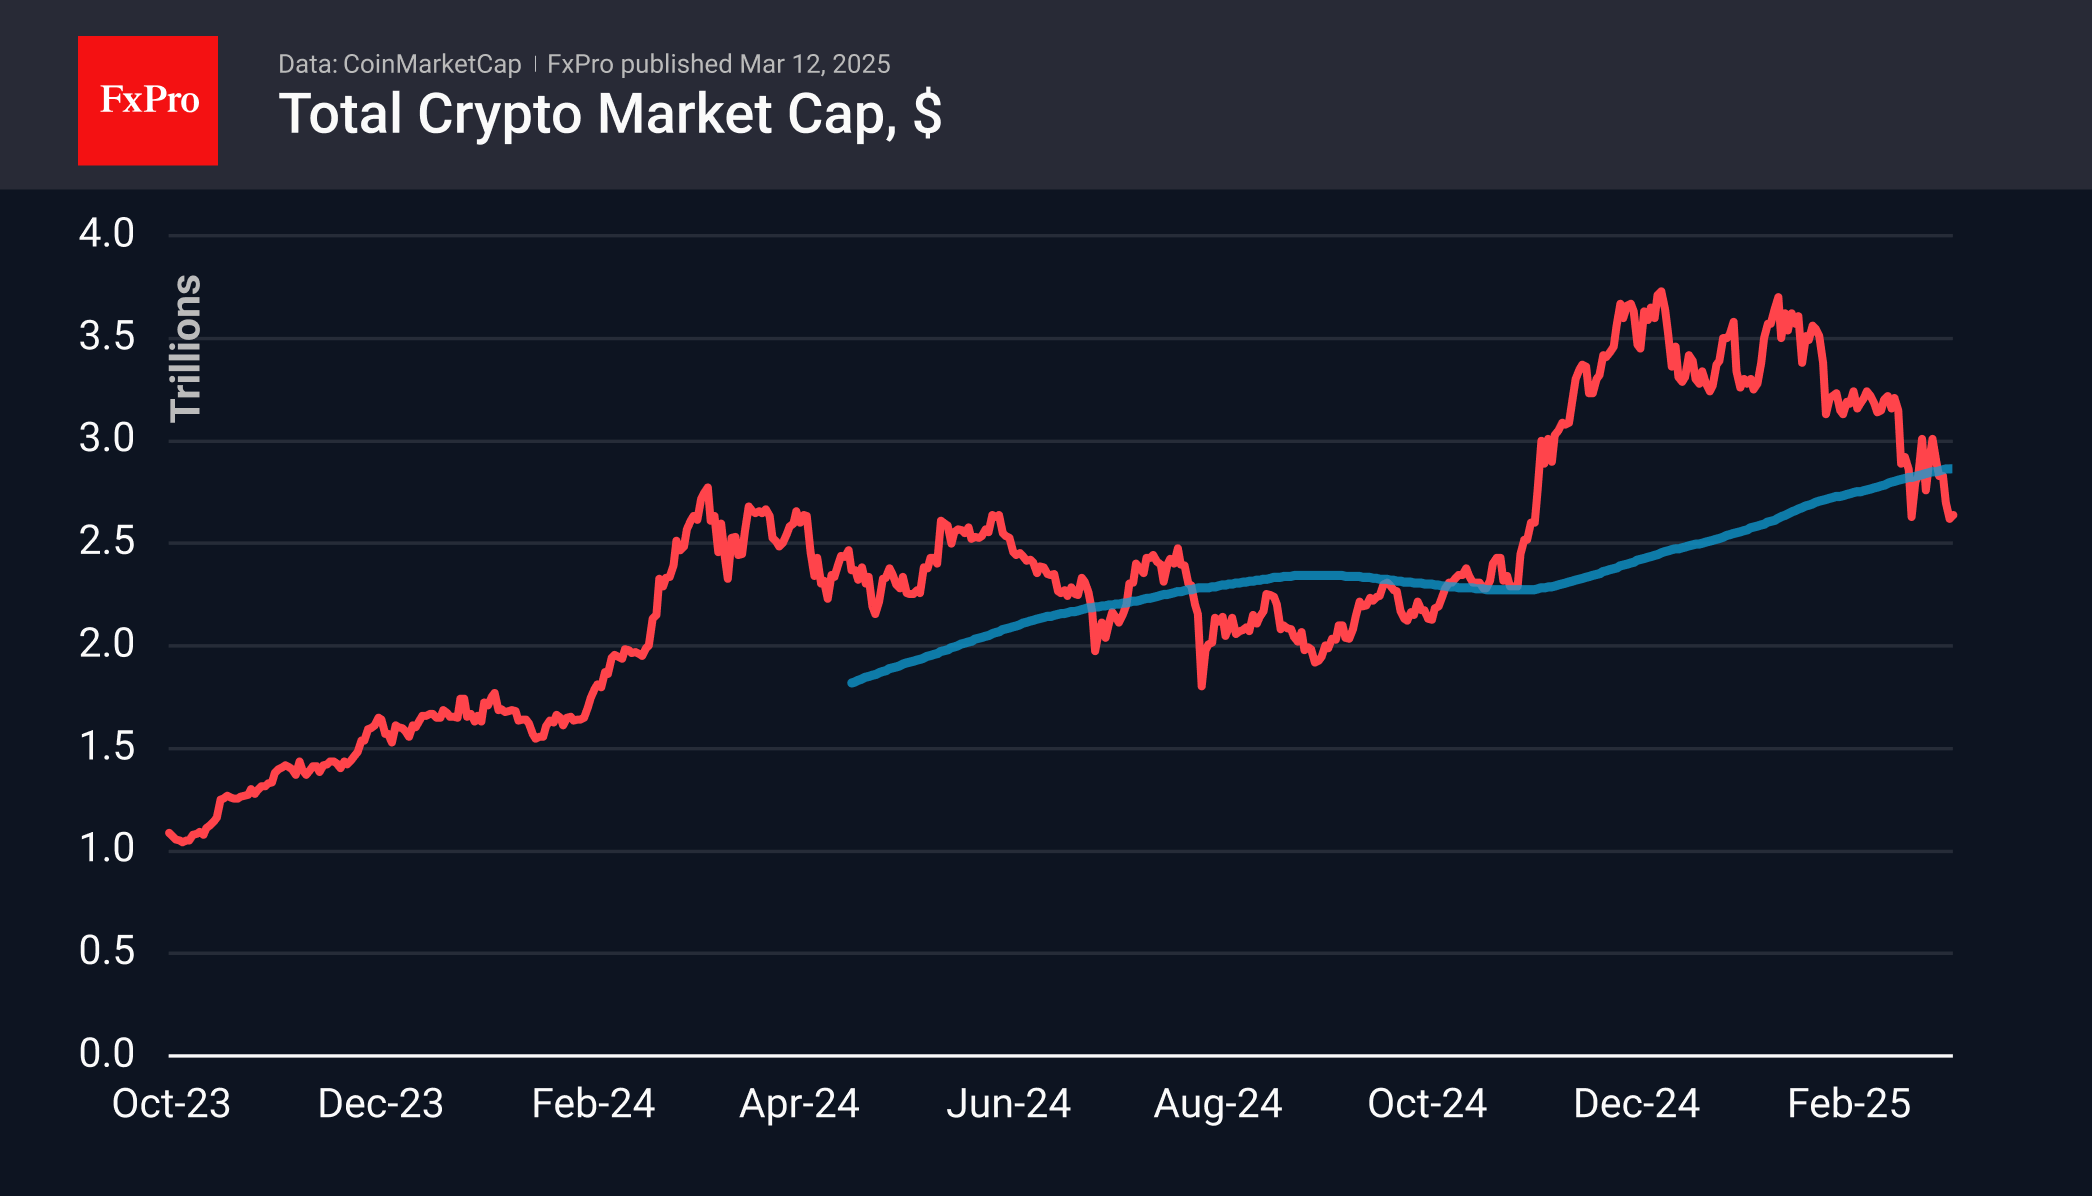
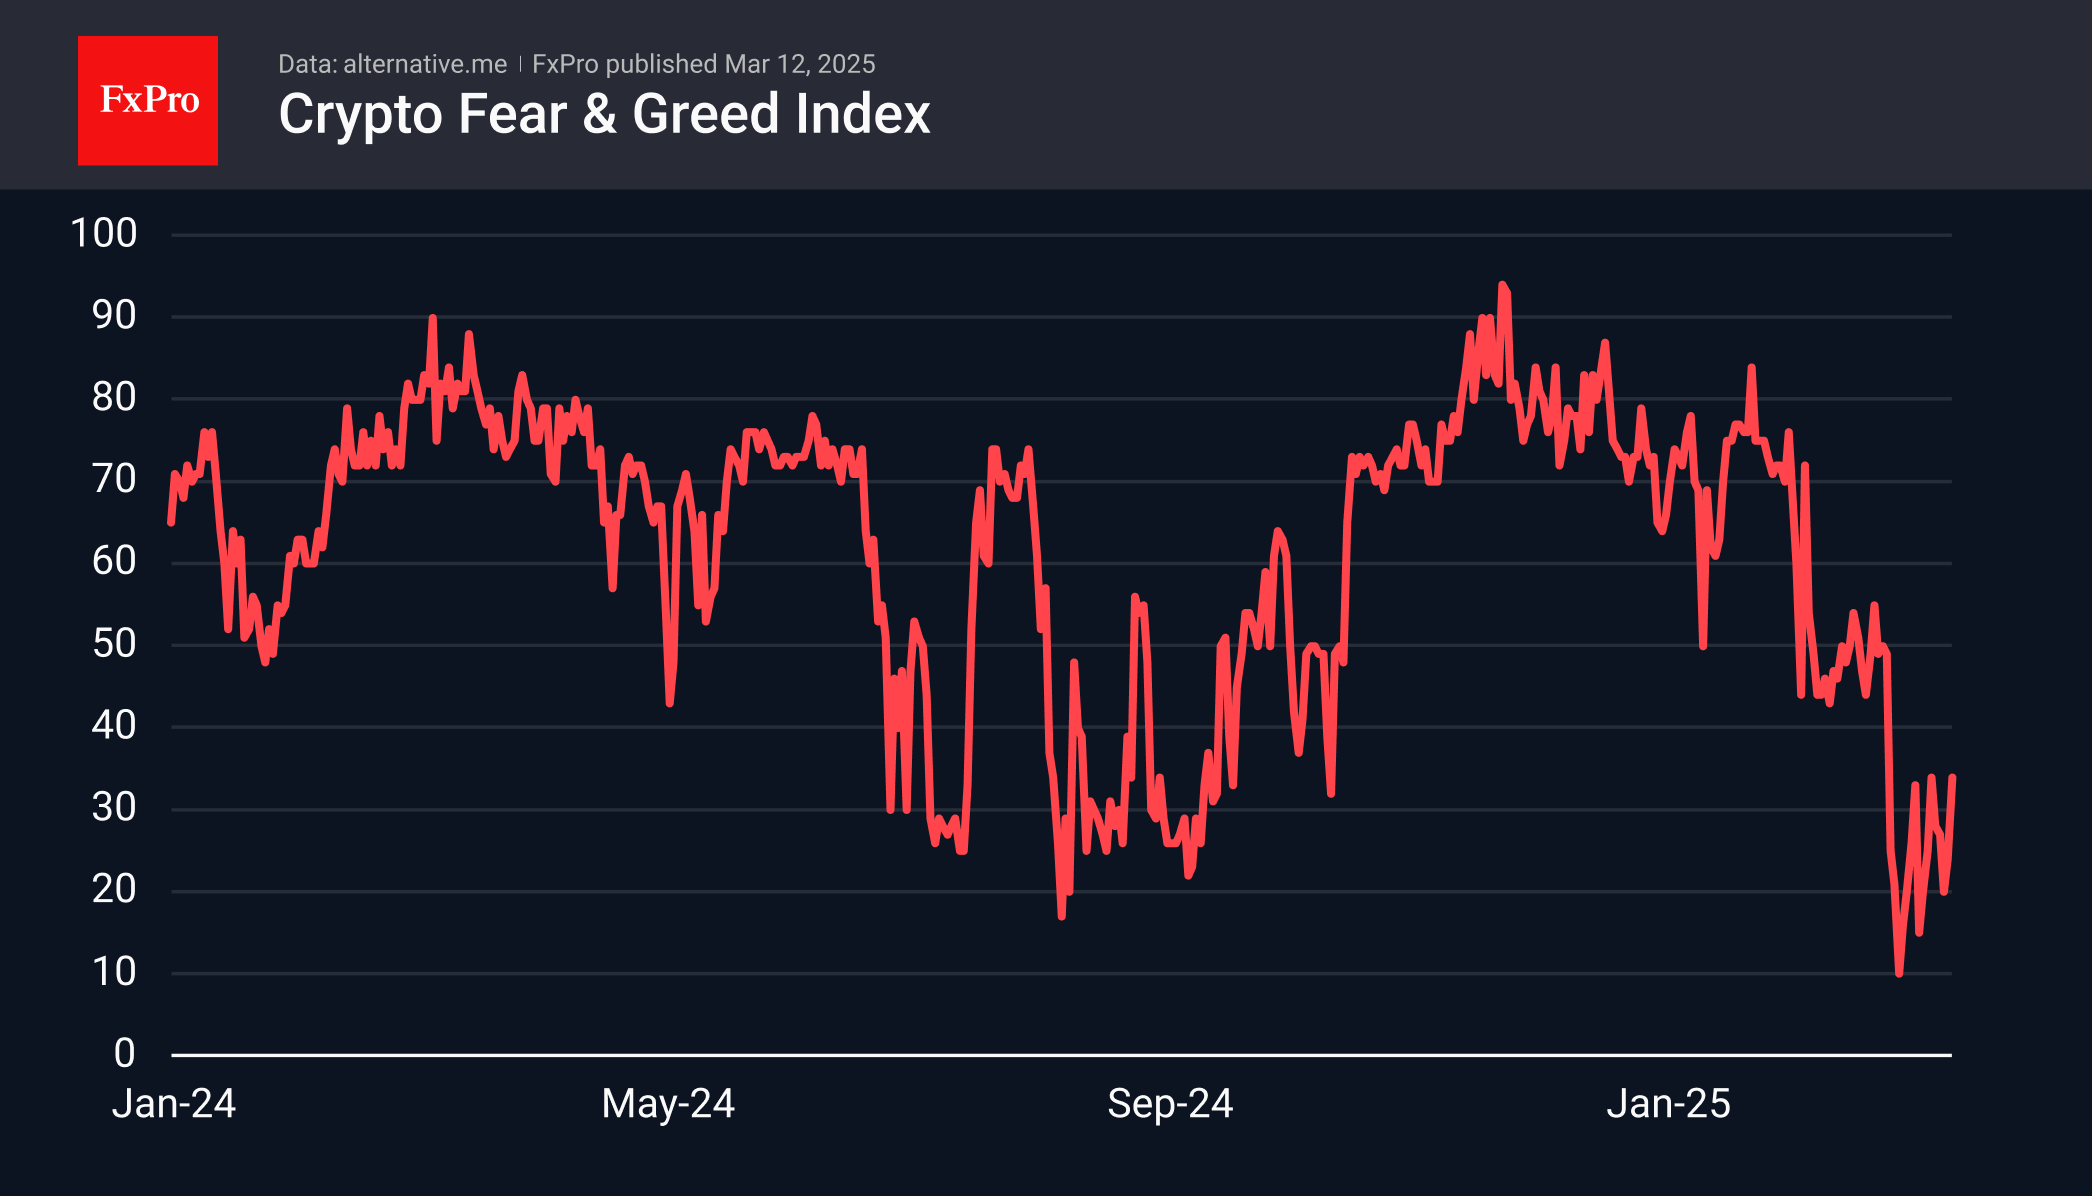
Sentiment in the crypto market has shifted from extreme fear to fear at 34. The indicator was last higher more than three weeks ago, indicating that now is a good time to buy. However, it’s worth paying attention to the nervous stock market before considering investments in more volatile cryptocurrencies.
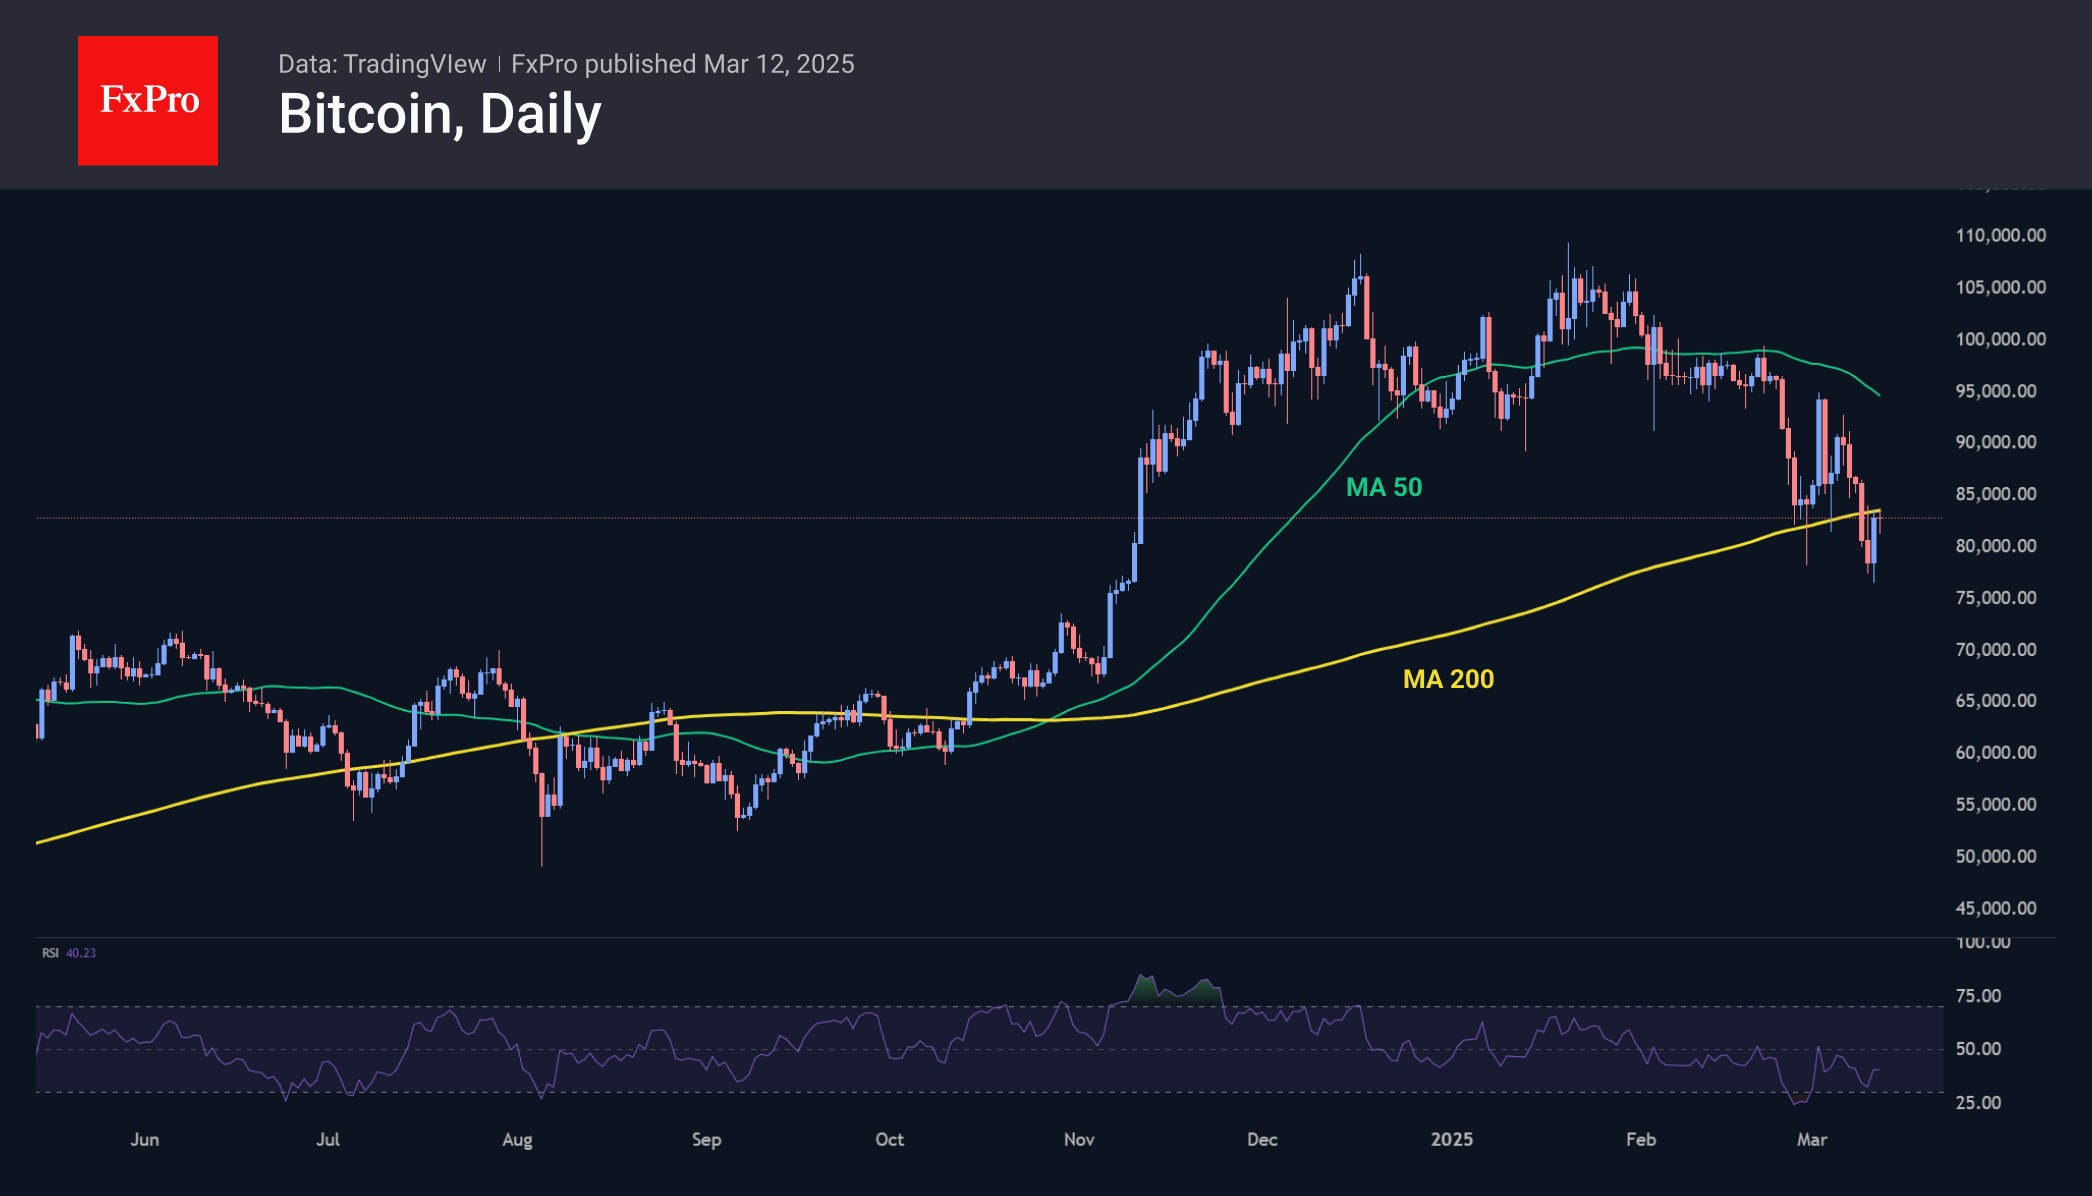
Bitcoin was climbing above $83,000 on Tuesday, hitting resistance in the form of the 200-day moving average. If a long-term trend line is repurposed as resistance, that’s a worrisome bearish fact.
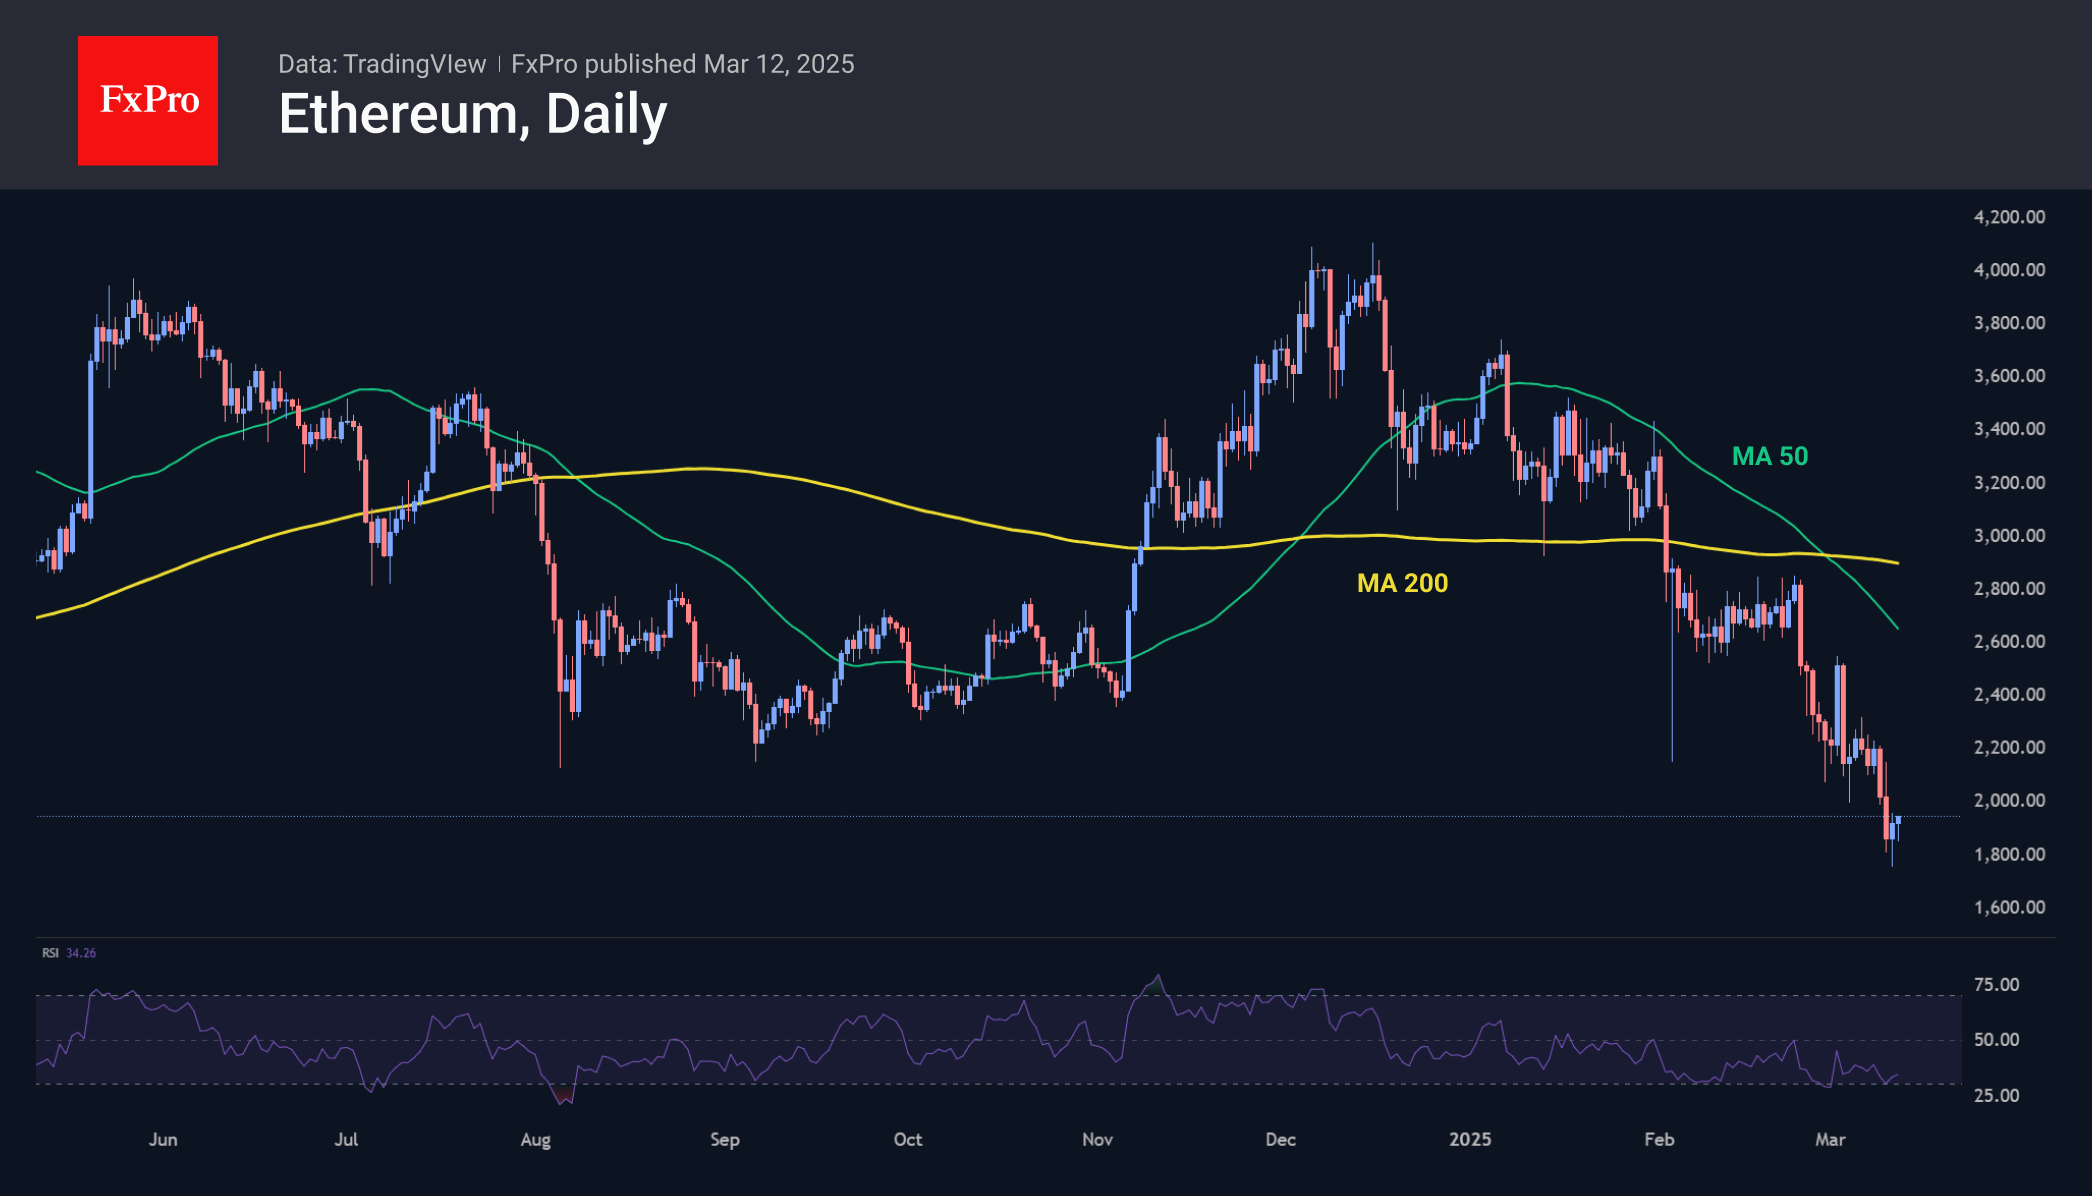
Ethereum ended Tuesday with growth and was trading near $1900 at the start of Wednesday, but this is a timid rebound within the steep peak the coin has been in since February 24th and the broader downtrend of the past three months.
News background
CryptoQuant states a sharp drop in open interest in Bitcoin and Ethereum futures, suggesting a ‘leverage washout’ and a chance of market stabilisation. The Kobeissi Letter admits a wave of short position unwinding in risk assets after extreme fear levels are reached.
Clearstream, the post-trading arm of Deutsche Börse, will offer cryptocurrency settlement and custody services to institutional clients as early as next month, starting with Bitcoin and Ethereum. It then plans to add support for other cryptocurrencies and services for staking, lending and brokerage.
Glassnode notes that Solana fell below its realised price of $134 for the first time in three years. The metrics show the average cost for investors to purchase the coin.
According to Arkham Intelligence, on 11 March, bankrupt exchange Mt. Gox transferred 11,501 BTC (~$905 million) to an unknown address. Mt. Gox-related addresses hold a total of 35,915 BTC worth $2.89bn.
ECB’s Lagarde stresses commitment to price stability amid exceptional high uncertainty
ECB President Christine Lagarde highlighted the "exceptionally high" level of global uncertainty in her speech today, highlighting the challenges posed by trade policy shifts and geopolitical tensions.
She noted that an index measuring trade policy uncertainty is now close to 350—more than six times its average value since 2021. Geopolitical risk indicators are at levels unseen since the Cold War, aside from periods of war and major terrorist attacks.
Against this backdrop, Lagarde emphasized that ECB’s primary focus remains on maintaining price stability over the medium term, stressing that this commitment is "more important than ever" in an unpredictable economic environment.
To achieve this, Lagarde stressed the need for "agility to respond to new shocks" while maintaining a structured policy framework that prevents "short-sighted reactions and unbridled discretion".
She also noted the importance of combining agility with clarity, stating that while the ECB may not always be able to provide certainty about the exact path of interest rates, it can ensure "clarity about our reaction function".
GBP/USD Rallies While EUR/GBP Gains Strength
GBP/USD is showing bullish signs above the 1.2870 zone. EUR/GBP is gaining pace and might extend its upward move above the 0.8445 zone.
Important Takeaways for GBP/USD and EUR/GBP Analysis Today
- The British Pound is gaining pace above the 1.2870 zone against the US Dollar.
- There is a connecting bullish trend line forming with support at 1.2925 on the hourly chart of GBP/USD at FXOpen.
- EUR/GBP started a fresh increase above the 0.8360 resistance zone.
- There is a major bullish trend line forming with support at 0.8402 on the hourly chart at FXOpen.
GBP/USD Technical Analysis
On the hourly chart of GBP/USD at FXOpen, the remained in a positive zone above the 1.2560 level. The British Pound formed a base and started a fresh increase against the US Dollar, as mentioned in the previous analysis.
The pair gained pace for a move above the 1.2715 and 1.2760 resistance levels. The pair even settled above the 1.2900 level and the 50-hour simple moving average.
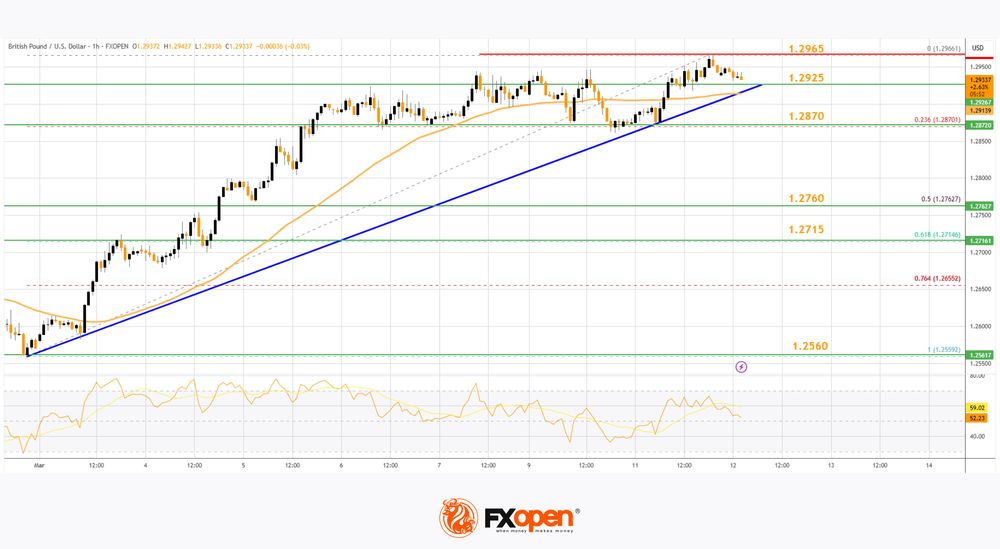
On the upside, the GBP/USD chart indicates that the pair is facing resistance near 1.2965. The next major resistance is near the 1.2980 level. If the RSI moves above 60 and the pair climbs above 1.2980, there could be another rally. In the stated case, the pair could rise toward the 1.3050 level or even 1.3120.
On the downside, there is a major support forming near 1.2925. There is also a connecting bullish trend line forming with support at 1.2925. If there is a downside break below the 1.2925 support, the pair could accelerate lower.
The next major support is near the 1.2870 zone or the 23.6% Fib retracement level of the upward move from the 1.2559 swing low to the 1.2966 high, below which the pair could test 1.2800.
Any more losses could lead the pair toward the 1.2760 support. It is close to the 50% Fib retracement level of the upward move from the 1.2559 swing low to the 1.2966 high.
EUR/GBP Technical Analysis
On the hourly chart of EUR/GBP at FXOpen, the pair started a fresh increase from the 0.8240 zone. The Euro traded above the 0.8360 level to move into a positive zone against the British Pound.
The EUR/GBP chart suggests that the pair settled above the 50-hour simple moving average and 0.8400. Immediate resistance is near 0.8445. The next major resistance for the bulls is near the 0.8460 zone.
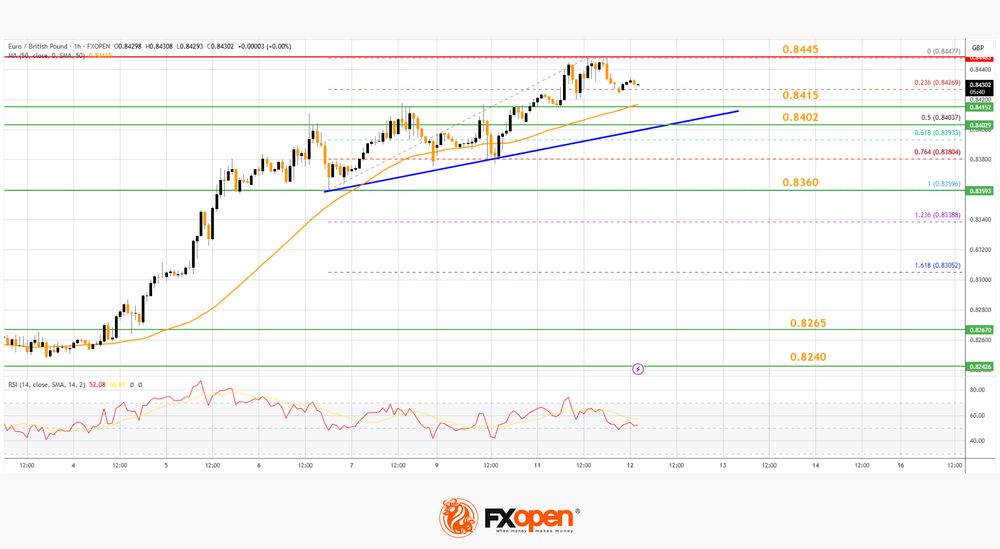
A close above the 0.8460 level might accelerate gains. In the stated case, the bulls may perhaps aim for a test of 0.8500. Any more gains might send the pair toward the 0.8550 level in the coming days.
Immediate support sits near the 23.6% Fib retracement level of the upward move from the 0.8359 swing low to the 0.8447 high. The next major support is near a major bullish trend line at 0.8402.
The 61.8% Fib retracement level of the upward move from the 0.8359 swing low to the 0.8447 high is also at 0.8402. A downside break below the 0.8402 support might call for more downsides.
In the stated case, the pair could drop toward the 0.8360 support level. Any more losses might send the pair toward the 0.8265 level in the near term.
Trade over 50 forex markets 24 hours a day with FXOpen. Take advantage of low commissions, deep liquidity, and spreads from 0.0 pips. Open your FXOpen account now or learn more about trading forex with FXOpen.
This article represents the opinion of the Companies operating under the FXOpen brand only. It is not to be construed as an offer, solicitation, or recommendation with respect to products and services provided by the Companies operating under the FXOpen brand, nor is it to be considered financial advice.
Elliott Wave View: GBPUSD Extending Higher in Wave 5 Impulse
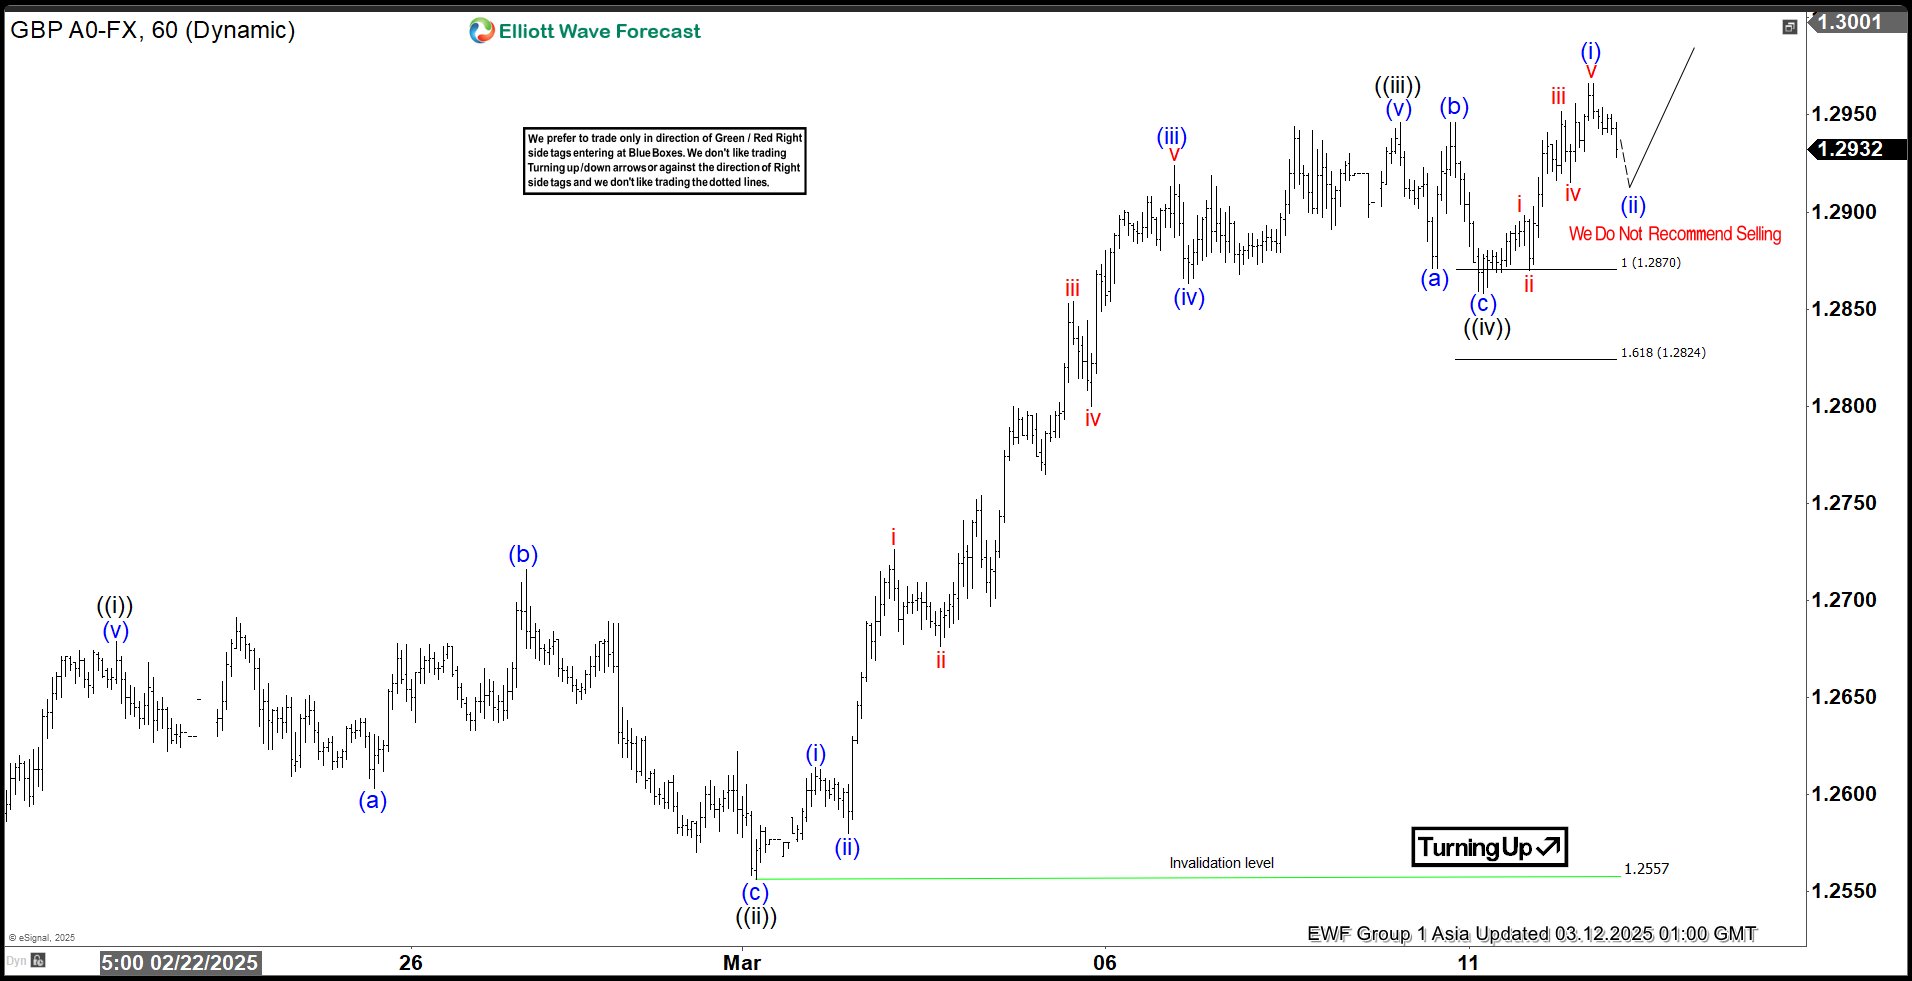
Short Term Elliott Wave View in GBPUSD suggests cycle from 2.3.2025 low is in progress as an impulse. Up from 2.3.2025 low, wave ((i)) ended at 1.2679 s the 1 hour chart below shows. Wave ((ii)) pullback unfolded as an expanded Flat Elliott Wave structure. Down from wave ((i)), wave (a) ended at 1.2603 and wave (b) ended at 1.2716. Wave (c) lower ended at 1.2557 which completed wave ((ii)) in higher degree. Up from there, wave (i) ended at 1.2614 and wave (ii) ended at 1.258. Wave (iii ) higher ended at 1.292 and wave (iv) ended at 1.286. Wave (v) ended at 1.294 which completed wave ((iii)).
Pullback in wave ((iv)) ended at 1.2858 with internal subdivision as a zigzag. Down from wave ((iii)), wave (a) ended at 1.287 and wave (b) ended at 1.294. Wave (c) lower ended at 1.2858 which completed wave ((iv)). Pair has resumed higher in wave ((v)). Up from wave ((iv)), wave (i) ended at 1.2966. Expect wave (ii) pullback to hold above 1.2858, and more importantly above 1.2557 for further upside. As far as pivot at 1.2557 low stays intact, expect dips to find support in 3, 7, or 11 swing for more upside.
GBPUSD 60 Minutes Elliott Wave Chart
GBPUSD Video
https://www.youtube.com/watch?v=aEVkLcSi6HI
Markets Haunted by Multiple, Often Contradictory Story Llines
Markets
Markets recently were haunted by multiple, often contradictory story lines ranging from the potential impact of US tariffs on growth and inflation inside and outside the US, the impact of a fiscal U-turn in Europe, the potential consequences of a cease-fire in Ukraine and the presumed reaction function of central bankers (in particular the Fed and the ECB) on incoming regular inflation and activity data. This complex mix was and remains a perfect prescript of heightened volatility. Yesterday, the storylines of tariffs and Ukraine prevailed. After a ‘calm’ start in Europe, President Trump again rocked the boat. While the US as planned held to raising tariffs on all steel and aluminum to 25% from today on, Trump said Canada would be hit by and additional levy of (total 50 %) as Ontario had announced a retaliatory levy on electricity exported the to the US. This outright escalation of the trade war triggered a new risk-off wave. In the end, Trump’s 50% tariff was scaled back to 25% (Ontario also backtracked). It caused some intraday relief for US equities, but US indices still closed well in negative territory (S&P 500 -0.76%). Despite intraday uncertainty, US yields intraday showed a bottoming out process after recent steep declines. US yields added between 5.5 bps (30-y) and 6.8 bps (5-y). Risk premia outweighing growth fears? In Europe, the established steepening trend of the yield curve unabatedly continued. The 2-y German yield eased marginally (-1.7 bps) but longer maturities again jumped higher (30-y, +6.6 bps). Headlines filtering through on a potential ceasefire in Ukraine (agreement between the US and Ukraine now being forwarded to Russia) only supported the revive Europe trade, with both inflation expectations and real yields rising further. The announcement of the ‘Ukraine’ agreement, also briefly propelled EUR/USD to a new correction top near 1.0945 (close 1.092). The dollar global remained in the defensive with the DXY testing the lowest levels since end October (103.42).
Asian markets are trading mixed this morning. Uncertainty in US (tariff and other) policies remains elevated. The proposal on a ceasefire for the war in Ukraine might be supportive for European (equity) markets. At the same time, the EU this morning already announcement counter-measures planning to impose tariffs on €26 bln of US imports, potentially escalating the trade war. Later today, the ‘data story-line’ might also again come into play with the US February CPI inflation data. Markets expect a 0.3% M/M rising for headline and core inflation resulting in respectively 2.9% and 3.3% Y/Y inflation. Overall noise complicates the reaction function. Even so, a figure in line/higher than expected might supported a tentative bottoming in yields after recent setback. Despite Powell’s balanced wait-and-see guidance, a soft figure might trigger a retest of recent lows. In Europe, the ‘ECB and Its Watchers conference’ in Frankfurt might yield interesting headlines, too. How close is the ECB to a pause or even to the bottom of its easing cycle? First indications this morning suggest EMU yields to stabilize near recent peak levels in the wake of the proposal in a cease-fire in Ukraine. EUR/USD eases slightly. In any both cases, we expect any corrections to stay limited.
News & Views
The US House approves (217-213 vote) a proposal to keep the government funded into fall (September 30) and avoid a government shutdown from kicking in this weekend. The proposal extends funding at fiscal 2024 spending levels, but includes a $6bn increase in military spending and more money for border enforcement. Cuts are made in nondefense spending and Washington DC’s budget. The continuing resolution now heads to Senate where the 60-vote threshold means that Democratic support will be needed. Republicans have a 53-47 majority in Senate. There’s no option included to revise it and return it to the House so it’s either approving or blocking.
Portugal is heading for a third election in less than four years after PM Montenegro lost a confidence vote last night. Opposition socialists, other left-wingers and the extreme right combined forces to shoot down the minority government triggered by a corruption scandal around the PM. Latest election polls show Socialists leading with 30.8% of the vote ahead of 25.8% for the ruling Democratic Alliance coalition. New elections are expected to take place in May.
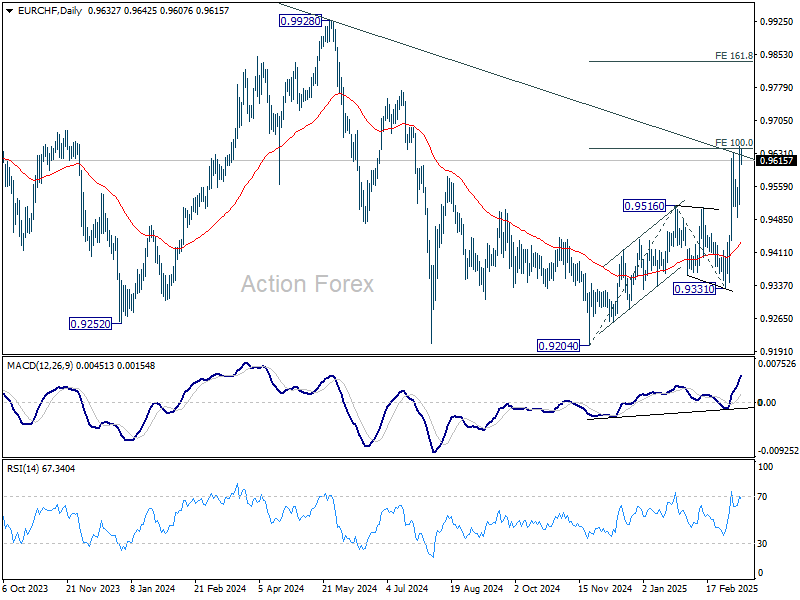
EUR/CHF Daily Outlook
Daily Pivots: (S1) 0.9555; (P) 0.9602; (R1) 0.9686; More....
EUR/CHF's rally resumed by breaching 0.9634 and intraday bias is back on the upside. Sustained break of 100% projection of 0.9204 to 0.9516 from 0.9331 at 0.9643 will pave the way to 161.8% projection at 0.9836 next. For now, further rise is expected as long as 0.9489 support holds, in case of retreat.
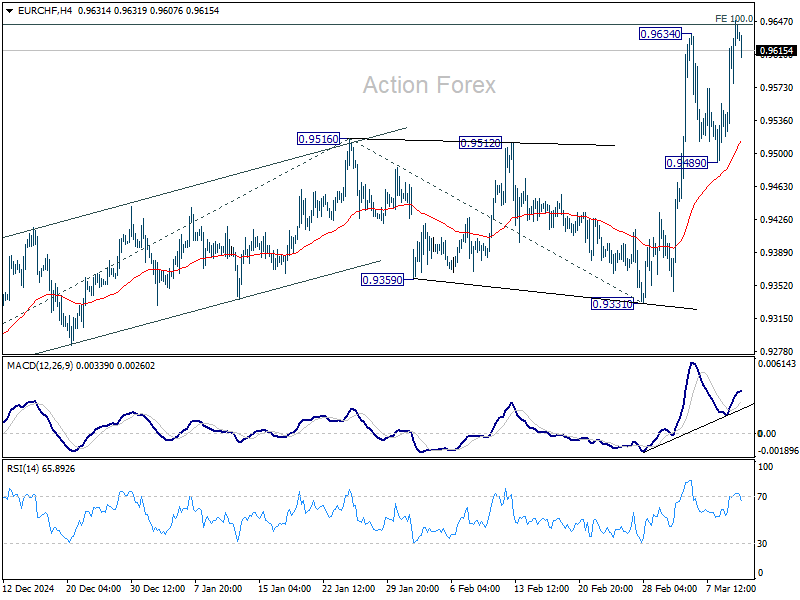
In the bigger picture, the strong break of 55 W EMA (now at 0.9482) is a medium term bullish sign. Sustained break trading above long-term falling channel resistance (at around 0.9620) would suggest that the downtrend from 1.2004 (2018 high) has bottomed at 0.9204. Stronger rally should then be see to 0.9928 key resistance at least.
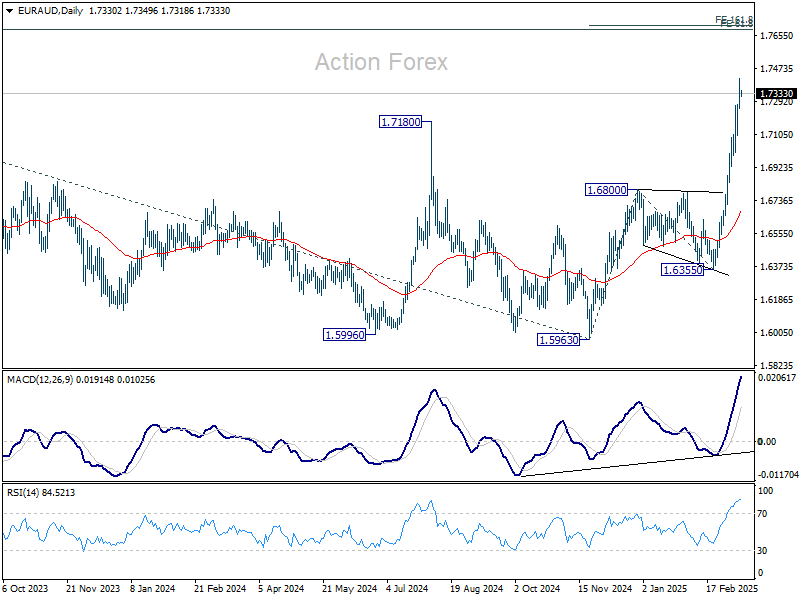
EUR/AUD Daily Outlook
Daily Pivots: (S1) 1.7250; (P) 1.7334; (R1) 1.7422; More...
Intraday bias in EUR/AUD stays on the upside for the moment. Rise from 1.6335 is in progress for 161.8% projection of 1.5963 to 1.6800 from 1.6355 at 1.7709 next. On the downside, below 1.7102 minor support will turn intraday bias neutral again and bring consolidations, before staging another rally.
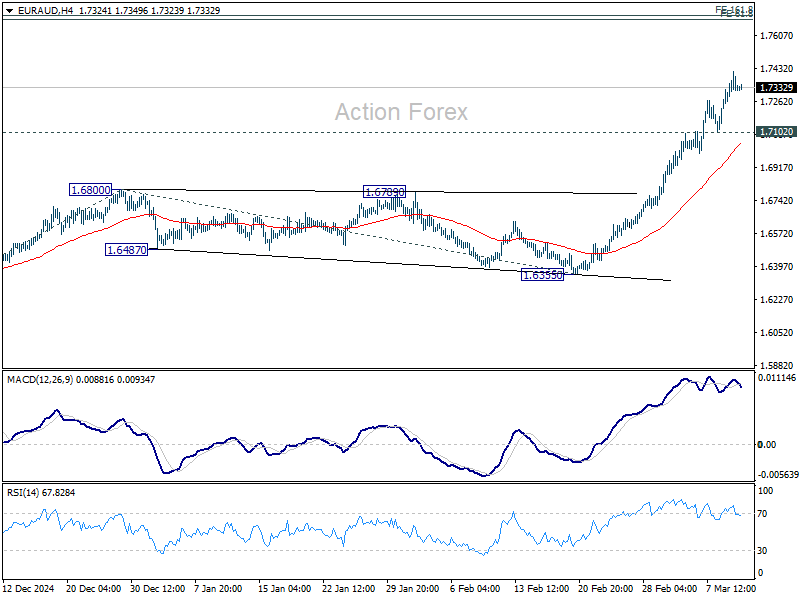
In the bigger picture, up trend from 1.4281 (2022 low) is resuming. Sustained trading above 1.7180 key resistance will pave the way to 61.8% projection of 1.4281 to 1.7062 from 1.5963 at 1.7682, which is also close to 61.8% retracement of 1.9799 (2020 high) to 1.4281 at 1.7691. For now, this will remain the favored case as long as 1.6355 support holds, even in case of deep pullback.