
Sample Category Title
USD/CAD Daily Outlook
Daily Pivots: (S1) 1.4370; (P) 1.4445; (R1) 1.4511; More...
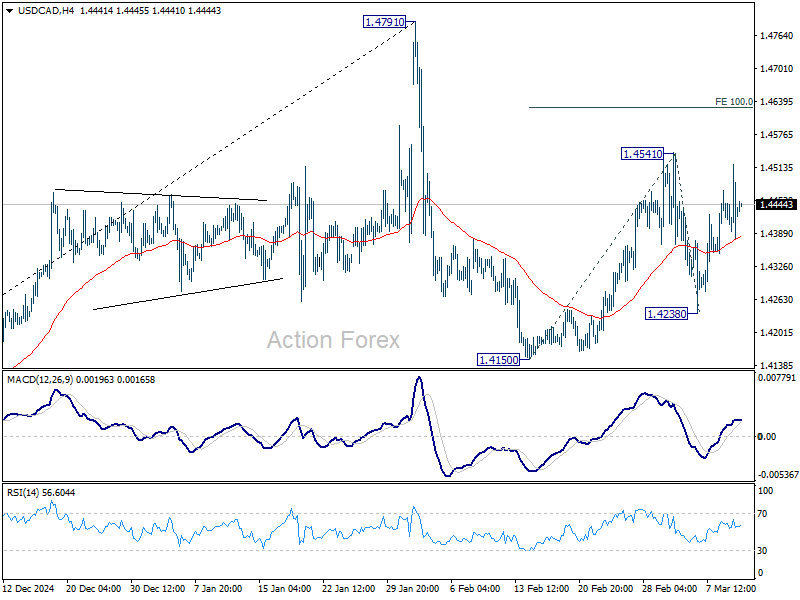
USD/CAD retreated ahead of 1.4541 and resistance and intraday bias is turned neutral first. Overall, price actions from 1.4791 high are seen as a corrective pattern, with rebound from 1.4150 as the second leg. On the upside, break of 1.4541 will target 100% projection of 1.4150 to 1.4541 from 1.4238 at 1.4629 and above. But for now, strong resistance is expected from 1.4791 to limit upside to bring the third leg. On the downside, break of 1.4238 will confirm that the third leg has started through 1.4150 support.
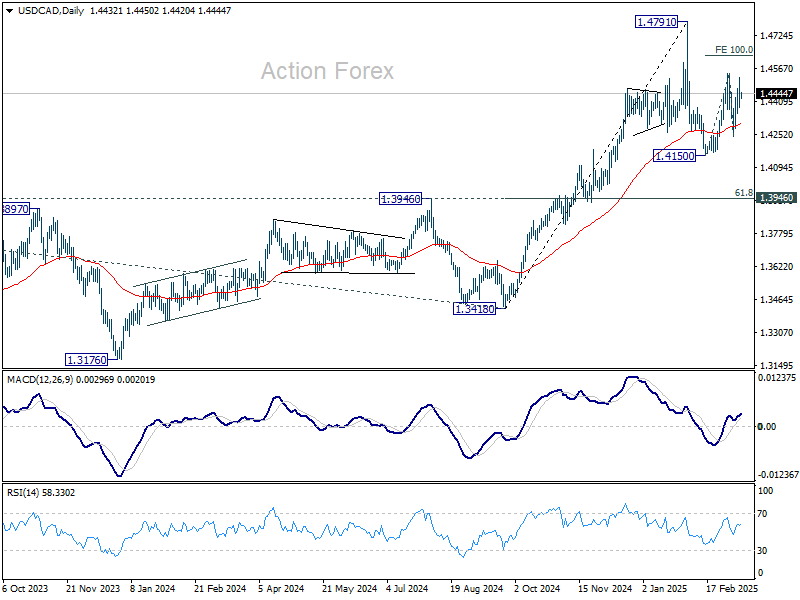
In the bigger picture, long term up trend is tentatively seen as resuming with prior breach of 1.4667/89 key resistance zone (2020/2015 highs). Next target is 100% projection of 1.2401 to 1.3976 from 1.3418 at 1.4993. This will remain the favored case as long as 1.3976 resistance turned support holds (2022 high), even in case of deep pullback.
Canadian Dollar Volatile on Trade Chaos, Focus Shifts to BoC Cut and US CPI
Canadian Dollar endured a roller-coaster session overnight, initially hitting turbulence after US President Donald Trump threatened to double tariffs on Canadian steel and aluminum imports to 50%. Markets were rattled by the surprise escalation, which was set to take effect within hours. However, the situation shifted after Ontario Premier Doug Ford agreed to suspend a surcharge on electricity exports to the US and scheduled a meeting with US Commerce Secretary Howard Lutnick. Following Trump’s indication that tariffs could be lowered after the talks, the Loonie managed to pare some of its earlier losses.
Despite this temporary relief, uncertainty surrounding tariffs is likely to weigh on business and consumer confidence on both sides of the border. Markets are now increasingly betting that BoC will need to extend its easing cycle to cushion against economic fallout. With a 25bps rate cut widely expected at today’s BoC meeting, traders are now pricing in at least two additional rate cuts by the end of the year. The central bank’s guidance will be critical in shaping expectations for further policy moves, particularly as growth concerns deepen amid trade war disruptions.
Another key event on traders’ radar today is US Consumer Price Index release. Though volatility could spike on the initial headline print, many market participants expect to “look through” the immediate reaction and return to the broader risk-off narrative. Recession worries, fueled by inconsistent trade policies and softer macro data, continue to overshadow the Dollars performance. This environment has generally weighed on the greenback in recent sessions, even though it managed a modest recovery from the steep selloff triggered by intensifying tariff drama.
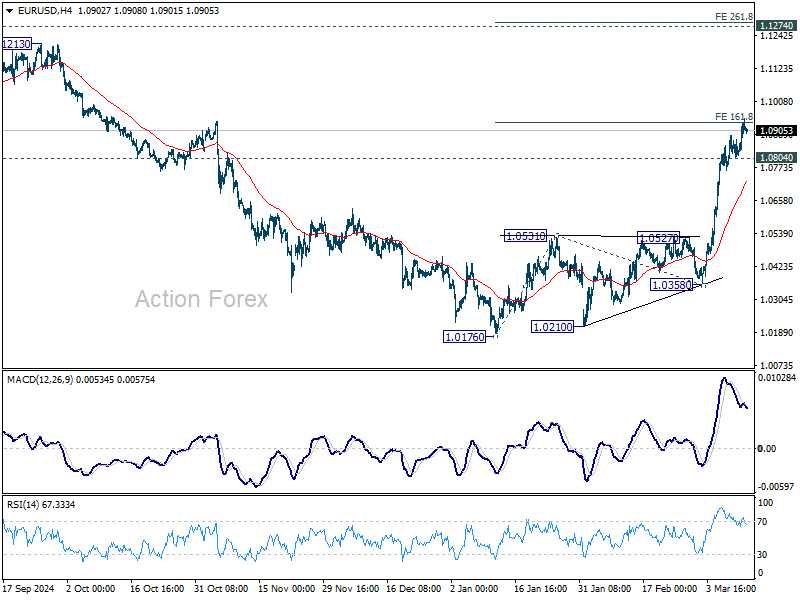
Technically, EUR/USD appears to be taking a breather after hitting 161.8% projection of 1.0176 to 1.0531 from 1.0358 at 1.0932. But further rally is expected aslong as 1.0804 support holds. Firm break of 1.0932 could prompt upside reacceleration to 200% projection at 1.1287, which is slightly above 1.1274 key resistance. Nevertheless, break of 1.0804 will bring consolidations first.
In terms of weekly performance so far, Euro remains the best-performing currency. The British Pound follows closely behind, while Dollar has managed to stabilize, recovering some of its recent losses. On the other end of the spectrum, Canadian Dollar is currently the weakest performer, reflecting ongoing trade concerns and expectations of deeper BoC rate cuts. Swiss Franc and Australian Dollar are also lagging, while New Zealand dollar and Japanese Yen are positioned in the middle of the pack.
In Asia, at the time of writing, Nikkei is up 0.35%. Hong Kong HSI is down -0.35%. China Shanghai SSE is up 0.10%. Singapore Strait TImes is up 0.46%. Japan 10-year JGB yield is up 0.025 at 1.531. Overnight, DOW fell -1.14%. S&P 500 fell -0.76%. NASDAQ fell -0.18%. 10-year yield rose 0.075 to 4.288.
US CPI in focus as DOW vulnerable with double top breakdown
Market sentiment in the US remains fragile ahead of today’s CPI data for February, which is expected to be a major market-moving event. The challenge, however, lies in interpreting the impact of inflation data given the complex interplay between inflation trends, economic conditions, and Fed expectations. More importantly, the interaction is further complicated by the unpredictable shifts in US tariff policies. In the end, while traders may react initially to the numbers, they're more likely to revert to pre-existing trends once the CPI risk is cleared.
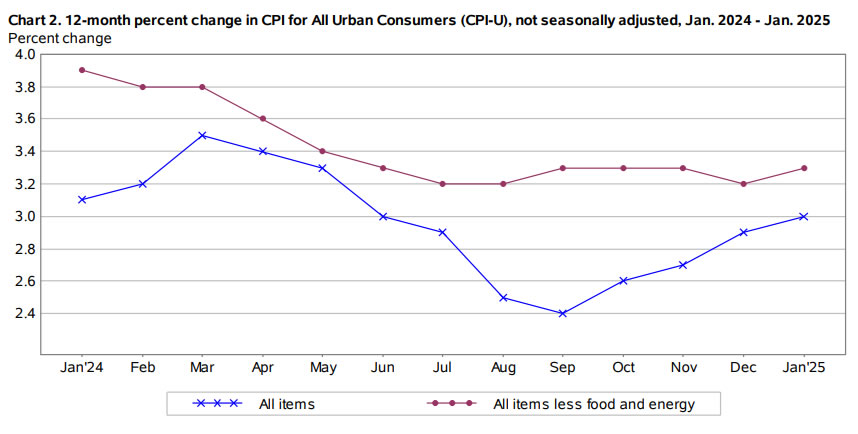
Consensus forecast sees headline CPI dipping slightly from 3.0% to 2.9%, signaling that the uptrend from September’s low of 2.4% has finally ended. Meanwhile, core CPI is expected to ease marginally from 3.3% to 3.2%, but remains stuck in a narrow 3.2%-3.3% range since last June.
If the data confirms these expectations, it would reinforce the view that disinflation progress continued to stall. This, in turn, supports Fed’s cautious stance. Fed Chair Jerome Powell has repeatedly stressed that the central bank is in no rush to lower interest rates, and today’s inflation data is unlikely to change that narrative.
Fed fund futures are currently pricing in a 97% probability that Fed will hold rates at 4.25%-4.50% in its upcoming March 19 meeting, making it almost a certainty. However, the outlook for Q2 is much murkier. Traders are factoring in a 38% probability of a cut in May and an 85% chance of a reduction in June.
Beyond the near term, the real test will come in April when reciprocal tariffs are formalized. Given recent stock market volatility, where recession concerns have already led to deep selloffs, any additional economic stress from tariffs could further push Fed toward an aggressive easing cycle.
Some economists have already noted that the May or June rate cut could indeed start a series of swift reductions in the second half of the year, if confidence deteriorates further—especially if the labor market weakens significantly.
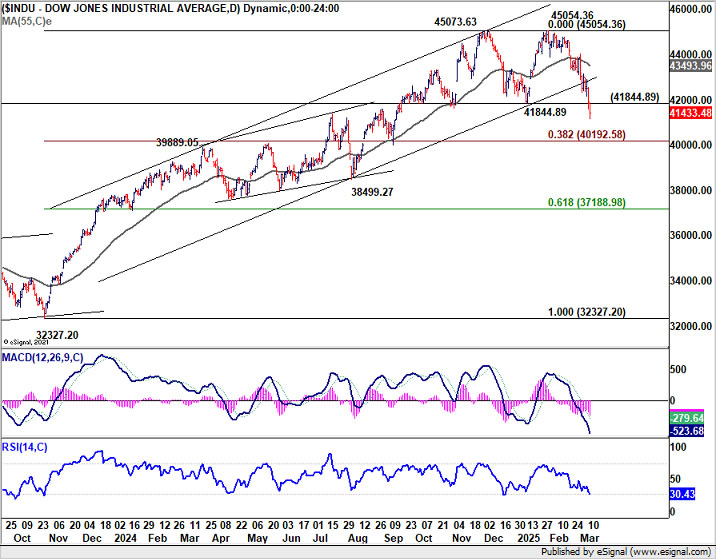
Technically, DOW should have completed a double top pattern (45073.63, 45054.36) after breaking through 41844.89 support. While deeper pull back is now in favor, strong support could be seen around 40k zone to contain downside, at least on first attempt.
The 40k zone represents 39889.05 resistance turned support, as well as 38.2% retracement of 32327.20 to 45054.36 at 40192.58. This development would keep price actions from 45054.36 as a correction to rise from 32327.20 only, likely a sideway pattern.
However, decisive break of 40k will argue that DOW is already in an even larger scale correction, or enter a bear market as some would describe.
BoJ’s Ueda acknowledges rising yields as market bets on policy shift
BoJ Governor Kazuo Ueda addressed the recent rise in bond yields, and noted, "I don't see a big divergence between our view and that of markets".
Speaking to parliament, Ueda emphasized the "biggest determinant" of long-term interest rates is market expectations regarding the central bank’s short-term policy rate.
He added, it is "natural for long-term rates to move in a way that reflects such market forecasts". His comments come as Japan’s benchmark 10-year bond yield surged to a 16-year high of 1.575% on Monday.
Separately, Japan’s latest inflation data showed that annual wholesale inflation slowed slightly in February. Corporate goods price index , which tracks the prices businesses charge each other for goods and services, rose 4.0% yoy, in line with market expectations, down from January’s 4.2% yoy increase.
USD/CAD Daily Outlook
Daily Pivots: (S1) 1.4370; (P) 1.4445; (R1) 1.4511; More...
USD/CAD retreated ahead of 1.4541 and resistance and intraday bias is turned neutral first. Overall, price actions from 1.4791 high are seen as a corrective pattern, with rebound from 1.4150 as the second leg. On the upside, break of 1.4541 will target 100% projection of 1.4150 to 1.4541 from 1.4238 at 1.4629 and above. But for now, strong resistance is expected from 1.4791 to limit upside to bring the third leg. On the downside, break of 1.4238 will confirm that the third leg has started through 1.4150 support.
In the bigger picture, long term up trend is tentatively seen as resuming with prior breach of 1.4667/89 key resistance zone (2020/2015 highs). Next target is 100% projection of 1.2401 to 1.3976 from 1.3418 at 1.4993. This will remain the favored case as long as 1.3976 resistance turned support holds (2022 high), even in case of deep pullback.
US CPI in focus as DOW vulnerable with double top breakdown
Market sentiment in the US remains fragile ahead of today’s CPI data for February, which is expected to be a major market-moving event. The challenge, however, lies in interpreting the impact of inflation data given the complex interplay between inflation trends, economic conditions, and Fed expectations. More importantly, the interaction is further complicated by the unpredictable shifts in US tariff policies. In the end, while traders may react initially to the numbers, they're more likely to revert to pre-existing trends once the CPI risk is cleared.
Consensus forecast sees headline CPI dipping slightly from 3.0% to 2.9%, signaling that the uptrend from September’s low of 2.4% has finally ended. Meanwhile, core CPI is expected to ease marginally from 3.3% to 3.2%, but remains stuck in a narrow 3.2%-3.3% range since last June.
If the data confirms these expectations, it would reinforce the view that disinflation progress continued to stall. This, in turn, supports Fed’s cautious stance. Fed Chair Jerome Powell has repeatedly stressed that the central bank is in no rush to lower interest rates, and today’s inflation data is unlikely to change that narrative.
Fed fund futures are currently pricing in a 97% probability that Fed will hold rates at 4.25%-4.50% in its upcoming March 19 meeting, making it almost a certainty. However, the outlook for Q2 is much murkier. Traders are factoring in a 38% probability of a cut in May and an 85% chance of a reduction in June.
Beyond the near term, the real test will come in April when reciprocal tariffs are formalized. Given recent stock market volatility, where recession concerns have already led to deep selloffs, any additional economic stress from tariffs could further push Fed toward an aggressive easing cycle.
Some economists have already noted that the May or June rate cut could indeed start a series of swift reductions in the second half of the year, if confidence deteriorates further—especially if the labor market weakens significantly.
Technically, DOW should have completed a double top pattern (45073.63, 45054.36) after breaking through 41844.89 support. While deeper pull back is now in favor, strong support could be seen around 40k zone to contain downside, at least on first attempt.
The 40k zone represents 39889.05 resistance turned support, as well as 38.2% retracement of 32327.20 to 45054.36 at 40192.58. This development would keep price actions from 45054.36 as a correction to rise from 32327.20 only, likely a sideway pattern.
However, decisive break of 40k will argue that DOW is already in an even larger scale correction, or enter a bear market as some would describe.
Crypto Struggles: Bitcoin Dips Further, Recovery Faces Major Hurdles
Key Highlights
- Bitcoin price declined heavily and even traded below the $80,000 support.
- BTC is now well below a key bearish trend line with resistance at $86,650 on the 4-hour chart.
- Ethereum price also declined and traded below the $2,000 support.
- The US CPI could rise 2.9% in Feb 2025 (YoY).
Bitcoin Price Technical Analysis
Bitcoin price made a couple of attempts to settle above $90,000 against the US Dollar. However, BTC failed and started a fresh decline.
Looking at the 4-hour chart, the price gained bearish momentum after it broke the $85,000 support zone. There was a close below the $85,000 level, the 100 simple moving average (red, 4-hour) and the 200 simple moving average (green, 4-hour).
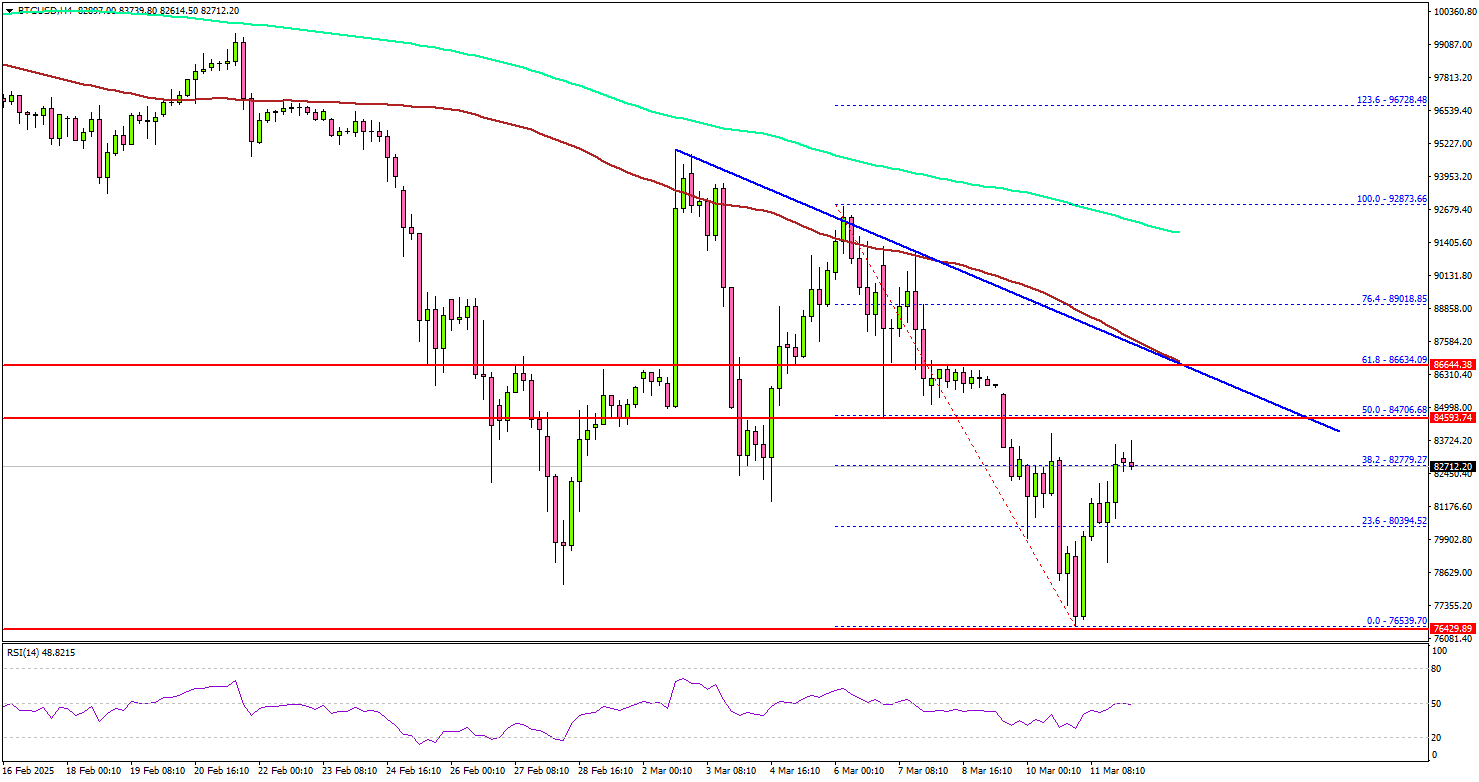
The bears even pushed the price below the $80,000 mark. A low was formed at $76,539 and the price is now consolidating losses. On the upside, the price could face resistance near the $84,700 level or the 50% Fib retracement level of the downward move from the $92,873 swing high to the $76,539 low.
The next key resistance is $86,500. There is also a key bearish trend line forming with resistance at $86,650 on the same chart. It is close to the 61.8% Fib retracement level of the downward move from the $92,873 swing high to the $76,539 low.
A successful close above $86,650 might start another steady increase. In the stated case, the price may perhaps rise toward the $90,000 level. Any more gains might call for a test of $92,000.
Immediate support is near the $78,500 level. The next key support sits at $76,650. A downside break below $76,650 might send Bitcoin toward the $75,000 support. Any more losses might send the price toward the $72,500 support zone.
Looking at Ethereum, there was a fresh bearish reaction and the bears pushed the price below the $2,000 support zone.
Today’s Economic Releases
- US Consumer Price Index for Feb 2025 (MoM) – Forecast +0.3%, versus +0.5% previous.
- US Consumer Price Index for Feb 2025 (YoY) – Forecast +2.9%, versus +3.0% previous.
- US Consumer Price Index Ex Food & Energy for Feb 2025 (YoY) – Forecast +3.2%, versus +3.3% previous.
BoJ’s Ueda acknowledges rising yields as market bets on policy shift
BoJ Governor Kazuo Ueda addressed the recent rise in bond yields, and noted, "I don't see a big divergence between our view and that of markets".
Speaking to parliament, Ueda emphasized the "biggest determinant" of long-term interest rates is market expectations regarding the central bank’s short-term policy rate.
He added, it is "natural for long-term rates to move in a way that reflects such market forecasts". His comments come as Japan’s benchmark 10-year bond yield surged to a 16-year high of 1.575% on Monday.
Separately, Japan’s latest inflation data showed that annual wholesale inflation slowed slightly in February. Corporate goods price index , which tracks the prices businesses charge each other for goods and services, rose 4.0% yoy, in line with market expectations, down from January’s 4.2% yoy increase.
US CPI Release Today: What to Expect and Market Reactions
- Economists expect a slight slowdown in both overall and core CPI.
- Tariffs and potential future universal tariffs are a key concern, adding to price pressures and raising fears of stagflation and a possible recession.
- The US Dollar Index is currently struggling technically, with the 14-period RSI in oversold territory.
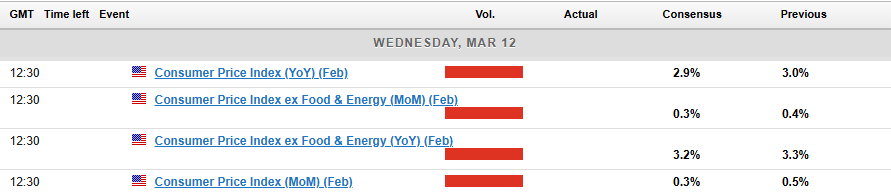
US CPI inflation data will be released on Wednesday March 12 at 12h30 GMT time. Markets are paying close attention to the release as it may offer insights into the trajectory of inflation amid an economy balancing persistent price pressures and emerging signs of a slowdown.
What are Markets Expecting from the CPI Data?
Economists expect February’s overall CPI to go up by 0.3% compared to last month, slowing down from January’s 0.5% increase. This slowdown would bring yearly inflation down to 2.9% from January’s 3.0%, marking the first time it has dropped below 3% since early 2023.
For core CPI, which leaves out food and energy prices, forecasts also point to a 0.3% monthly rise. Annually, core inflation is expected to slightly ease to 3.1% from 3.3% in January.
While this suggests inflation might be slowing, there are mixed signals in the economy. Wages are growing faster than expected, but costs for services are coming down, and demand in some key industries is weakening. This creates an unclear picture for where inflation is headed while inflation expectations have shown significant increases off late.
A Market at a Crossroad – Why This CPI Print Matters
Inflation trends are important for Federal Reserve decisions and financial markets. The Fed is focused on bringing inflation down to its 2% target, but unexpected changes in recent economic data have made things more uncertain. Recessionary fears have also muddied the outlook on Fed rate policy moving forward.
Markets are keeping a close eye to see if inflation will keep slowing or start rising again as tariffs are now playing a key role.
The imposition of tariffs on imports from Canada, Mexico, and China has raised concerns about future price pressures. These tariffs could add to goods inflation as businesses pass higher costs on to consumers.
There have also been warnings from President Trump that universal tariffs are still scheduled to come into effect on April 2, 2025. This would add just another layer of intrigue, while at the same time spur on fears of a potential recession.
Stagflation Concerns Loom
Stagflation, where the economy slows down but prices stay high, presents a tough challenge. If this happens, the Federal Reserve would have fewer options to manage the situation. Economists say that long-lasting tariffs and issues in the job market could make things worse. US data of late has been softer than expected while some companies have issued warnings around prospects for the next 12 months adding to the stagflation narrative.
Potential Market Impact
Looking at the potential scenarios from the CPI release, I have created a table that may help. Now this of course is no guarantee as to how the market may react but rather my take on the potential movements that could materialize.
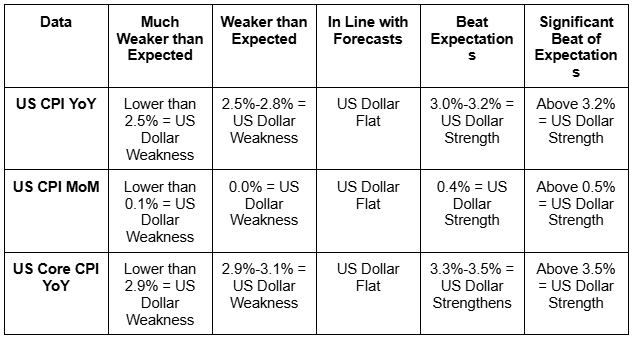
Source: LSEG, TradingEconomics. Table created by Zain Vawda
The above table provides an insight into what I expect will happen depending on the CPI prints released later in the day.
My personal expectations are that the data will land quite close to expectations which could lead to some short-term volatility and whipsaw price action before markets settle down.
Technical Analysis
US Dollar Index (DXY)
From a technical standpoint, the US Dollar Index has struggled and continues to do so. The index is trading below the levels it did when the US election took place on November 5 2024.
The only positive for the US Dollar at the moment is that the 14-period RSI is in oversold territory. A sign that a recovery may be around the corner?
However, as we know the RSI could hover in oversold territory for extended periods of time.
The CPI print will definitely stoke some volatility but at present the tariff and geopolitical developments are overshadowing data releases.
Given that there is the possibility that any move may prove short-lived as tariff developments and comments are coming through thick and fast.
Immediate resistance rests at 103.650 and 104.00 before the confluence level at 105.00.
Immediate support rests at 103.170 and 103.00 before the 102.65 and 102165 handle comes into play.
US Dollar Index Daily Chart, March 11, 2025
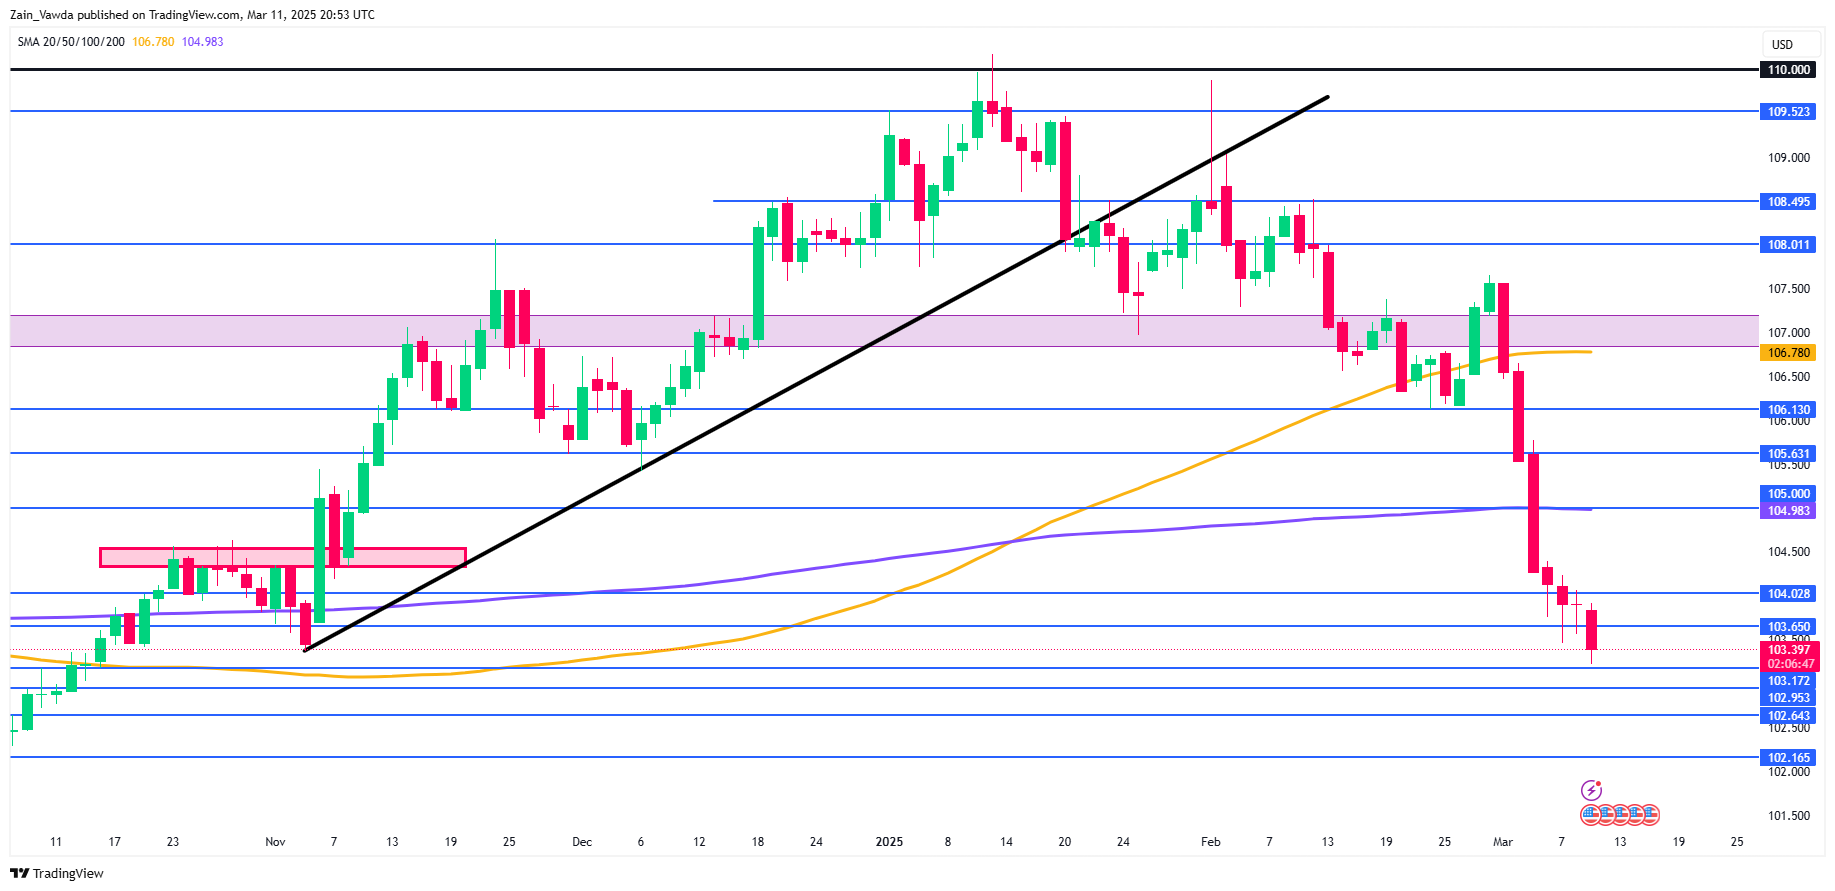
Source: TradingView (click to enlarge)
Support
- 103.17
- 103.00
- 102.65
Resistance
- 103.65
- 104.00
- 105.00
Bitcoin Wave Analysis
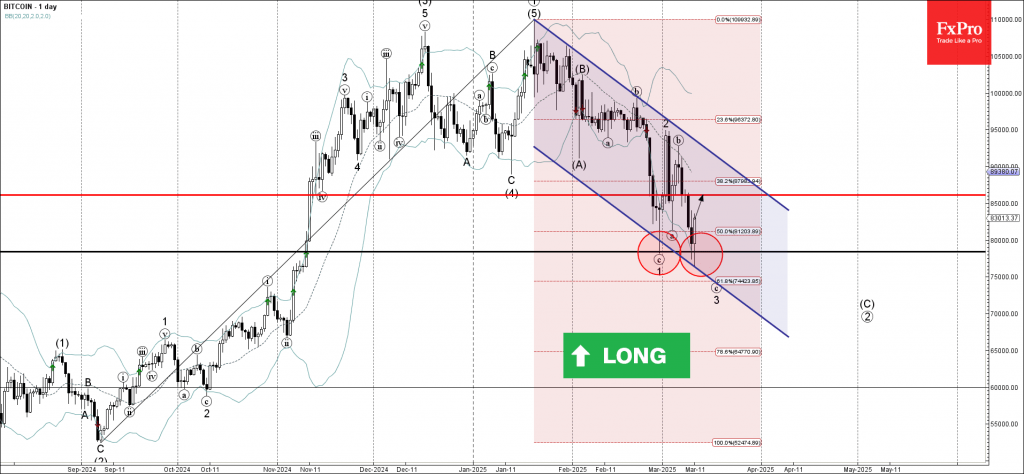
Bitcoin: ⬆️ Buy
- Bitcoin reversed from pivotal support level 78375.00
- Likely to rise to the resistance 85000.00
Bitcoin cryptocurrency recently reversed up from the support area between the pivotal support level 78375.00 (which formed the daily Hammer in February), the support trendline of the daily down channel from January and the lower daily Bollinger Band.
The upward reversal from this support area is expected to form the daily Japanese candlesticks reversal pattern Bullish Engulfing (strong buy signal for Bitcoin).
Given the long-term uptrend, Bitcoin can be expected to rise to the next resistance level 85000.00.
CADJPY Wave Analysis
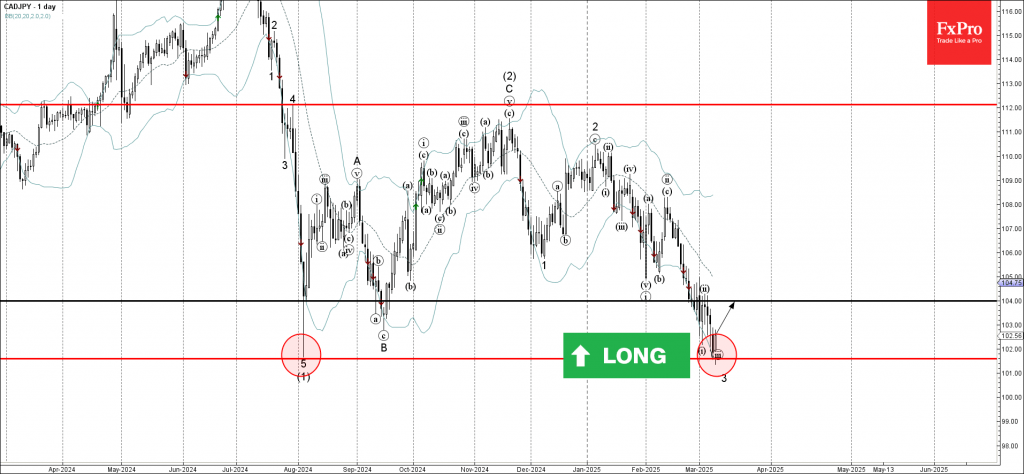
CADJPY: ⬆️ Buy
- CADJPY reversed from the support area
- Likely to rise to the resistance level 104.00
CADJPY currency pair recently reversed up from the support area between the major long-term support level 101.60 (former multi-month support from August) and the lower daily Bollinger Band.
The upward reversal from this support area will likely form the daily Japanese candlesticks reversal pattern Bullish Engulfing.
Given the strength of the support level 101.60, CADJPY currency pair can be expected to rise to the next resistance level 104.00 (former top of wave ii).
Key CPI Data: Impact on EURUSD and Fed
Fundamental Analysis
The EURUSD pair has recently surged, surpassing the 1.09 mark, driven by growing concerns of a US recession that have weakened the dollar. These fears intensified after Citigroup downgraded US stocks to neutral, citing bearish market signals. Additionally, uncertainty surrounding US trade policies—including new tariffs set to take effect on April 2—has caused market jitters on Wall Street and contributed to dollar volatility.
Meanwhile, the euro has strengthened, reaching its highest level since November, supported by a slight recovery in European markets and a shift in ECB President Christine Lagarde’s stance, highlighting the risks the European Union faces due to US trade policies.
Market attention is now focused on the US Consumer Price Index (CPI) data, set to be released tomorrow, March 12. February’s annual inflation rate is expected to slightly decline to 2.9% from January’s 3%, though it remains above the Federal Reserve’s 2% target. This report is crucial ahead of the Fed’s March 18–19 policy meeting, as persistently high inflation could limit the central bank’s ability to implement further stimulus amid growing economic concerns. Additionally, food prices have shown significant increases, with expectations of a 0.6% rise in February, which could influence monetary policy decisions. Investors will be closely monitoring this data to assess the future direction of the dollar and the EUR/USD pair.
Technical Analysis
EURUSD, H4
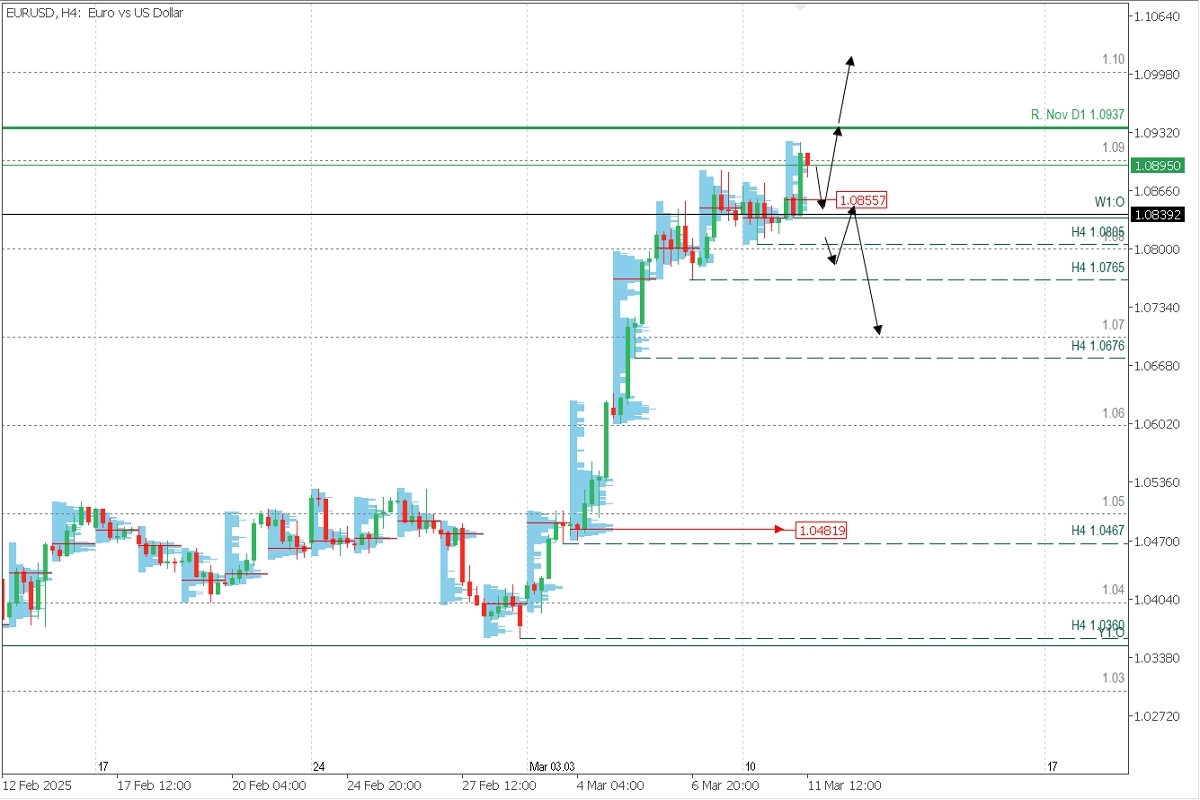
Supply Zones (Sell): 1.10
Demand Zones (Buy): 1.0855 / 1.0765 / 1.07
Price continues to rally past 1.09, activating 1.0805 as the last validated intraday support and forming a volume concentration around 1.0855. This level acts as a local demand zone, potentially triggering new buy orders to push the pair towards November’s resistance at 1.0937 and ultimately testing the key psychological level at 1.10.
This bullish scenario may gain traction if the upcoming CPI data confirms a decline. However, if inflation data surprises to the upside—exceeding market expectations—the price could fall towards the last validated intraday support at 1.0805. A confirmed break below this level would signal a trend reversal.
Technical Summary
Bullish Scenario: Buy positions above 1.0855 with targets at 1.09, 1.0940, 1.0950, and an extended move to 1.10.
Bearish Scenario: Sell positions below 1.10 as a correction towards 1.0950. Additionally, early sell signals if the price drops below 1.0950, extending declines to 1.08, with further downside potential towards 1.0765 and 1.07.
Discovered POC (Point of Control):
The POC is the price level with the highest volume concentration. If a previous bearish move originated from this zone, it acts as a resistance (sell zone). Conversely, if an upward impulse began there, it serves as a support (buy zone), typically located at lows.