
Sample Category Title
Dow Jones (DJIA), S&P 500 Under Pressure as Record Cash Levels Suggest More Downside Ahead
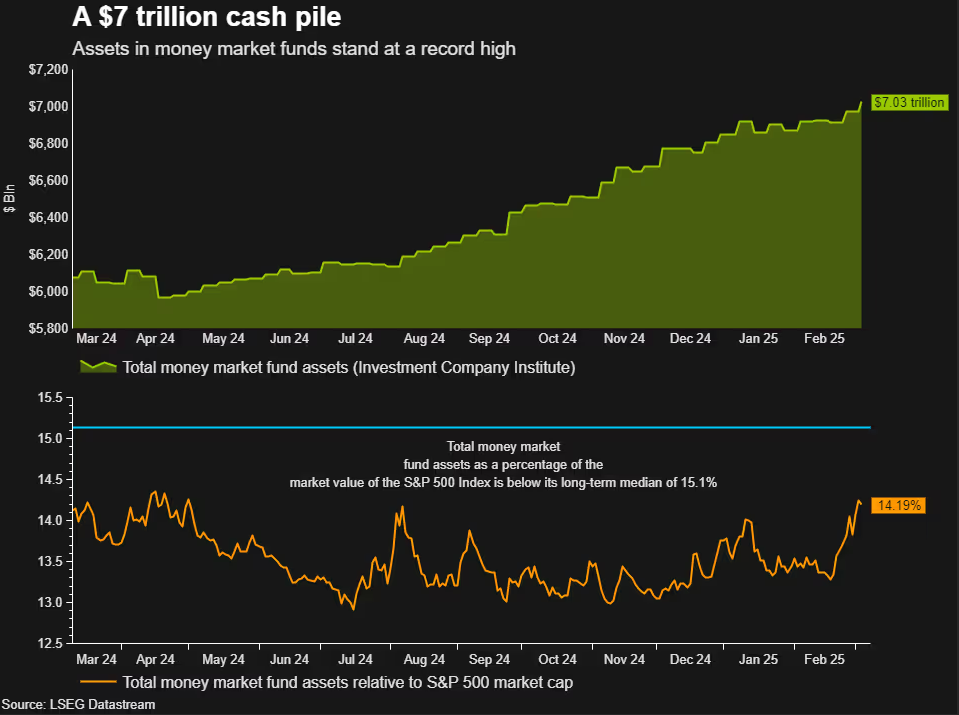
- Investors are holding record levels of cash ($7.3 trillion), indicating significant caution and potential for further market downside.
- Concerns about the Trump administration’s tariffs and policy uncertainty, including the threat of universal tariffs, are weighing on market sentiment.
- S&P 500 recorded its biggest one-day drop since December.
Wall Street Indexes have recovered overnight but investors remain cautious. This is evidenced by data from the Investment Company Institute. According to the data, cash levels are high with assets at money market funds at a record.
Cash levels climbed steadily last week, reaching a record high of $7.3 trillion, according to Peter Crane, president of Crane Data, a firm specializing in tracking market flows. This marks an increase from approximately $7.17 trillion at the start of 2025, Crane noted.
This could in part be why recent dips have not enjoyed significant bounces as they did in the past.
Source: LSEG
Markets have bounced somewhat this morning following yesterday which turned out to be the biggest one-day drop this year for Wall Street’s main Indexes. The S&P 500 had its biggest one-day drop since December 18 because of worries that the Trump administration’s tariffs might lead to a serious trade war.
The Nasdaq also saw its largest percentage drop since September 2022. It had already fallen 10% from its peak late last week.
Altogether, the market selloff wiped out $4 trillion in value from the S&P 500’s high point just a month ago.
The optimism around a Trump Presidency appears to be fading as the uncertainty of tariff policy is now starting to affect and dampen sentiment. The constant flip-flopping around policy has left market participants unconvinced and does not inspire confidence.
The threat of universal tariffs still in the pipeline for April has added to the uncertainty and increased bets of a recession. This is also weighing on sentiment.
All of these developments have led to the CBOE Volatility index closing at its highest level since August.
A snapshot of Market Performance paints a dour picture.
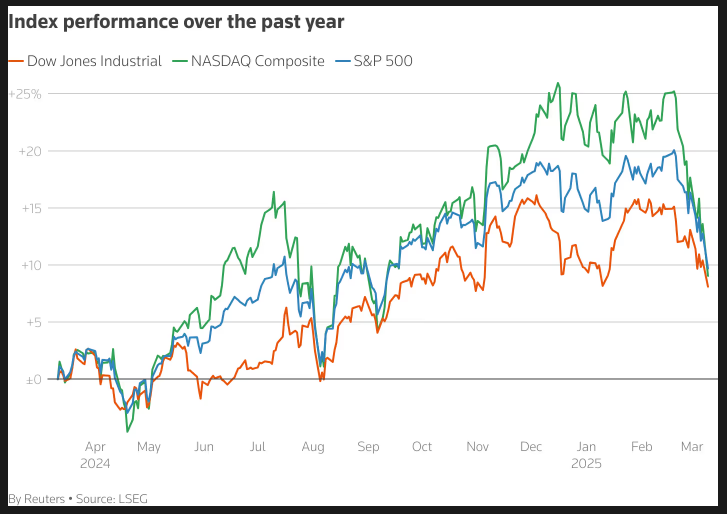
Source: LSEG (click to enlarge)
Adding to the gloomy outlook, Citi was the latest brokerage to change its view on U.S. stocks. It downgraded its recommendation from “overweight” to “neutral” while upgrading Chinese stocks to overweight.
US Data Ahead & Funding Bill in Focus
On the day front, focus will now shift to Jobs data with job opening and labor turnover survey due later in the day. Market participants will also be keeping a watch on Capitol Hill as voting begins for a funding bill to avoid a partial Federal Government Shutdown.
All of this comes ahead of the highly anticipated CPI release due tomorrow.
Overall sentiment does not seem all that bright moving forward with the potential for further losses growing.
Technical Analysis
Dow Jones
From a technical standpoint, the Dow Jones remains in a bearish trend and continues to break through crucial support levels.
Any attempted push higher has been met with significant selling pressure as dip buyers have not come to the fore. A sign of the current cautious approach we are seeing by market participants.
The Dow is trading at levels last seen in September 2024 after yesterdays 900-odd point move.
Gains from earlier in the day have now been wiped away as the Dow trades below support at the 42000 handle with the next level of support of resting at 41400 before the 41000 handle comes into focus.
Immediate resistance rests at 42000 before the 42446 and 42764 handles comes into focus.
The 14-day RSI is currently in oversold territory and thus a short-term bounce cannot be ruled out.
Dow Jones (US30) Daily Chart, March 11, 2025
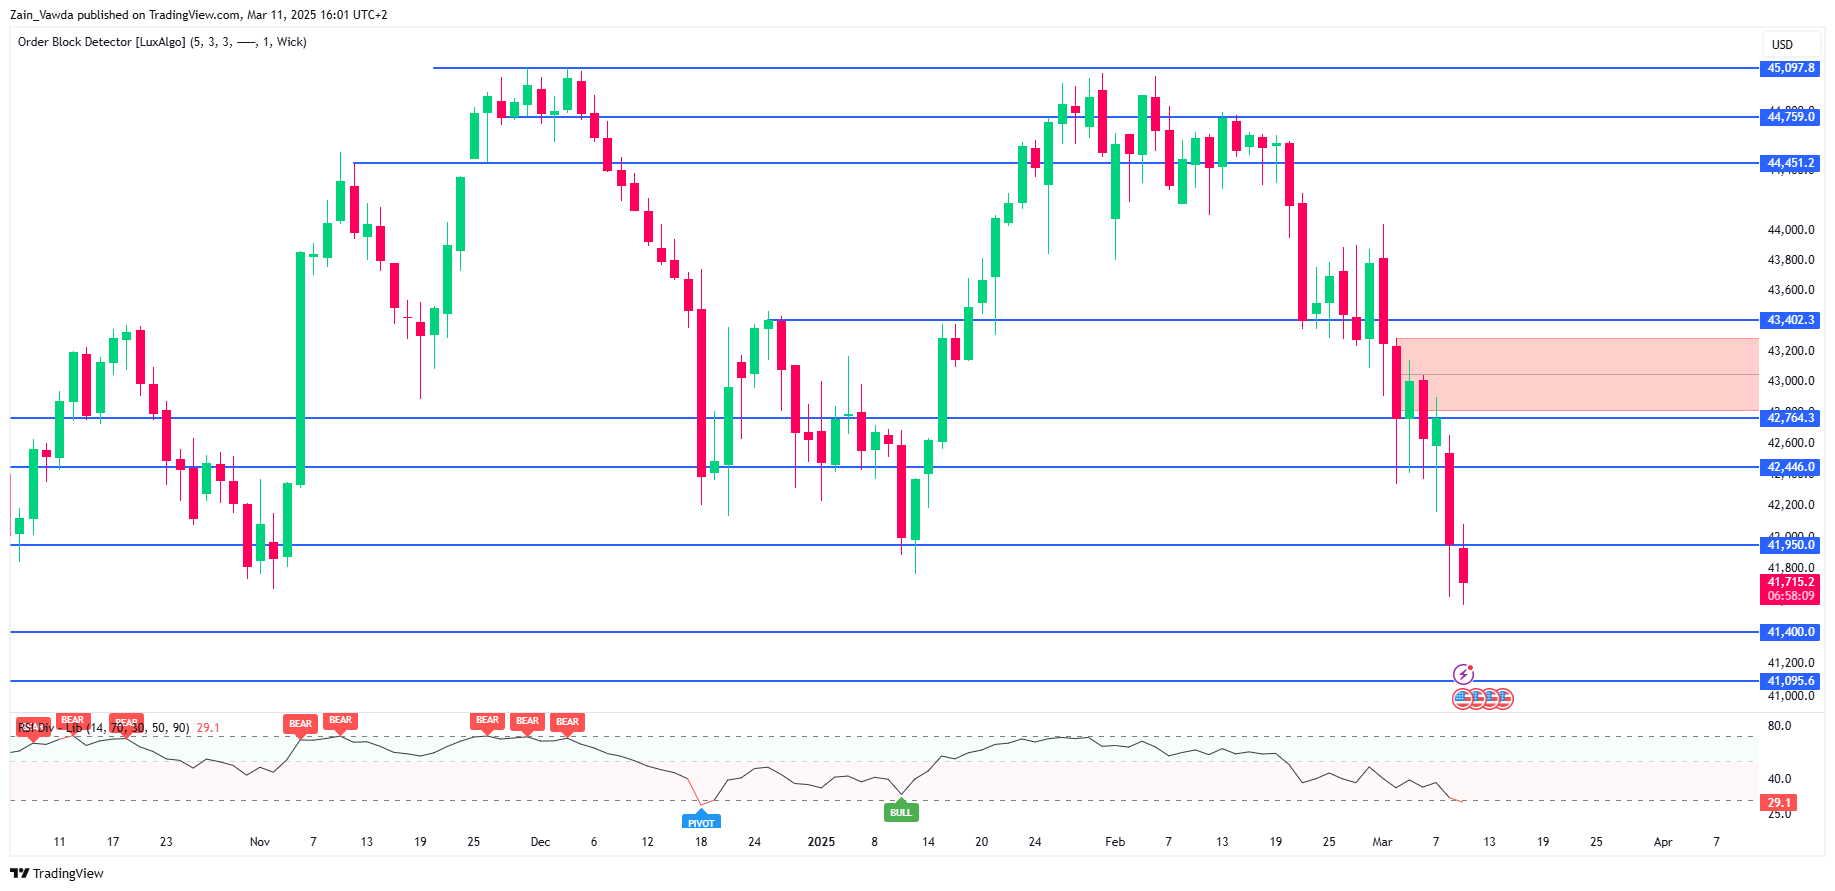
Source: TradingView (click to enlarge)
Support
- 41400
- 41000
- 40738
Resistance
- 42000
- 42446
- 43402
WTI Oil – Consolidation/Limited Correction to Precede Fresh Push Lower
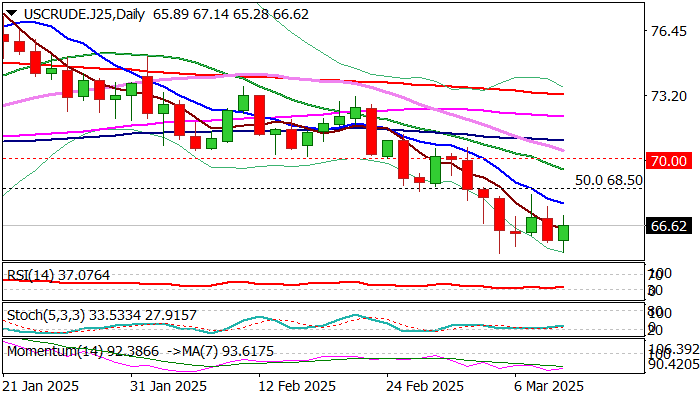
WTI oil price bounces on Tuesday following repeated downside rejection at key support at $65.26 (Sep 10 low), but recovery is likely to be limited, as larger picture is bearish and fundamentals predominantly negative.
Oil sentiment is firmly negative on growing concerns about the impact of tariffs on global economy, fears that the US economy is heading into recession and plans of OPEC + group to increase production in April.
Situation on daily chart points to firm bearish setup of technical studies, with triple recovery stall falling under 10DMA (daily candles with long upper shadows) contributing to negative scenario.
Near term action, however, may hold in prolonged consolidation above $65.26 support, which should be ideally capped by falling 10DMA ($67.75), but extended upticks (cannot be ruled out) to stay capped under psychological $70 barrier and mark healthy correction before larger bears regain full control.
Markets focus on releases of crude inventories reports (API and EIA) for fresh signals.
Res: 67.75; 68.20; 68.50; 69.44
Sup: 65.26; 65.00; 64.34; 63.63
Sunset Market Commentary
Markets
Bunds continued their underperformance vs US Treasuries as well as against swap. German rates add another 4 bps in a bear steepening move that’s still the result of last week’s dramatic fiscal policy U-turn. Its importance simply cannot be overstated and it’s unambiguously good news for Europe, European rates and the common currency. The German fiscal envelope (€500bn special fund, defense expenditures exempted from the debt brake and easier spending rules on a local & state level) is subject to approval by the Greens, which are needed to deliver the two-third majority. While they don’t agree to the proposal as it is in its current state, their opposition is not at all unsurmountable. If anything, we think it’ll only lead to an even bigger cheque that includes some green sweeteners. Its co-leader today in any case said she’s hopeful of a deal this week. The German 10-yr yield is on track for its highest close since 2023Q4. US yields trade 2 bps lower in whipsawed trading. They continue to look vulnerable at the downside. The euro remains in the driver’s seat. EUR/USD rallies to north of 1.09, the strongest level since November 2024. Barring some intermediate resistance levels around 1.0961 and 1.10, the road towards 1.1214 is wide open. The US dollar in any case won’t stop the common currency. The greenback remains in the defensive with local/US cyclical worries riding high. These get compounded by increasing talk of the US losing its exceptionalism status that catapulted the dollar towards the world’s reserve currency (and kept bond yields lower than they otherwise would be). The trade-weighted DXY index tanks to new YtD lows around 103.37 and is testing the November 2024 correction low in the process. EUR/USD’s 1.1214 mirror image in DXY is 100.157. The Japanese yen is taking a breather after a nice run over the last couple of days. USD/JPY tested the 148 area. US eco data was limited to JOLTS job openings, where a small January beat was offset by a similar-sized December downward revision. Small business optimism (NFIB) fell for a second month from it’s 5-yr high to 100.7 on concerns about inflation and uncertainty on tariffs and trade wards that’s leaving business owners in a wait-and-see mode. President Trump’s fresh announcement is a case in point. He’s doubling the steel and aluminum tariffs on Canadian steel to 50%, effective tomorrow, in a response to Canada’s levy on electricity exports to the US. The CAD loses ground and with Trump’s announcement dies a shy, unconvincing attempt by US equities (-0.9% to -1.4%) to find a bottom after yesterday’s knockout punch. European equity losses mount to 1.7%.
News & Views
Inflation in Hungary in February printed at 0.8% M/M and 5.6% Y/Y (1.5% M/M, 5.5% Y/Y in January), substantially outpacing expectations again. Food prices (1.2% M/M, 7.1%Y/Y) were a factor beyond the overall rise. However, the national bank of Hungary (MNB) analyses that most product groups were contributing to the rise in core and headline inflation. Core inflation rose 0.4% M/M and 6.2% Y/Y. Monthly changes were above historical averages. Inflation of sticky-price products and core inflation excluding processed foods stood at 5.8% Y/Y. Prices of tradeable goods increased 0.3% M/M and 2.4% Y/Y. Prices of market services also showed a strong upward dynamic (0.9% M/M, 9.9% Y/Y). The MNB adds that households’ inflation expectations remain high. Corporate expectations also confirm an upward trend since October. Mihaly Varga, who became MNB governor last week, already indicated that there was no room to ease the policy rate (currently 6.5%) in the near future. The 2-y swap yield jumped 7 bps (6.44%). Prime Minister Orban said the government will cap profit margins of retailers on 30 basic food products to 10% from mid-March to end May. The forint weakened to EUR/HUF 400 after testing the 398 area yesterday.
In its quarterly economic report on the Spanish economy, the Bank of Spain today upwardly revised its expectations for both 2025 economic growth and inflation. GDP growth expectations were raised from 2.5% in December to 2.7%. Aside from a positive overhang from last year, the Bank of Spain sees the outlook for household income now being better than in December, which could have a positive effect on consumption. Inflation is revised by 0.4 pp compared to 2.5%. While substantial, this upward revision is mainly due to expected higher energy costs. The bank sees risks slightly skewed to the upside. It keeps a close eye on domestic inflationary pressures.
USD/CAD Mid-Day Outlook
Daily Pivots: (S1) 1.4370; (P) 1.4422; (R1) 1.4490; More...
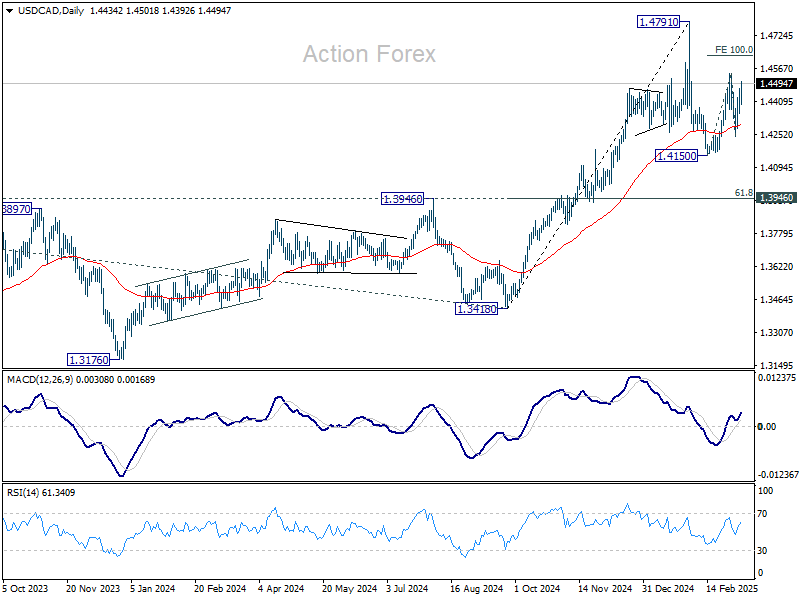
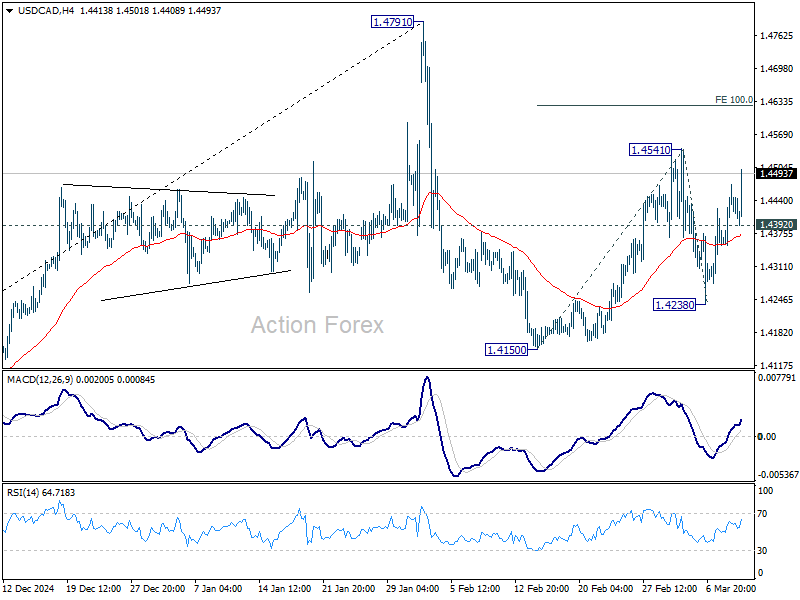
USD/CAD's current upside acceleration argues that rise from 1.4150 is already the second leg of the corrective pattern 1.4791 high. Break of 1.4541 will target 100% projection of 1.4150 to 1.4541 from 1.4238 at 1.4629 and above. But for now, strong resistance is expected from 1.4791 to limit upside to bring the third leg. Meanwhile, below 1.4392 will turn bias to the downside for 1.4238 support.

In the bigger picture, long term up trend is tentatively seen as resuming with prior breach of 1.4667/89 key resistance zone (2020/2015 highs). Next target is 100% projection of 1.2401 to 1.3976 from 1.3418 at 1.4993. This will remain the favored case as long as 1.3976 resistance turned support holds (2022 high), even in case of deep pullback.
Loonie falls as Trump raises tariffs on Canadian metals to 50%, threatens auto industry next
Canadian Dollar tumbled broadly after US President Donald Trump announced a significant tariff escalation on Canadian steel and aluminum imports.
In a Truth Social post, Trump said he instructed the Commerce Secretary to impose an additional 25% tariff on these products, raising the total tariff to 50%.
The new measure, set to take effect Wednesday morning, is being framed as a response to Ontario’s 25% tariff on electricity exports to the US.
Trump also demanded that Canada immediately eliminate its long-standing tariffs of 250% to 390% on various US dairy products, calling them "outrageous."
The tariff threat didn't stop there. Trump warned that if Canada does not remove other tariffs he deems excessive, the US will "substantially increase" tariffs on Canadian automobile imports starting April 2nd.
Overall outlook in USD/CAD is unchanged that it's still extending the corrective pattern from 1.4791 high. But current upside acceleration argues that rise from 1.4150 might be the second leg of the pattern. Break of 1.4541 will target 100% projection of 1.4150 to 1.4541 from 1.4238 at 1.4629 and above. Neverthless, break of 1.4392 minor support will bring deeper fall back to 1.4238 and below.
EUR/USD Mid-Day Outlook
Daily Pivots: (S1) 1.0802; (P) 1.0839; (R1) 1.0872; More...
EUR/USD's rally resumed after brief consolidations and intraday bias is back on the upside. Firm break of 161.8% projection of 1.0176 to 1.0531 from 1.0358 at 1.0932 will pave the way back to 1.1274 key resistance next. On the downside, below 1.0804 support will turn intraday bias neutral again.
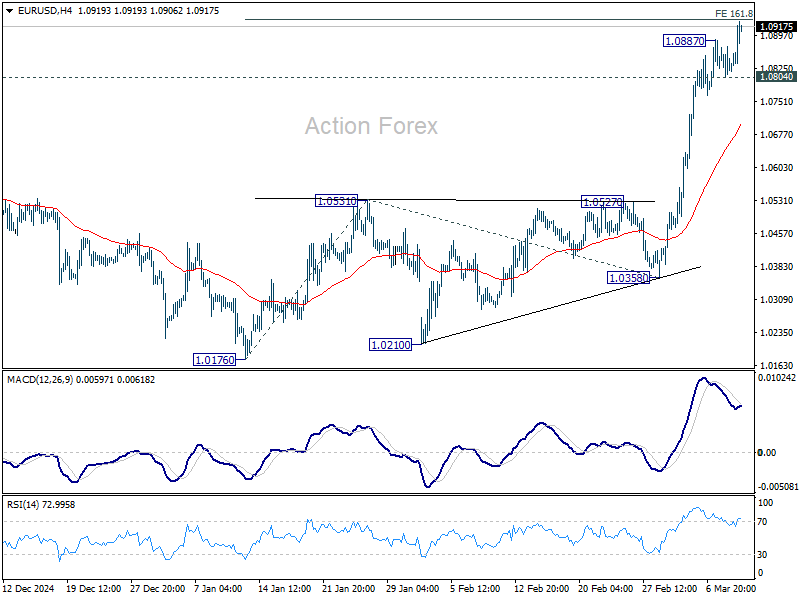
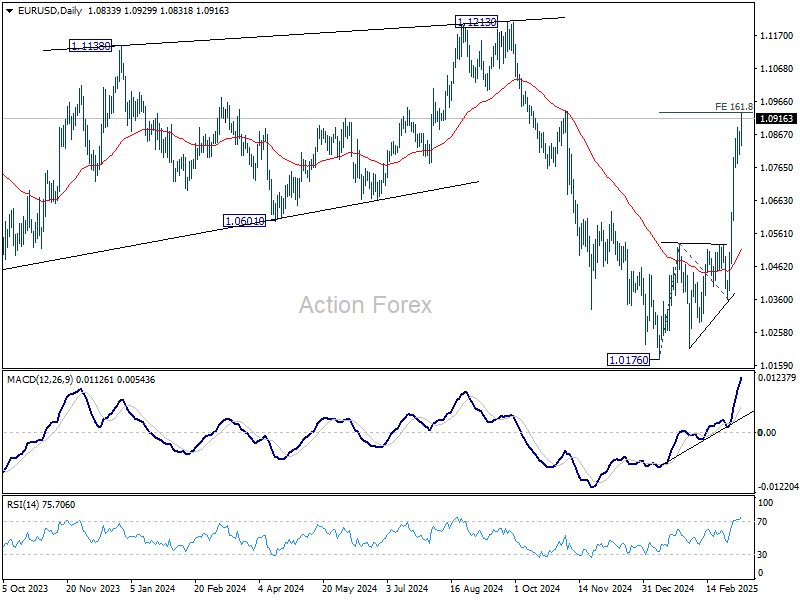
In the bigger picture, the strong break of 55 W EMA (now at 1.0675) suggests that fall from 1.1274 (2024 high) has completed as a three wave correction to 1.0176. Rise from 0.9534 is still intact, and might be ready to resume. Decisive break of 1.1274 will target 100% projection of 0.9534 to 1.1274 from 1.0176 at 1.1916. Also, that will send EUR/USD through a multi-decade channel resistance will carries larger bullish implication. This will now be the favored case as long as 1.0531 resistance turned support holds.
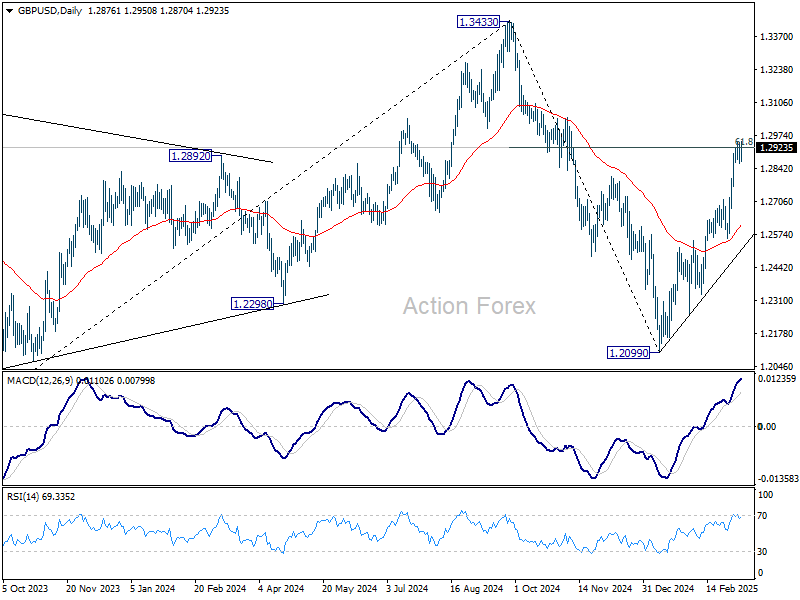
GBP/USD Mid-Day Outlook
Daily Pivots: (S1) 1.2843; (P) 1.2895; (R1) 1.2928; More...
Intraday bias in GBP/USD remains neutral first and some more consolidations might be seen. Downside of retreat should be contained by 1.2715 resistance turned support to bring another rally. On the upside, sustained break of 61.8% retracement of 1.3433 to 1.2099 at 1.2923 will pave the way back to 1.3433 high.
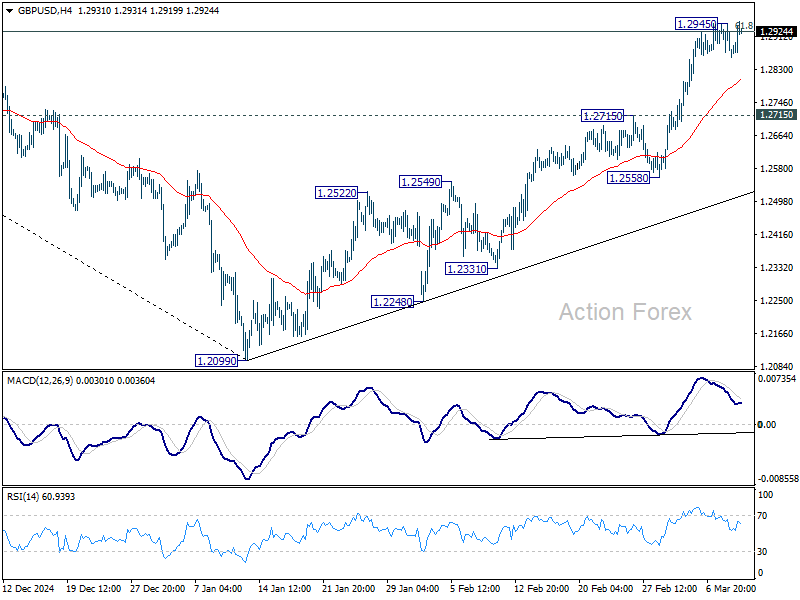
In the bigger picture, fall from 1.3433 (2024 high) should have completed at 1.2099 as a corrective move. Up trend from 1.3051 (2022 low) is still in progress but it's too early to say that it's resuming. Corrective pattern from 1.3433 could extend with one more down leg. But after all, eventual upside breakout is expected at a later stage.
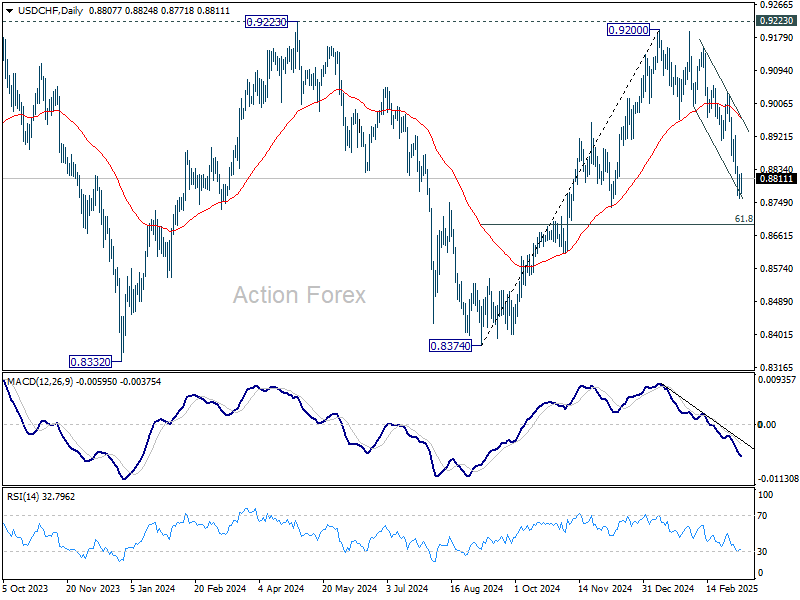
USD/CHF Mid-Day Outlook
Daily Pivots: (S1) 0.8770; (P) 0.8796; (R1) 0.8834; More…
Intraday bias in USD/CHF remains neutral for consolidations above 0.8757 temporary low. Upside should be limited by 0.8911 support turned resistance to bring another fall. On the downside, below 0.8757 will target 61.8% retracement of 0.8374 to 0.9200 at 0.8690. Sustained break there will pave the way back to 0.8374 support.
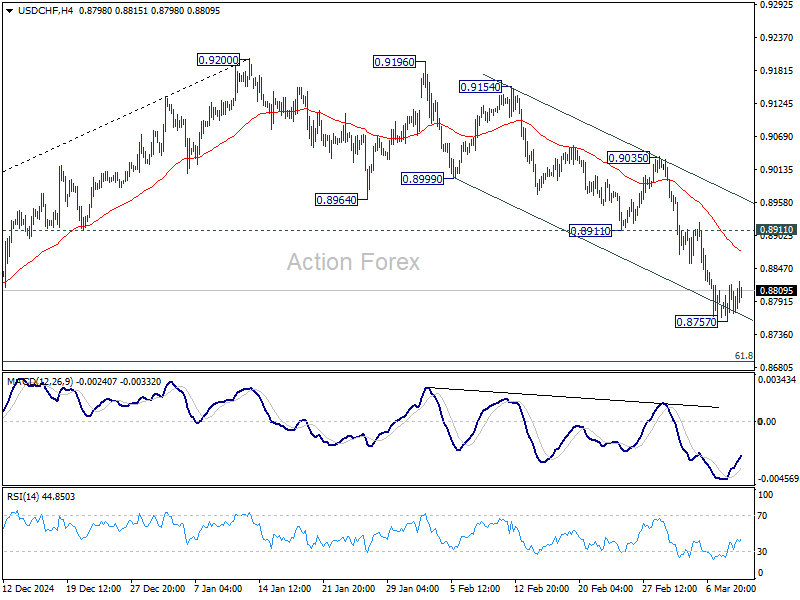
In the bigger picture, rejection by 0.9223 key resistance keep medium term outlook bearish. That is, larger fall from 1.0342 (2017 high) is not completed yet. Firm break of 0.8332 (2023 low) will confirm down trend resumption.
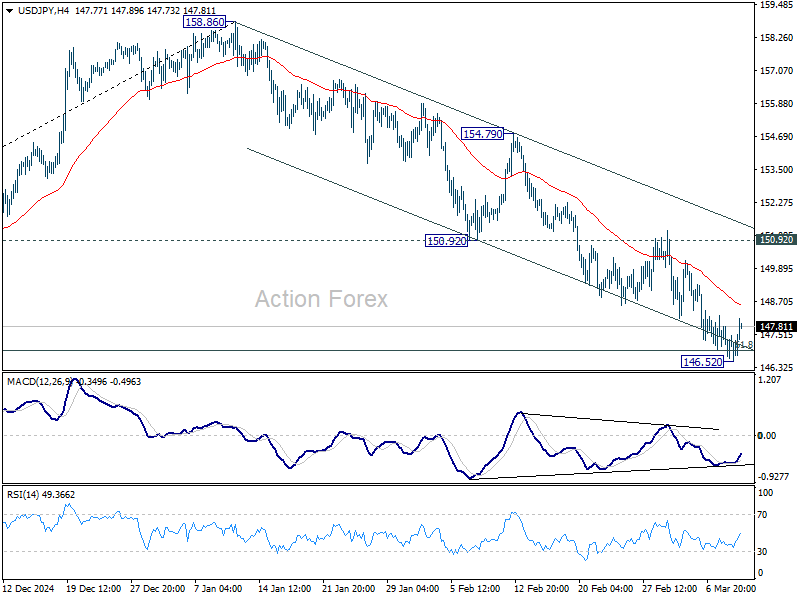
USD/JPY Mid-Day Outlook
Daily Pivots: (S1) 146.59; (P) 147.30; (R1) 147.97; More...
Intraday bias in USD/JPY is turned neutral with current recovery. Some consolidations would be seen above 146.52 temporary low first. But upside of recovery should be limited by 150.92 support turned resistance. On the downside, sustained trading below 61.8% retracement of 139.57 to 158.86 at 146.32 will pave the way to 139.57 support.
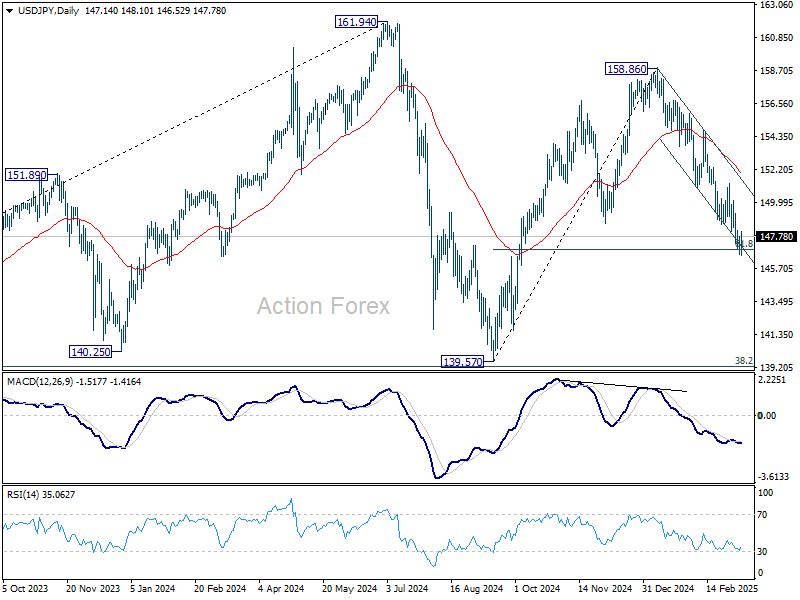
In the bigger picture, price actions from 161.94 are seen as a corrective pattern to rise from 102.58 (2021 low), with fall from 158.86 as the third leg. Strong support should be seen from 38.2% retracement of 102.58 to 161.94 at 139.26 to bring rebound. However, sustained break of 139.26 would open up deeper medium term decline to 61.8% retracement at 125.25.
US: Small Business Optimism Index fell for second consecutive month in February
The NFIB's Small Business Optimism Index fell 2.1 points to 100.7 in February, coming in slightly below market expectations.
Seven out of ten subcomponents deteriorated on the month. The largest declines came from expectations about an improvement in the economy (-10 points to 37%), the belief that now is a good time to expand (-5 points to 12%), and expectations regarding higher 'real' sales (-6 points to 14%).
The net share of businesses planning to increase employment fell 3 points to 15%. On the other hand, the share of firms with unfilled job openings rose 3 points to 38%. Quality of labor concerns rose one point in February, with 19% of business owners identifying this as their top business problem. In contrast to other surveys, inflation concerns fell 2 points to 16%.
The net share of firms currently increasing employee compensation held flat at 33%, while the net share 'planning' to do so over the next three months continued to trend lower falling 2 points to 18%. However, the share of businesses raising average selling prices surged 10 points to 32%, while the share of those 'planning' to raise average selling prices ahead rose 3 points to 29%. The uncertainty subindex also rose 4 points to 104 – the second highest reading on record.
Key Implications
Small business optimism continued to moderate in October, falling to a four-month low. This as elevated uncertainty weighed on the belief that 'now is a good time to expand' and took a toll on expectations about an improvement in sales and the economy. On a more positive note, the labor market indicators held up somewhat better. The fact that 'quality of labor' concerns remain top of mind, indicates that small businesses are still focused on growing their business as opposed to cutting expenses.
With trade conflicts reigniting in March, the level of uncertainty has the potential to rise even higher. This would weigh on overall small business confidence, and is likely to manifest itself in weaker investment and hiring decisions. Additionally, the rise of input costs from tariffs and counter-tariffs may impact pricing plans, with today's survey carrying some evidence of rising price pressures. The Fed will have to weigh these competing forces carefully as it considers adjusting monetary policy. For the time being, we expect the Fed to remain on hold, but come summer we could see chair Powell taking out the interest rate scissors.