Sample Category Title
GBP/JPY Daily Outlook
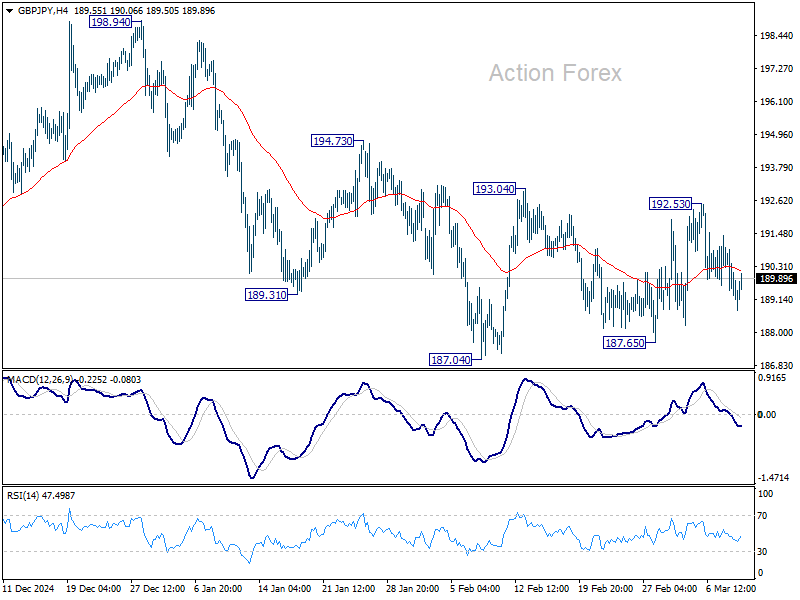
Daily Pivots: (S1) 188.82; (P) 190.02; (R1) 190.84; More...
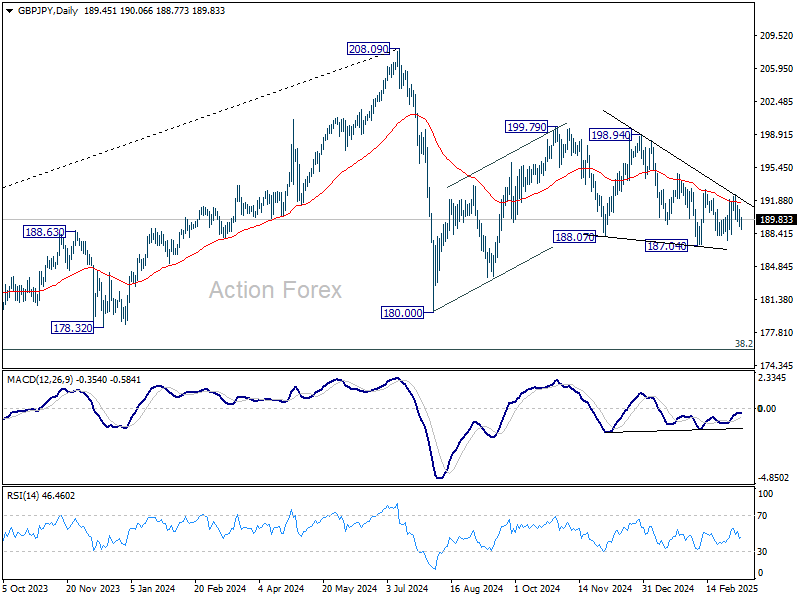
GBP/JPY is still bounded in range trading and intraday bias stays neutral. On the upside, firm break of 193.04 will resume the rebound from 187.04 to 194.73 resistance, and then 198.94. On the downside, firm break of 187.04 will extend the fall from 199.79 towards 180.00 support. Overall, corrective pattern from 180.00 might still be extending.
In the bigger picture, price actions from 208.09 are seen as a correction to rally from 123.94 (2020 low). Strong support should be seen from 38.2% retracement of 123.94 to 208.09 at 175.94 to contain downside. However, sustained break of 152.11 will bring deeper fall even still as a correction.
EUR/JPY Daily Outlook
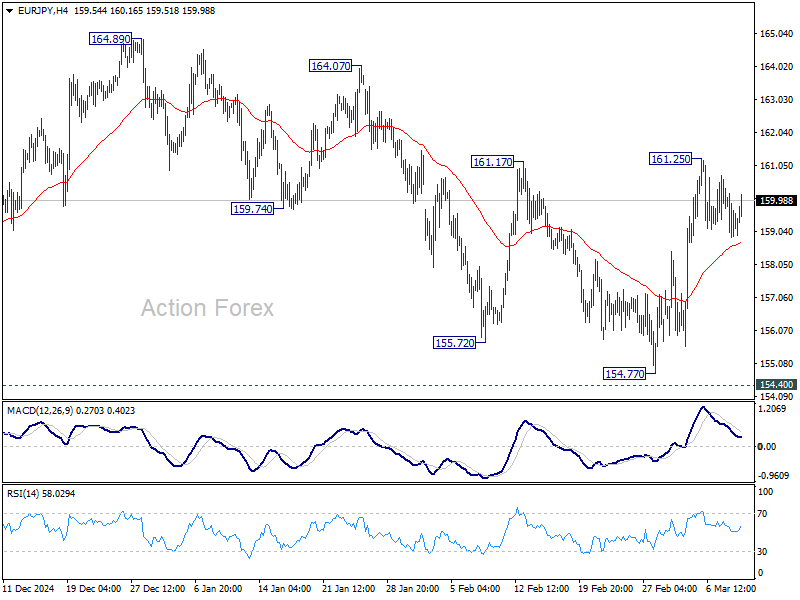
Daily Pivots: (S1) 158.86; (P) 159.62; (R1) 160.35; More...
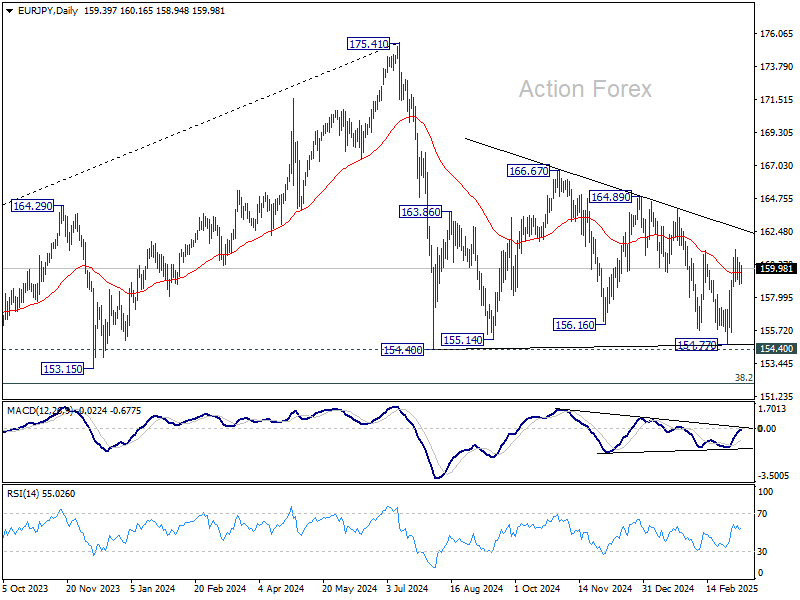
Intraday bias in EUR/JPY remains neutral at this point. Overall development suggests that consolidation pattern from 154.40 is extending with another rising leg. On the upside, break of 161.25 will target 164.89 resistance.
In the bigger picture, price actions from 175.41 are seen as correction to rally from 114.42 (2020 low). Strong support should be seen from 38.2% retracement of 114.42 to 175.41 at 152.11 to contain downside. However, sustained break of 152.11 will bring deeper fall even still as a correction.
EUR/GBP Daily Outlook
Daily Pivots: (S1) 0.8389; (P) 0.8403; (R1) 0.8428; More...
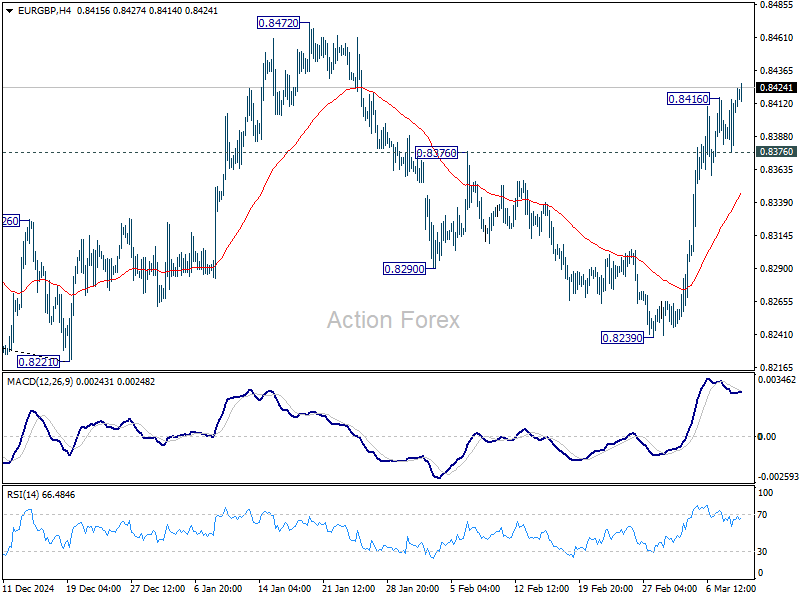
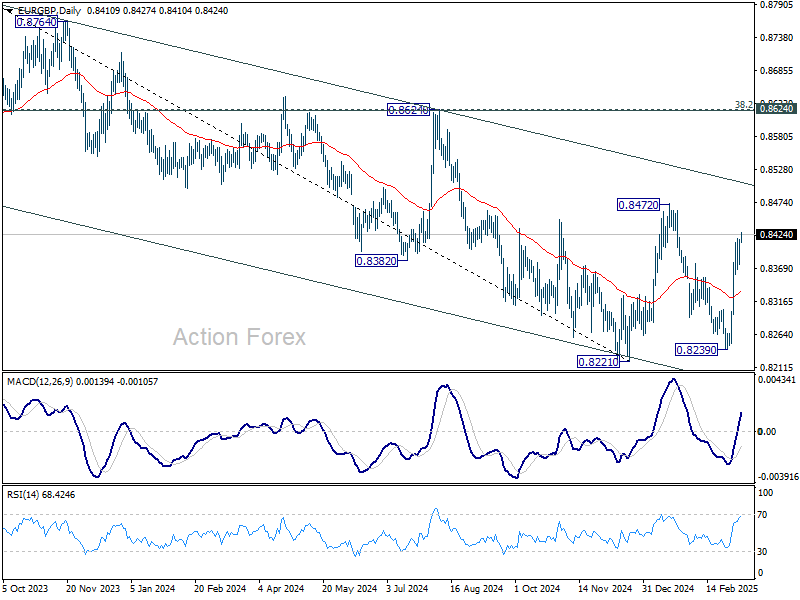
EUR/GBP's rally resumed after brief consolidations and intraday bias is back on the upside. Current rise from 0.8239 should target 0.8472 resistance next. On the downside, below 0.8376 will turn bias neutral and bring consolidations again.
In the bigger picture, EUR/GBP is still bounded inside medium term falling channel. While rebound from 0.8221 might extend higher, it could still develop into a corrective pattern. Overall outlook will be neutral at best and down trend from 0.9267 (2022 high) could extend, at least until decisive break of channel resistance (now at 0.8511).
EUR/AUD Daily Outlook
Daily Pivots: (S1) 1.7149; (P) 1.7213; (R1) 1.7320; More...
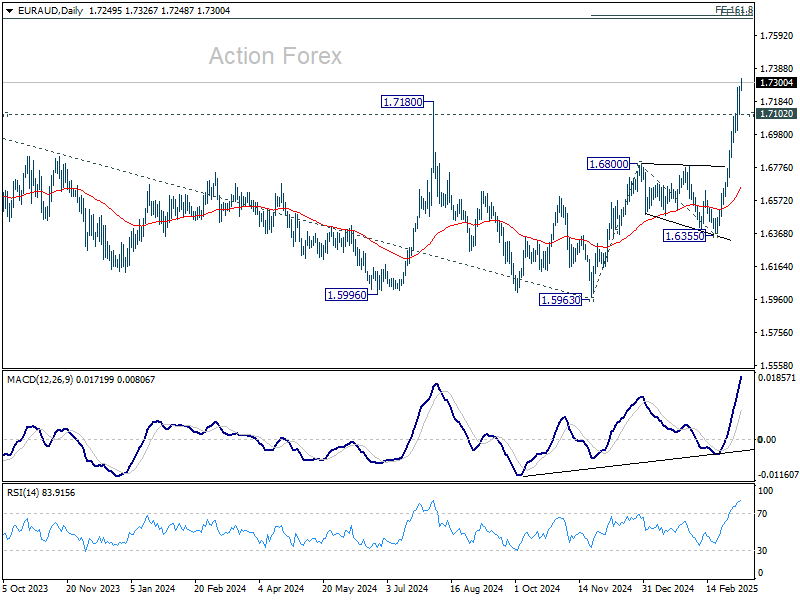
EUR/AUD's rally resumed and brief consolidations and intraday is back on the upside. Rise from 1.6335 should now target 161.8% projection of 1.5963 to 1.6800 from 1.6355 at 1.7709 next. On the downside, below 1.7102 minor support will turn intraday bias neutral again and bring consolidations, before staging another rally.
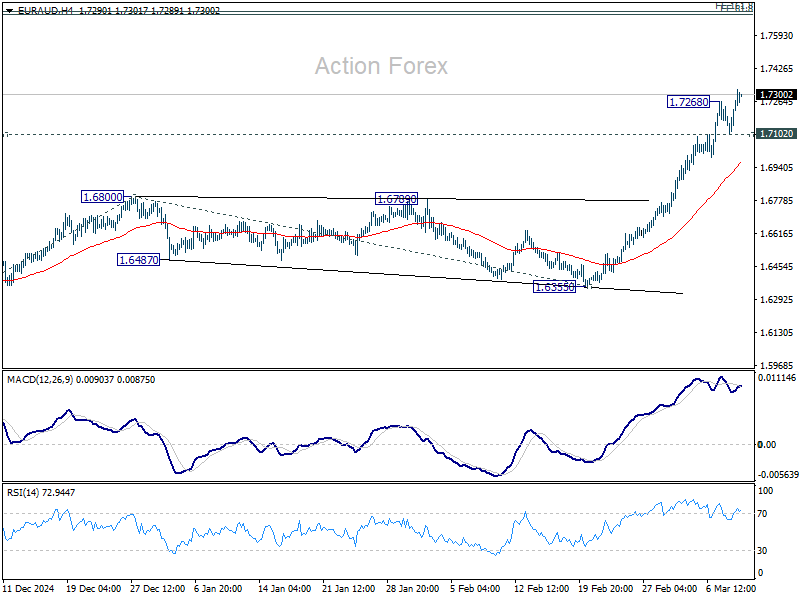
In the bigger picture, up trend from 1.4281 (2022 low) is resuming. Sustained trading above 1.7180 key resistance will pave the way to 61.8% projection of 1.4281 to 1.7062 from 1.5963 at 1.7682, which is also close to 61.8% retracement of 1.9799 (2020 high) to 1.4281 at 1.7691. For now, this will remain the favored case as long as 1.6355 support holds, even in case of deep pullback.
Recession Fears Weigh on Markets as Risk-Off Trade Intensifies
The risk-off sentiment that triggered the biggest US stock market selloff in months has spilled over into Asian markets, leading to broad declines across the region. The currency markets reflect this shift too, with traditional safe havens such as Japanese Yen and Swiss franc leading gains in Asia, while risk-sensitive currencies like the Australian and New Zealand Dollars face pressure.
Unlike previous bouts of risk aversion, Dollar is not benefiting from the current flight to safety. This time, the core of the problem originates from the US economy itself, where recession worries are intensifying. Rather than flocking to the greenback, investors appear to be diversifying into other safe havens or moving to the sidelines until the dust settles.
The uncertainty surrounding US trade policies has left businesses and consumers hesitant, potentially dragging economic growth lower. In response to the changing economic outlook, market participants are increasingly convinced that Fed will resume policy easing within the first half of the year. The only question is whether the next rate cut will arrive in May or June.
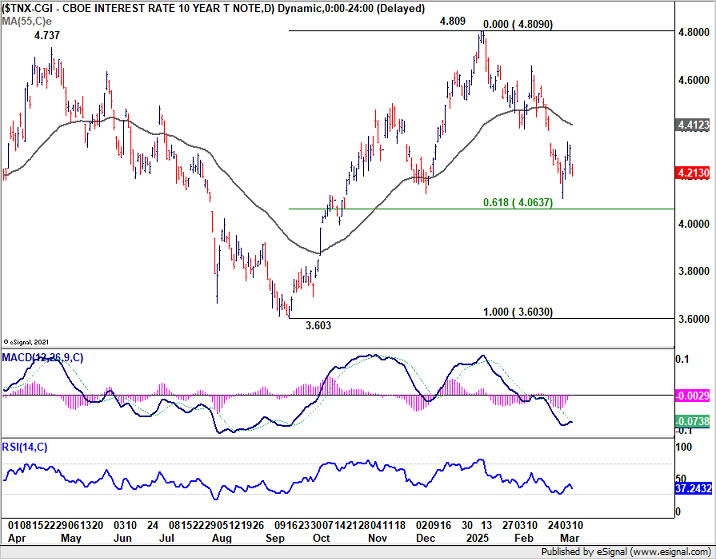
Another driver of Dollar weakness is the extending decline in yields since mid January. Technically, there is prospect for 10-year yield to draw support from 4.000 psychological level, which is slightly below 61.8% retracement of 3.603 to 4.809 at 4.063, to form a near term bottom. However, there is little prospect for 10-year yield to rebound strongly through 55 D EMA (now at 4.412). But at least, sideway movement in 10-year yield could help lift the pressure on Dollar.
Overall for the week so far, Yen is the best performer, followed by Euro, and then Swiss Franc. Aussie is the worst, followed by Loonie and then Kiwi. Dollar and Sterling are positioning in the middle.
In Asia, at the time of writing, Nikkei is down -1.02%. Hong Kong HSI is down -1.02%. China Shanghai SSE is down -0.50%. Singapore Strait Times is down -2.02%. Japan 10-year JGB yield is down -0.063 at 1.509. Overnight, DOW fell -2.08%. S&P 500 fell -2.70%. NASDAQ fell -4.00%. 10-year yield fell -0.104 to 4.213.
US stock market correction deepens as recession fears take hold
The US stock market suffered its most significant setback in months, with the S&P 500 dropping -2.7%, its biggest one-day decline since December 18. NASDAQ also lost -4.0%, marking its worst single-day percentage loss since September 2022. Analysts widely point to mounting recession worries as the primary catalyst behind the selloff.
Initial concerns emerged over the past month following a series of weaker economic data points, believed by some to be early reactions to an increasingly contentious tariff policy. These worries intensified after recent remarks from the White House suggested a bumpy economic outlook ahead.
In an interview aired on Sunday, US President Donald Trump fueled apprehensions further by describing the economy as going through “a period of transition.” When pressed about an impending recession, he avoided a direct prediction but acknowledged potential “disruption.” His remarks—“Look, we’re going to have disruption, but we’re OK with that”—did little to reassure investors already on edge about growth prospects.
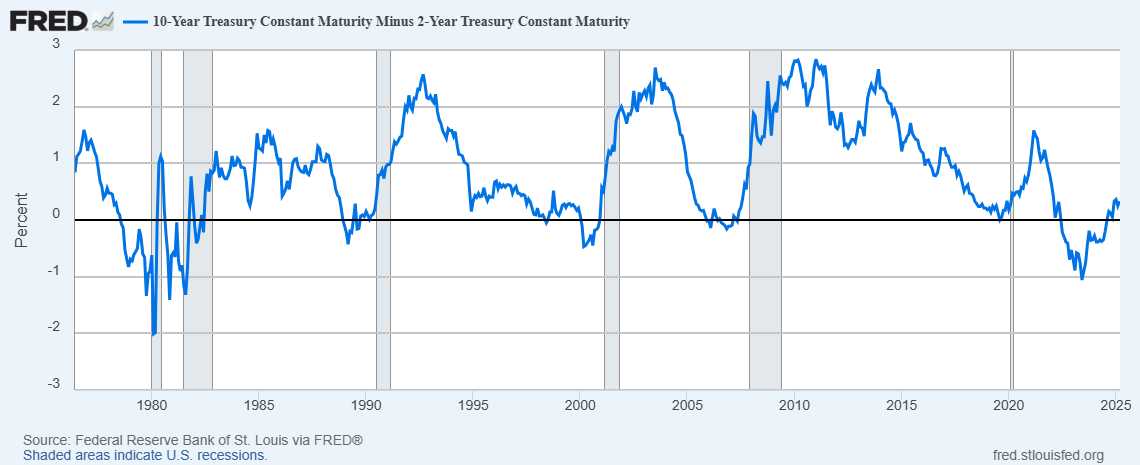
Adding further weight to recession fears, historical bond market indicators have been flashing warning signs. The 10-year to 2-year US yield curve inverted in mid-2022—a classic recession signal—and only turned positive again in September 2024. Historically, a U.S. recession tends to follow within months after the yield curve normalizes (i.e., turned positive again). If this trend holds true, the US economy could be inching closer to a downturn.
However, another view posits that tariffs are a distraction and that the real driver behind the US selloff is the recent surge in Japanese government bond yields, which have hit a 16-year high. As the carry trade unwinds—where investors borrow in low-yield currencies, often involving Japanese Yen, to fund investments in higher-yield or high-growth assets—capital is flowing out of big tech names, contributing to the NASDAQ’s outsized losses.
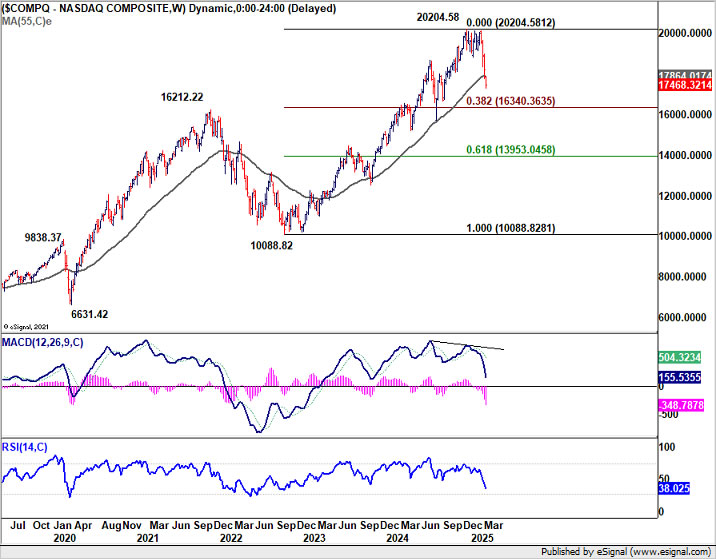
Technically, NASDAQ's strong break of 55 W EMA (now at 17864.01) suggests that it's already in correction to the up trend from 10088.82 (2022 low). Deeper fall should be seen to 38.2% retracement of 10088.82 to 20204.58 at 16340.36. Reaction from there will decide whether it's merely in a medium consolidations phase or in an out-right bearish trend reversal.
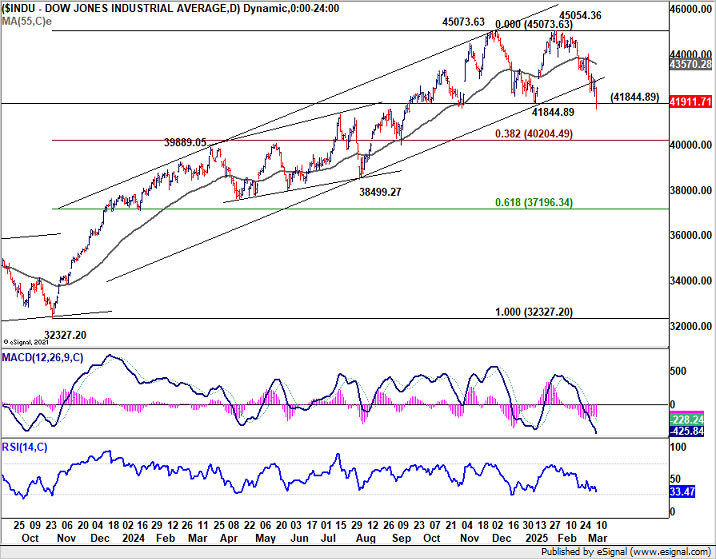
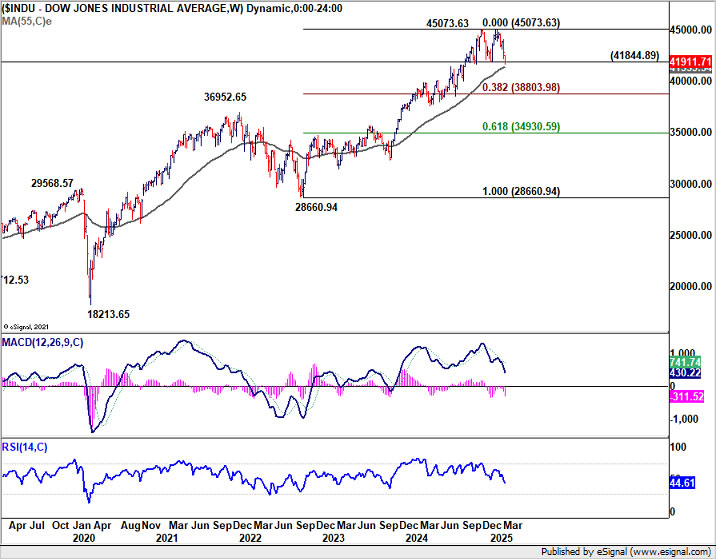
As for DOW, immediate focus is now on 41844.89 support. Firm break there will complete a double top reversal pattern (45073.63, 45054.36). That should set up deeper fall to 38.2% retracement of 32327.20 to 45073.63 at 40204.49 at least, even it's just a correction to the rise from 32327.20.
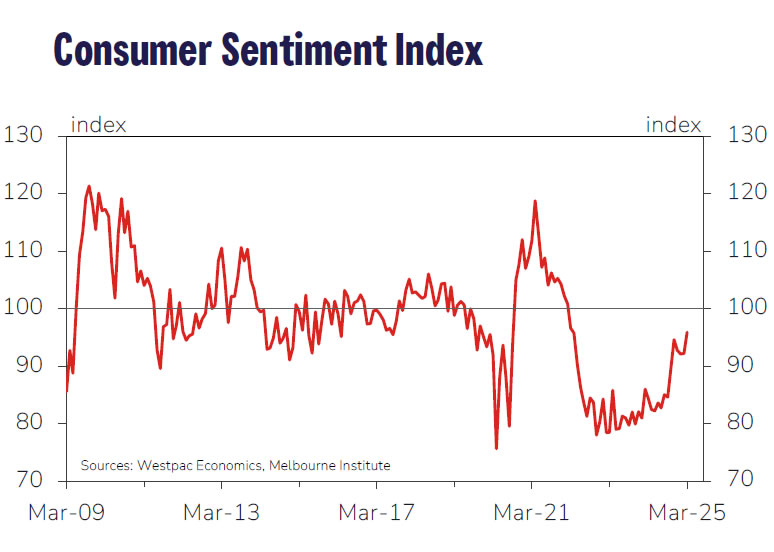
Australia Westpac consumer sentiment jumps to 95.9, soft landing achieved
Australian consumer sentiment saw a strong rebound in March, with Westpac Consumer Sentiment Index jumping 4.0% mom to 95.9, the highest level in three years and not far from neutral 100 mark.
Westpac attributed the improvement to slowing inflation and February’s RBA interest rate cut which have lifted confidence across households. positive views on job security suggest that "soft landing has been achieved". Nevertheless, "unsettling overseas news" continues to weigh on the broader economic outlook.
Looking ahead to RBA's upcoming meeting on March 31-April 1, Westpac expects the central bank to keep the cash rate unchanged. RBA was clear that the 25bps cut in February "did not mean further reductions could be expected at subsequent meetings."
Westpac added, "further slowing in inflation will give the RBA sufficient confidence to deliver more rate cuts this year with the next move coming at the May meeting".
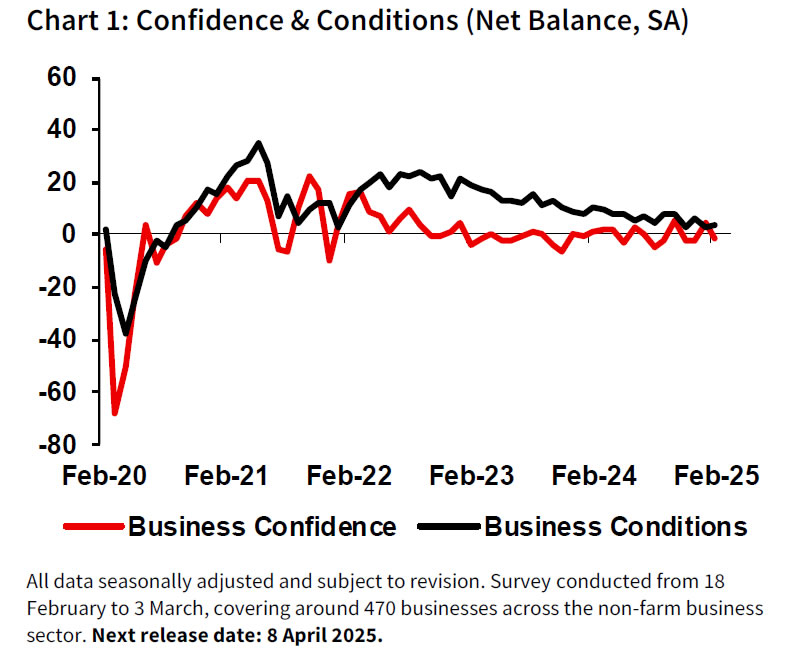
Australia’s NAB business confidence slips back into negative as cost pressures persist
Australia’s NAB Business Confidence fell from 5 to -1 in February, erasing last month’s gain and returning to below-average levels. While business conditions improved slightly from 3 to 4, the decline in confidence suggests that businesses remain cautious despite RBA’s recent rate cut and positive Q4 GDP data.
NAB Chief Economist Alan Oster noted that the lift in sentiment seen in January was not sustained, signaling ongoing uncertainty in the business environment. Persistent cost pressures and subdued profitability appear to be key factors weighing on sentiment, keeping confidence below long-term norms.
Within business conditions, trading conditions ticked up from 7 to 8, and profitability conditions rose slightly from -2 to -1, though still remaining in negative territory. Employment conditions, however, weakened from 5 to 4.
Cost pressures remain a concern, with purchase cost growth accelerating from 1.1% to 1.5% in quarterly equivalent terms. On the positive side, labor cost growth eased from 1.7% to 1.5%, indicating that wage price pressures are gradually cooling. Meanwhile, final product price growth slowed from 0.8% to 0.5%, though retail price inflation held steady at 1.0%.
EUR/AUD Daily Outlook
Daily Pivots: (S1) 1.7149; (P) 1.7213; (R1) 1.7320; More...
EUR/AUD's rally resumed and brief consolidations and intraday is back on the upside. Rise from 1.6335 should now target 161.8% projection of 1.5963 to 1.6800 from 1.6355 at 1.7709 next. On the downside, below 1.7102 minor support will turn intraday bias neutral again and bring consolidations, before staging another rally.
In the bigger picture, up trend from 1.4281 (2022 low) is resuming. Sustained trading above 1.7180 key resistance will pave the way to 61.8% projection of 1.4281 to 1.7062 from 1.5963 at 1.7682, which is also close to 61.8% retracement of 1.9799 (2020 high) to 1.4281 at 1.7691. For now, this will remain the favored case as long as 1.6355 support holds, even in case of deep pullback.
Elliott Wave View: Silver (XAGUSD) Pullback Looking to Find Support
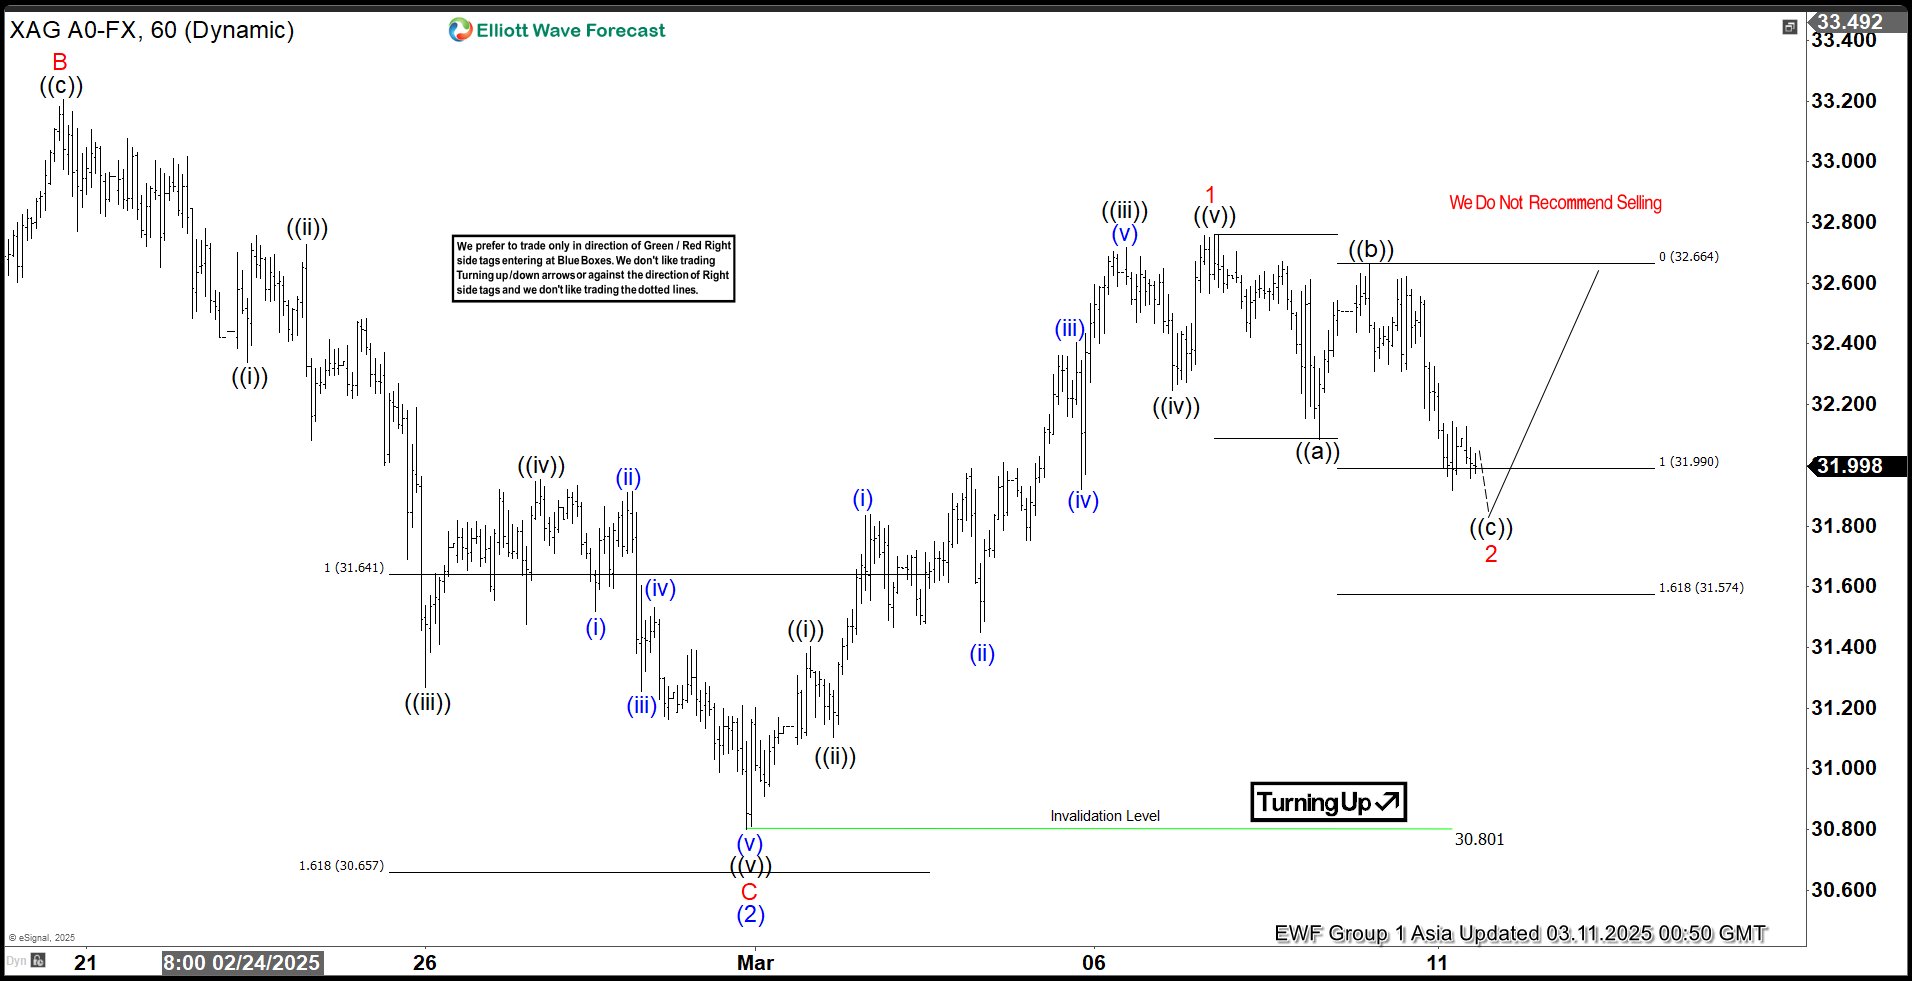
Short Term Elliott Wave View in Silver (XAGUSD) suggests cycle from 12.19.2024 low is in progress as 5 waves. Up from 12.19.2024 low, wave (1) ended at 33.39. Wave (2) pullback unfolded as a zigzag Elliott Wave structure. Down from wave (1) at 33.39, wave A ended at 31.88 and wave B ended at 33.2 as the 1 hour chart below shows. Wave C lower subdivided into 5 waves impulse. Down from wave B, wave ((i)) ended at 32.34 and wave ((ii)) ended at 32.73. Wave ((iii)) lower ended at 31.26 and wave ((iv)) ended at 31.95. Final leg wave ((v)) ended at 30.8 which completed wave C of (2).
The metal has turned higher in wave (3). Up from wave (2), wave ((i)) ended at 31.4 and wave ((ii)) ended at 31.1. Wave ((iii)) higher ended at 32.72 and pullback in wave ((iv)) ended at 32.24. Final leg wave ((v)) ended at 32.76 which completed wave 1 in higher degree. Pullback in wave 2 is in progress to correct cycle from 2.28.2025 low before it resumes higher. Down from wave 1, wave ((a)) ended at 32.08 and wave ((b)) ended at 32.66. Expect wave ((c)) of 2 to end above 30.8 invalidation level for the next leg higher. As far as pivot at 30.8 low stays intact, expect pullback to find support in 3, 7, 11 swing for more upside.
Silver (XAGUSD) 60 Minutes Elliott Wave Chart
XAGUSD Video
https://www.youtube.com/watch?v=CSCJHhOyJtE
USD/CHF Declines Further—Bears Tighten Grip on Pair
Key Highlights
- USD/CHF extended losses and traded below the 0.8860 support.
- A key bearish trend line is forming with resistance at 0.8825 on the 4-hour chart.
- EUR/USD climbed above the 1.0800 resistance zone.
- GBP/USD might soon aim for a move toward 1.3000.
USD/CHF Technical Analysis
The US Dollar remained in a bearish zone below 0.8920 against the Swiss Franc. USD/CHF extended losses below 0.8850 to move further in a bearish zone.
Looking at the 4-hour chart, the pair settled below the 0.8825 level, the 100 simple moving average (red, 4-hour), and the 200 simple moving average (green, 4-hour). The pair even dived below the 0.8800 support zone.
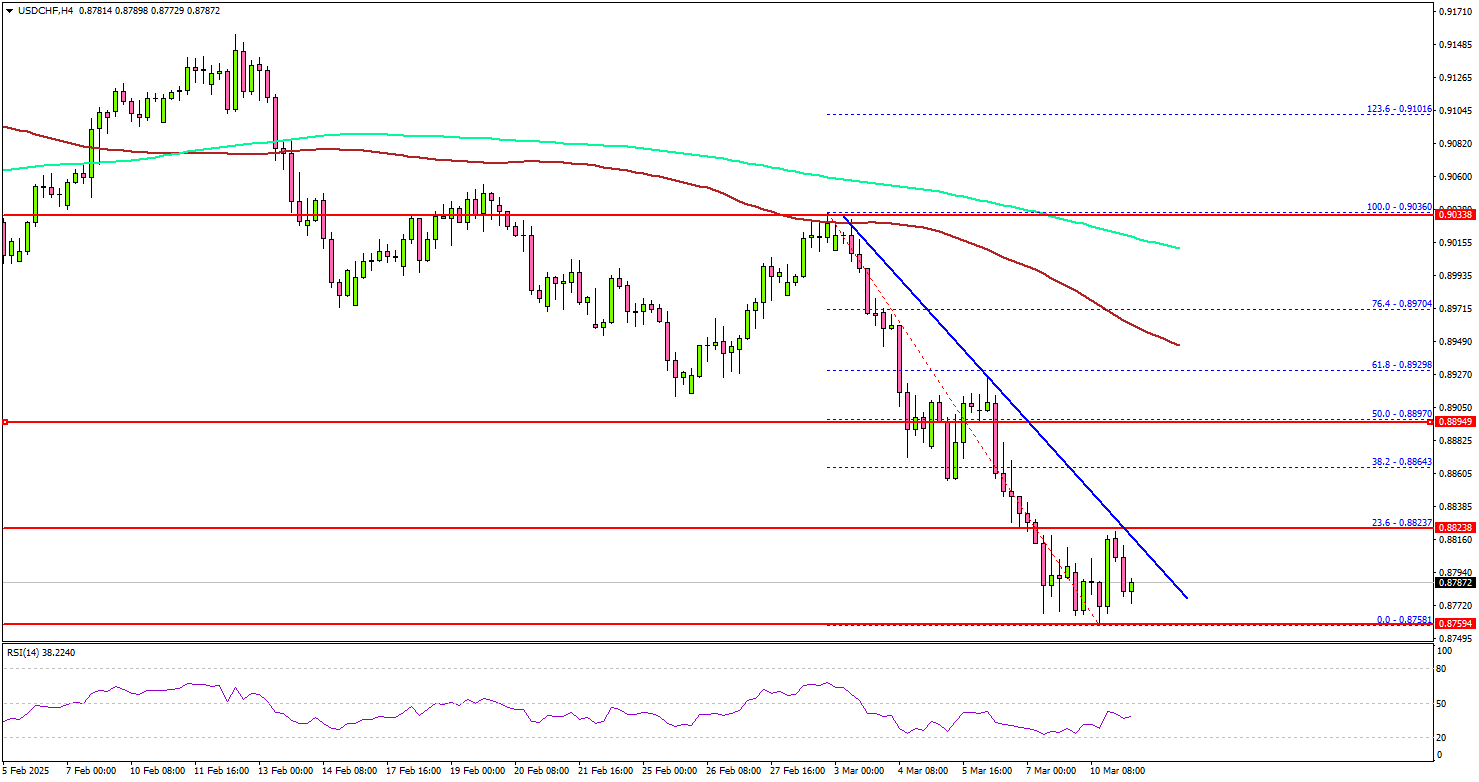
It tested the 0.8760 zone. On the downside, immediate support sits near the 0.8765 level. The next key support sits near the 0.8720 level. Any more losses could send the pair toward the 0.8650 level.
On the upside, the pair seems to be facing hurdles near the 0.8820 level. There is also a key bearish trend line forming with resistance at 0.8825 on the same chart. The next major resistance is near the 0.8865 level.
The main resistance is now forming near the 0.8900 zone. A close above the 0.8900 level could set the tone for another increase. In the stated case, the pair could even clear the 0.8940 resistance.
Looking at GBP/USD, the pair also started a decent increase and the pair could now aim for a move toward the 1.3000 resistance.
Upcoming Economic Events:
- US NFIB Business Optimism Index for Feb 2025 – Forecast 101.0, versus 102.8 previous.
US stock market correction deepens as recession fears take hold
The US stock market suffered its most significant setback in months, with the S&P 500 dropping -2.7%, its biggest one-day decline since December 18. NASDAQ also lost -4.0%, marking its worst single-day percentage loss since September 2022. Analysts widely point to mounting recession worries as the primary catalyst behind the selloff.
Initial concerns emerged over the past month following a series of weaker economic data points, believed by some to be early reactions to an increasingly contentious tariff policy. These worries intensified after recent remarks from the White House suggested a bumpy economic outlook ahead.
In an interview aired on Sunday, US President Donald Trump fueled apprehensions further by describing the economy as going through “a period of transition.” When pressed about an impending recession, he avoided a direct prediction but acknowledged potential “disruption.”
His remarks—“Look, we’re going to have disruption, but we’re OK with that”—did little to reassure investors already on edge about growth prospects.
Adding further weight to recession fears, historical bond market indicators have been flashing warning signs. The 10-year to 2-year US yield curve inverted in mid-2022—a classic recession signal—and only turned positive again in September 2024. Historically, a U.S. recession tends to follow within months after the yield curve normalizes (i.e., turned positive again). If this trend holds true, the US economy could be inching closer to a downturn.
However, another view posits that tariffs are a distraction and that the real driver behind the US selloff is the recent surge in Japanese government bond yields, which have hit a 16-year high. As the carry trade unwinds—where investors borrow in low-yield currencies, often involving Japanese Yen, to fund investments in higher-yield or high-growth assets—capital is flowing out of big tech names, contributing to the NASDAQ’s outsized losses.
Technically, NASDAQ's strong break of 55 W EMA (now at 17864.01) suggests that it's already in correction to the up trend from 10088.82 (2022 low). Deeper fall should be seen to 38.2% retracement of 10088.82 to 20204.58 at 16340.36. Reaction from there will decide whether it's merely in a medium consolidations phase or in an out-right bearish trend reversal.
As for DOW, immediate focus is now on 41844.89 support. Firm break there will complete a double top reversal pattern (45073.63, 45054.36). That should set up deeper fall to 38.2% retracement of 32327.20 to 45073.63 at 40204.49 at least, even it's just a correction to the rise from 32327.20.
Australia’s NAB business confidence slips back into negative as cost pressures persist
Australia’s NAB Business Confidence fell from 5 to -1 in February, erasing last month’s gain and returning to below-average levels. While business conditions improved slightly from 3 to 4, the decline in confidence suggests that businesses remain cautious despite RBA’s recent rate cut and positive Q4 GDP data.
NAB Chief Economist Alan Oster noted that the lift in sentiment seen in January was not sustained, signaling ongoing uncertainty in the business environment. Persistent cost pressures and subdued profitability appear to be key factors weighing on sentiment, keeping confidence below long-term norms.
Within business conditions, trading conditions ticked up from 7 to 8, and profitability conditions rose slightly from -2 to -1, though still remaining in negative territory. Employment conditions, however, weakened from 5 to 4.
Cost pressures remain a concern, with purchase cost growth accelerating from 1.1% to 1.5% in quarterly equivalent terms. On the positive side, labor cost growth eased from 1.7% to 1.5%, indicating that wage price pressures are gradually cooling. Meanwhile, final product price growth slowed from 0.8% to 0.5%, though retail price inflation held steady at 1.0%.
Australia Westpac consumer sentiment jumps to 95.9, soft landing achieved
Australian consumer sentiment saw a strong rebound in March, with Westpac Consumer Sentiment Index jumping 4.0% mom to 95.9, the highest level in three years and not far from neutral 100 mark.
Westpac attributed the improvement to slowing inflation and February’s RBA interest rate cut which have lifted confidence across households. positive views on job security suggest that "soft landing has been achieved". Nevertheless, "unsettling overseas news" continues to weigh on the broader economic outlook.
Looking ahead to RBA's upcoming meeting on March 31-April 1, Westpac expects the central bank to keep the cash rate unchanged. RBA was clear that the 25bps cut in February "did not mean further reductions could be expected at subsequent meetings."
Westpac added, "further slowing in inflation will give the RBA sufficient confidence to deliver more rate cuts this year with the next move coming at the May meeting".