Sample Category Title
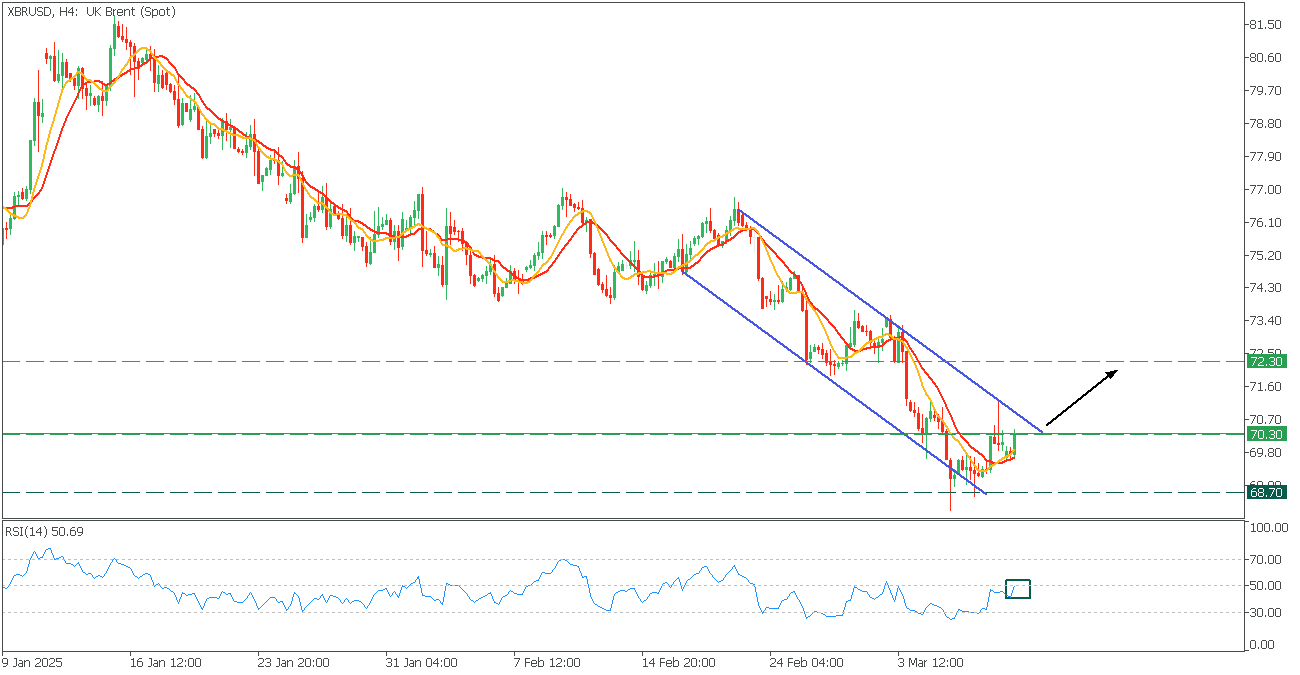
XBRUSD: Descending Channel
XBRUSD, H4
XBRUSD navigates within a bearish channel, facing the 70.30 resistance.
- The 9-MA crosses the 14-MA, while the RSI crosses the mid-line upwards, giving a bullish sentiment.
- Consider a long trade, if the price breaks above the channel, with the target at 72.30 level.
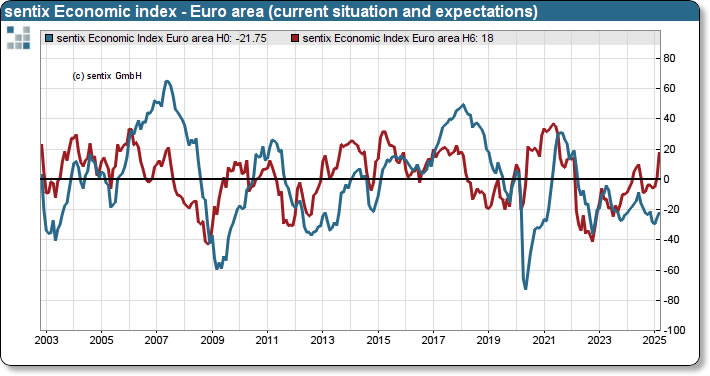
Eurozone Sentix investor confidence jumps to -2.9, Germany feeling downright euphoric
Eurozone Sentix Investor Confidence index jumped from -12.7 to -2.9, far exceeding market expectations of -10 and reaching its highest level since June 2024. Current Situation Index improved relatively modestly from -25.5 to -21.8. Expectations Index soared from 1.0 to 18.0, marking its third consecutive increase and the highest reading since July 2021. This month's surge in expectations represents the largest monthly increase since 2012, signaling a dramatic shift in sentiment among investors.
Germany saw an even more impressive turnaround. The Invest Confidence index rose from -29.7 to -12.5, its best level since April 2023. Current Situation Index climbed from -50.8 to -40.5, the highest since July 2024. Meanwhile, Expectations surged from -5.8 to 20.5, marking the highest level since July 2021.
According to Sentix, much of this optimism is rooted in expectations for increased investment in the EU’s armaments sector and Germany’s infrastructure, which has left investors feeling "downright euphoric" about future prospects.
In contrast, investor sentiment in the US deteriorated significantly. The Sentix Investor Confidence Index plunged from 21.2 to -2.7, its lowest level since 2023. The Current Situation Index dropped from 35.3 to 13.5, the weakest reading since September 2024, while the Expectations Index tumbled from 8.0 to -7.8, its lowest since November 2022.
Sentix described this downturn as a "historic turning point," with such a sharp simultaneous decline in both current and expected values only observed once before—during the 2008 financial crisis.
Low Volume Crypto Market Decline
Market picture
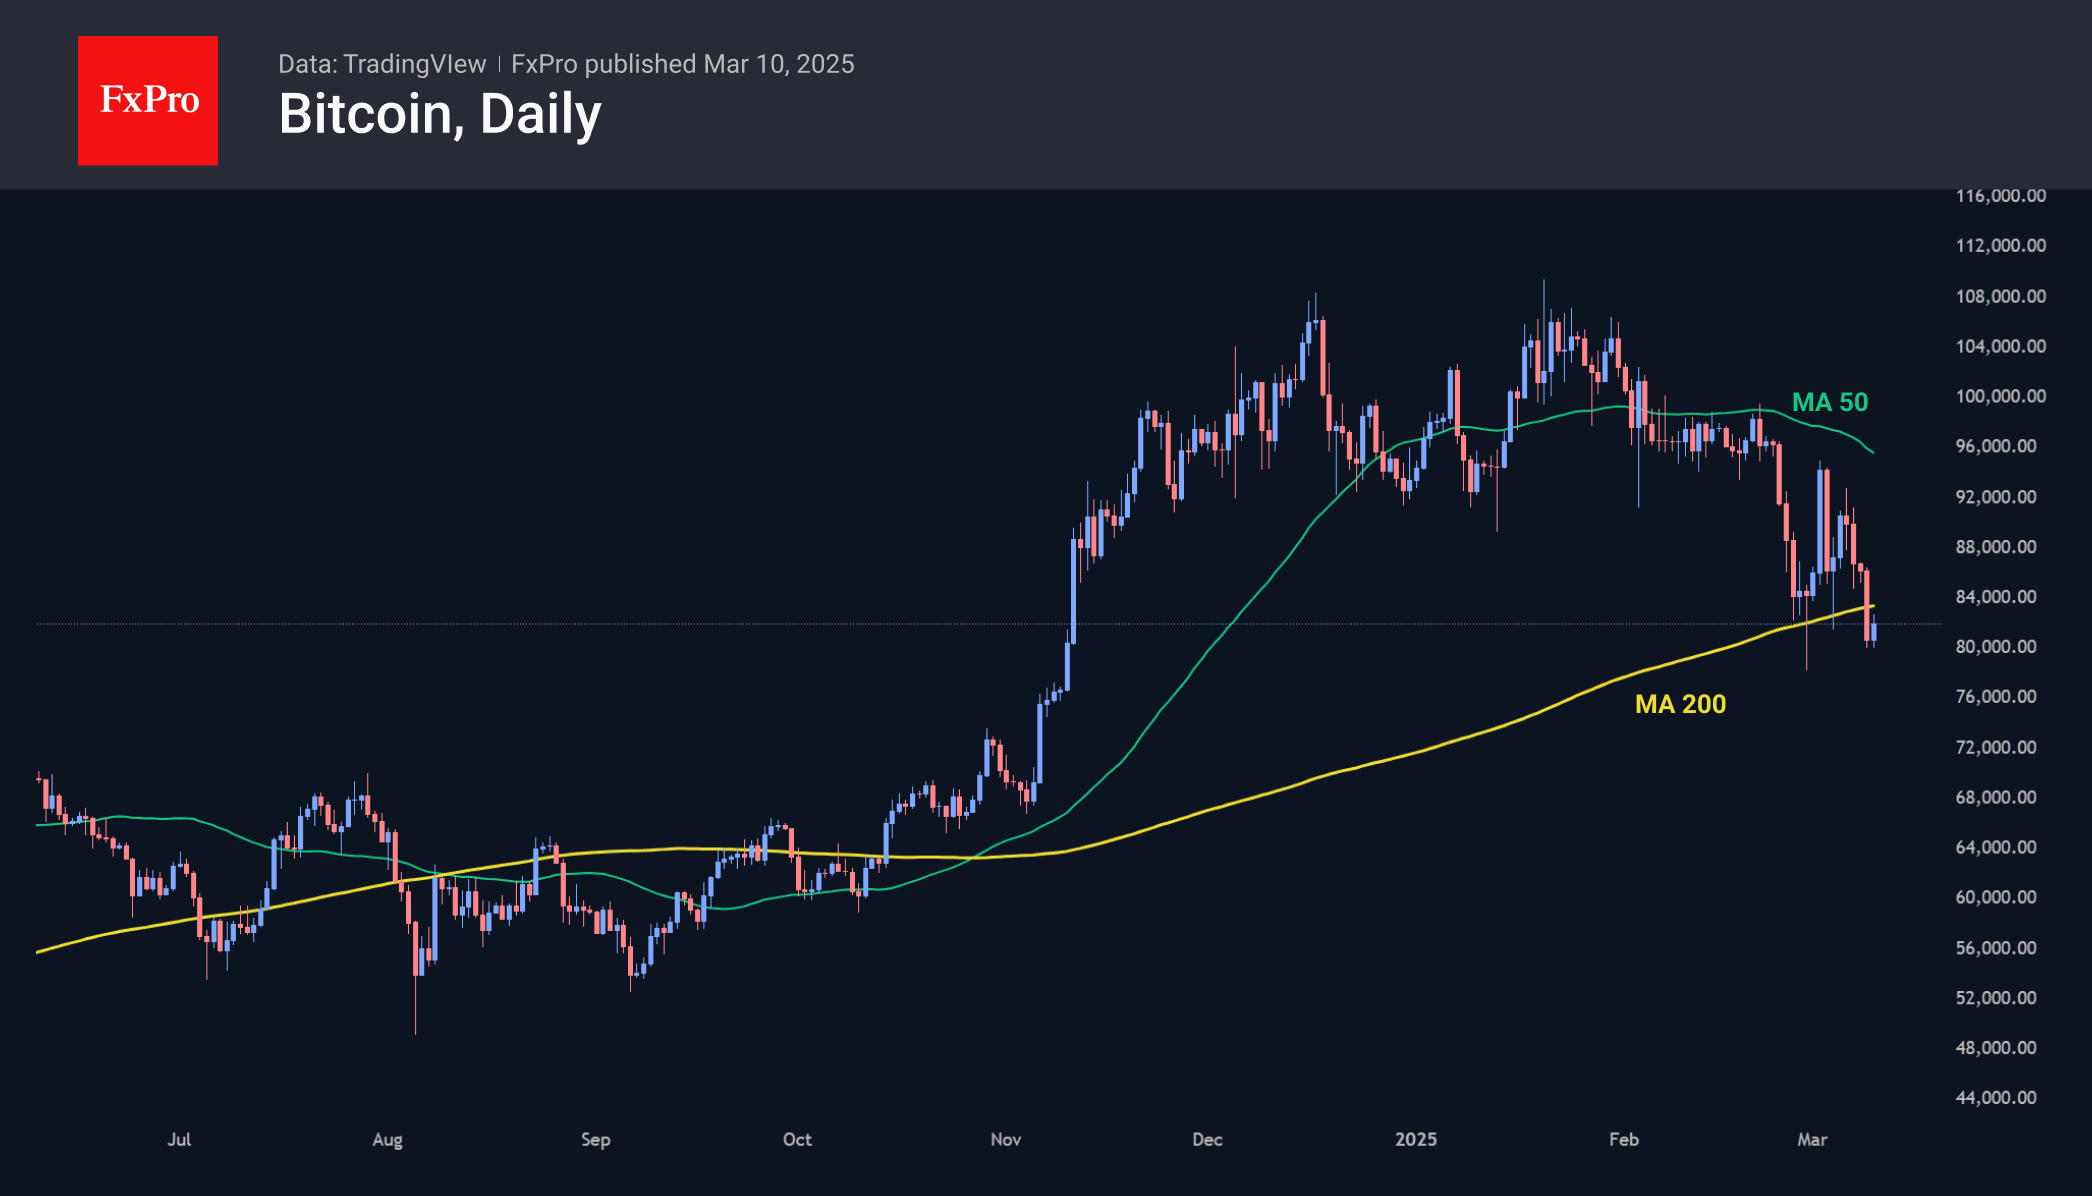
The crypto market is down 4% in the last 24 hours to $2.7 trillion and has been under selling pressure since Sunday afternoon. This can be attributed to a desire to convince the community of the Crypto Summit’s weak results, even though the outcome was quite predictable and not that bad. Trading volumes over the weekend were extremely low, reducing the value of the bearish signal.
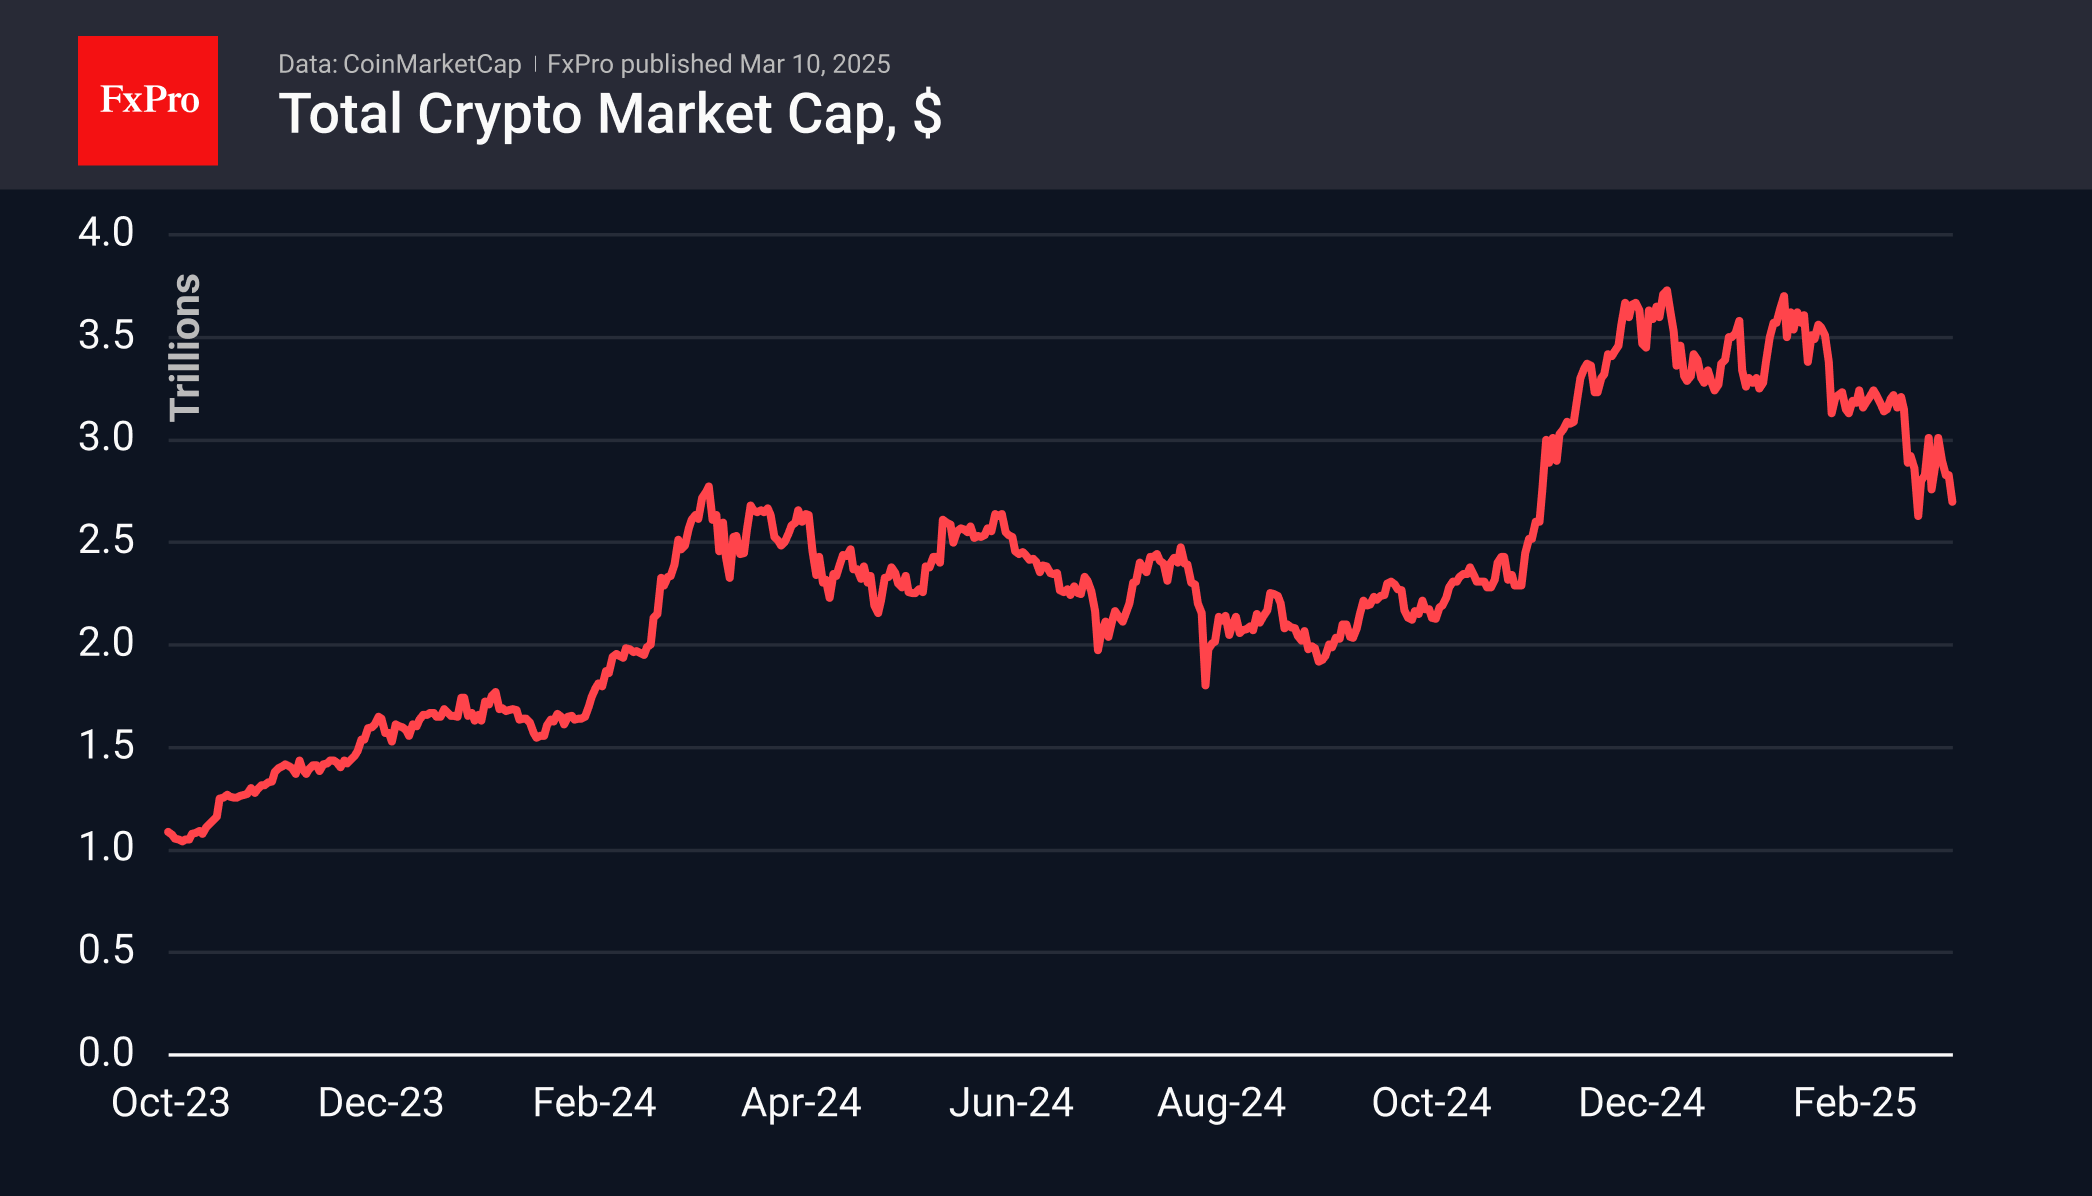
Bitcoin slipped below $80K at the start of Monday’s trading, only to recover to $82K by the start of active European trading, still below the 200-day moving average. A consolidation in this area at the end of the day could accelerate the sell-off and bring in new sellers. We note that sellers push the price down in periods of low liquidity, but the price bounces back with the arrival of institutional buyers. It looks like the big buyers have enough liquidity left to buy out the drawdown.
News background
According to SoSoValue, net outflows from spot bitcoin ETFs totalled $799.4 million last week, down from a record $2.61 billion the week before. The negative trend was seen in all five trading sessions. Cumulative inflows since the launch of bitcoin ETFs in January 2024 fell to $36.14 billion.
The ETH ETF saw net outflows of $119.8 million for the week. Cumulative net inflows since the ETF’s launch in July fell to $2.70 billion (-4.3% for the week).
At the White House Crypto Summit on Friday, Trump noted that government agencies would “explore ways to acquire additional BTC for the reserve”, provided it doesn’t involve taxpayer money.
According to Bitcoin Treasuries, there are 198,109 BTC stored in US-controlled wallets. However, around 120,000 BTC need to be returned to the Bitfinex exchange.
The social media sentiment index for Ethereum has fallen to its lowest level in a year, a sign of a turnaround as the broader market stabilises, according to Santiment.
XNG/USD Analysis: Natural Gas Price Hits Over Two-Year High
On 27 January, while analysing the natural gas chart, we noted that price fluctuations:
→ Were forming an ascending channel.
→ Identified $3.700 as a key resistance level.
As shown on the XNG/USD chart, bears had control in late January but failed to maintain their grip. Since then:
→ Natural gas prices have continued their upward trajectory.
→ The $3.700 level was breached, becoming part of a resistance zone with an upper boundary at $3.800, which later acted as support (as indicated by the arrow).
As a result, today, natural gas prices have surged to $4.800/MMBtu—the highest level since late December 2022.
Bullish Factors Driving the Market (According to Trading Economics):
→ Weather Conditions – A cold spell in the U.S. has increased demand for heating gas. Meteorologists predict a shift towards milder temperatures across 48 states in March.
→ LNG Exports – U.S. liquefied natural gas (LNG) exports have hit a record high of 15.6 billion cubic feet per day under the new administration. Meanwhile, trade uncertainties, including a potential slowdown in natural gas flows from Canada to the U.S., are raising concerns among market participants.
Technical Outlook for XNG/USD:
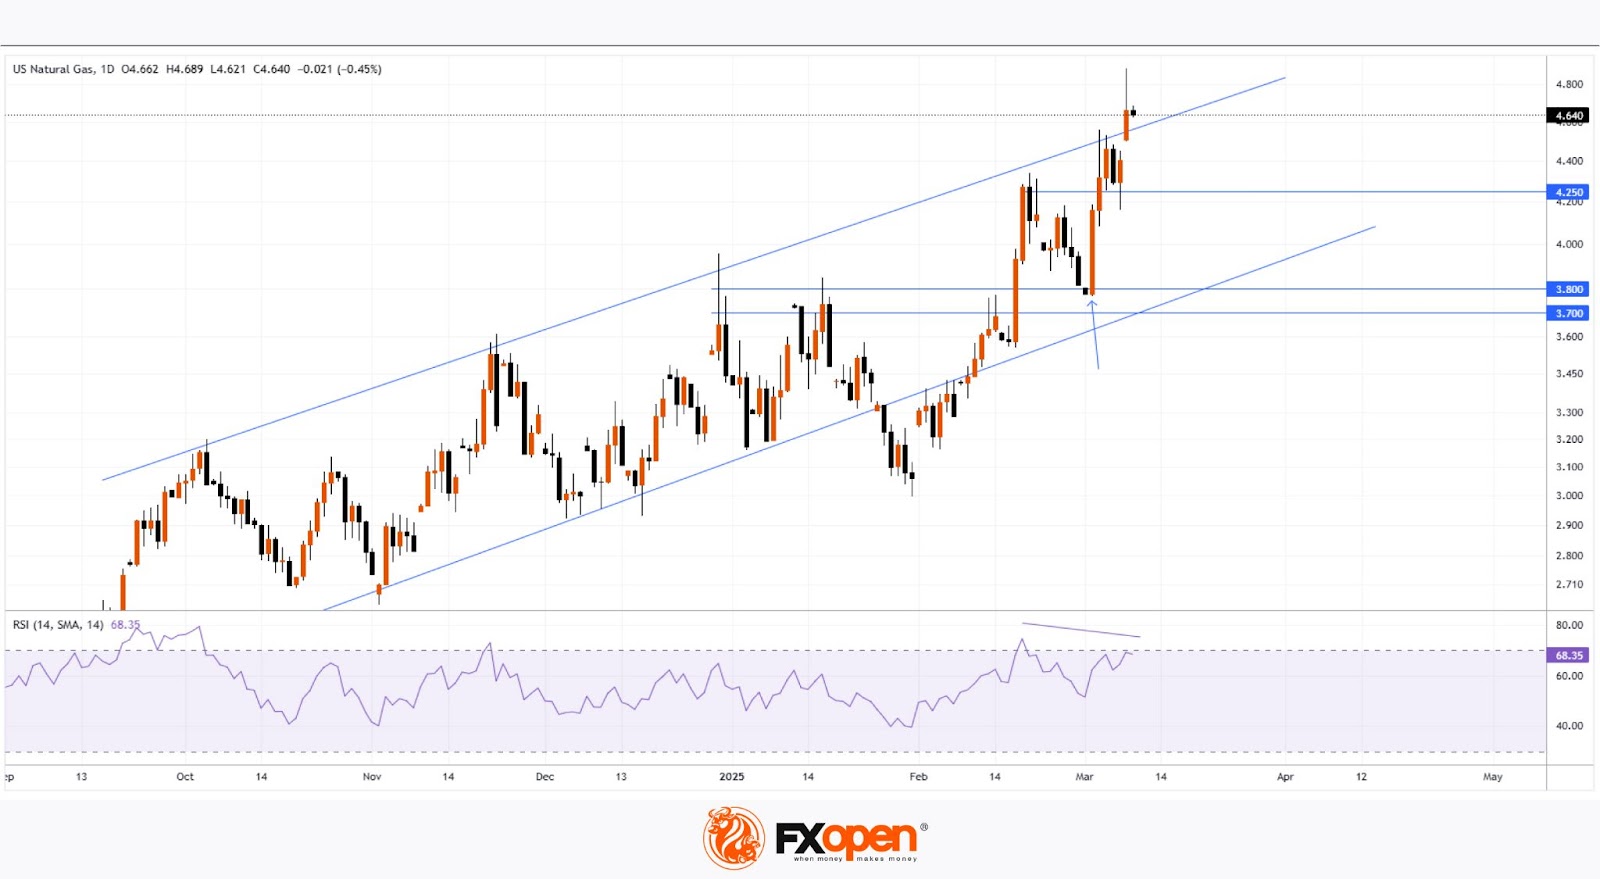
→ The market remains in an uptrend (indicated by blue lines), with the price now exceeding its upper boundary.
→ The RSI indicator is approaching overbought levels and may form a bearish divergence.
These observations suggest that the price is in a vulnerable position for a pullback. If this scenario unfolds, a test of the $4.250 area cannot be ruled out.
Start trading commodity CFDs with tight spreads. Open your trading account now or learn more about trading commodity CFDs with FXOpen.
This article represents the opinion of the Companies operating under the FXOpen brand only. It is not to be construed as an offer, solicitation, or recommendation with respect to products and services provided by the Companies operating under the FXOpen brand, nor is it to be considered financial advice.
AUD/USD and NZD/USD Could Continue Higher
AUD/USD is correcting gains from the 0.6365 zone. NZD/USD is showing positive signs and might attempt a fresh increase above 0.5720.
Important Takeaways for AUD USD and NZD USD Analysis Today
- The Aussie Dollar started a downside correction from 0.6365 against the US Dollar.
- There is a key bullish trend line forming with support at 0.6300 on the hourly chart of AUD/USD at FXOpen.
- NZD/USD is holding gains above the 0.5695 support zone.
- There was a break below a major bullish trend line with support at 0.5720 on the hourly chart of NZD/USD at FXOpen.
AUD/USD Technical Analysis
On the hourly chart of AUD/USD at FXOpen, the pair started a fresh increase from the 0.6185 support. The Aussie Dollar was able to clear the 0.62550 resistance to move into a positive zone against the US Dollar.
There was a close above the 0.6275 resistance and the 50-hour simple moving average. Finally, the pair tested the 0.6365 zone. A high was formed near 0.6363 and the pair is now correcting gains.
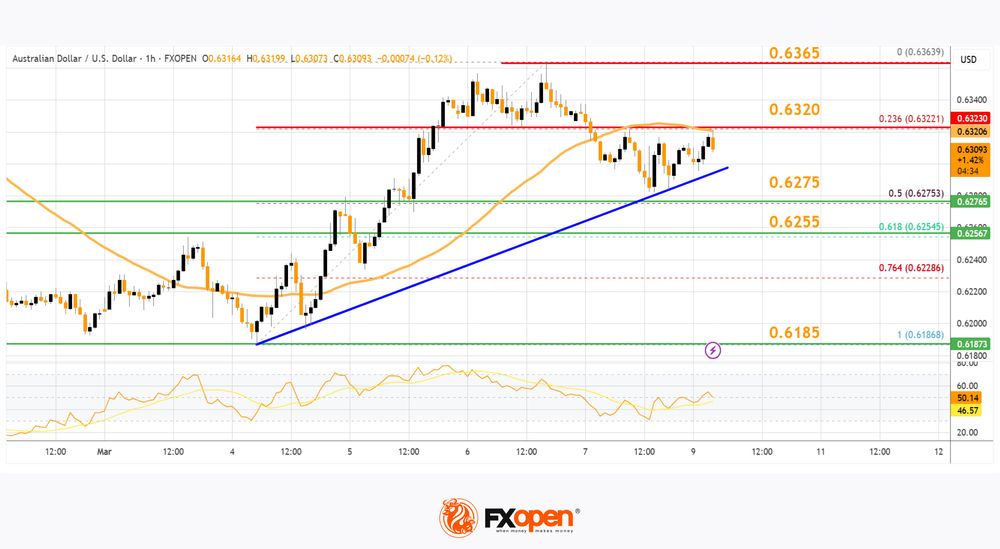
There was a move below the 0.6320 level. The pair declined below the 23.6% Fib retracement level of the upward move from the 0.6186 swing low to the 0.6363 high. On the downside, initial support is near a key bullish trend line at 0.6300.
The next major support is near the 50% Fib retracement level of the upward move from the 0.6186 swing low to the 0.6363 high at 0.6274.
If there is a downside break below the 0.6270 support, the pair could extend its decline toward the 0.6255 level. Any more losses might signal a move toward 0.6185.
On the upside, the AUD/USD chart indicates that the pair is now facing resistance near 0.6320. The first major resistance might be 0.6365. An upside break above the 0.6365 resistance might send the pair further higher.
The next major resistance is near the 0.6420 level. Any more gains could clear the path for a move toward the 0.6450 resistance zone.
NZD/USD Technical Analysis
On the hourly chart of NZD/USD on FXOpen, the pair started a steady increase from the 0.5585 zone. The New Zealand Dollar broke the 0.5635 resistance to start the recent increase against the US Dollar.
The pair settled above 0.5695 and the 50-hour simple moving average. It tested the 0.5760 zone and is currently correcting gains. The pair corrected lower below the 0.5720 level. The pair also traded below the 23.6% Fib retracement level of the upward wave from the 0.5595 swing low to the 0.5759 high.
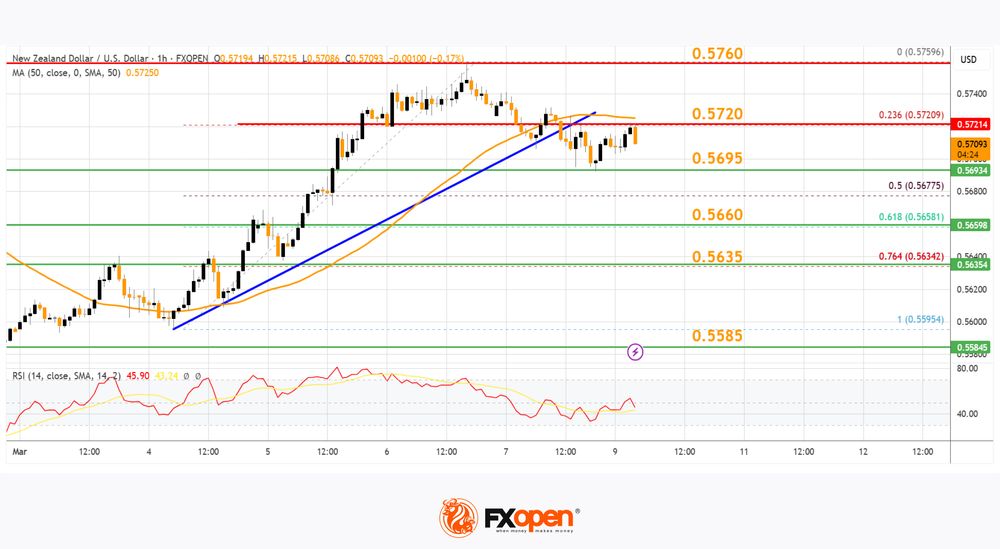
Besides, there was a break below a major bullish trend line with support at 0.5720. The NZD/USD chart suggests that the RSI is now below 50. On the downside, there is major support forming near 0.5695.
The next major support is near the 61.8% Fib retracement level of the upward wave from the 0.5595 swing low to the 0.5759 high at 0.5660.
If there is a downside break below the 0.5660 support, the pair might slide toward the 0.5635 support. Any more losses could lead NZD/USD in a bearish zone to 05585.
On the upside, the pair might struggle near 0.5720. The next major resistance is near the 0.5760 level. A clear move above the 0.5760 level might even push the pair toward the 0.5800 level. Any more gains might clear the path for a move toward the 0.5840 resistance zone in the coming days.
Trade over 50 forex markets 24 hours a day with FXOpen. Take advantage of low commissions, deep liquidity, and spreads from 0.0 pips. Open your FXOpen account now or learn more about trading forex with FXOpen.
This article represents the opinion of the Companies operating under the FXOpen brand only. It is not to be construed as an offer, solicitation, or recommendation with respect to products and services provided by the Companies operating under the FXOpen brand, nor is it to be considered financial advice.
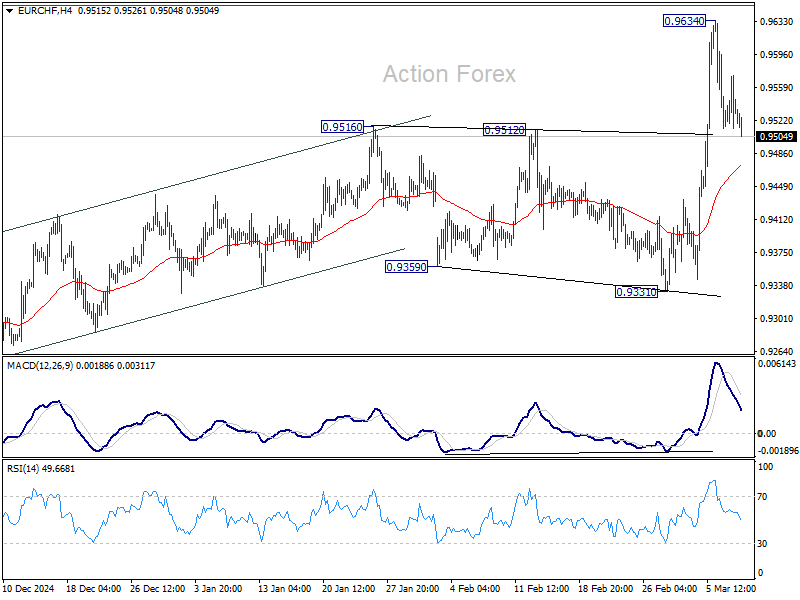
EUR/CHF Daily Outlook
Daily Pivots: (S1) 0.9484; (P) 0.9560; (R1) 0.9605; More....
Intraday bias in EUR/CHF remains neutral for consolidations below 0.9634. Further rally will be expected as long as 55 4H EMA (now at 0.9472) holds. On the upside, above 0.9634, and sustained trading above 0.9651 fibonacci level will pave the way back to 0.9928 key resistance next.
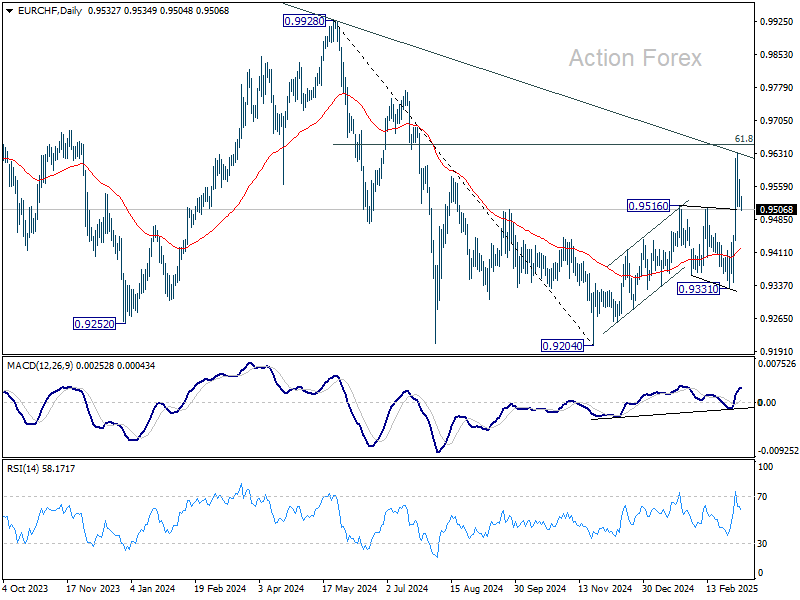
In the bigger picture, the strong break of 55 W EMA (now at 0.9482) is a medium term bullish sign. Sustained break trading above long-term falling channel resistance (at around 0.9620) would suggest that the downtrend from 1.2004 (2018 high) has bottomed at 0.9204. Stronger rally should then be see to 0.9928 key resistance at least.
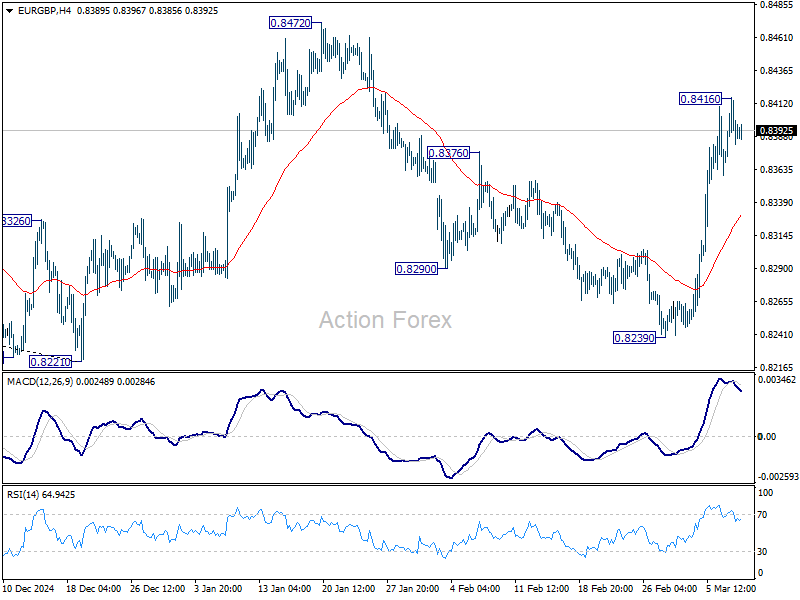
EUR/GBP Daily Outlook
Daily Pivots: (S1) 0.8361; (P) 0.8390; (R1) 0.8411; More...
Intraday bias in EUR/GBP stays neutral for consolidations below 0.8416 temporary top. Downside should be contained above 55 4H EMA (now at 0.8330) to bring another rise. Break of 0.8416 will resume the rally from 0.8239 to target 0.8472 resistance next.
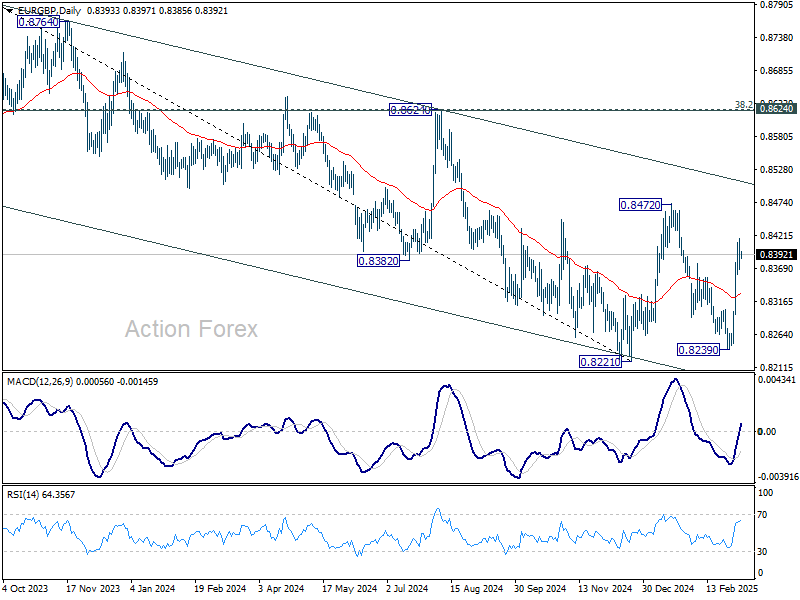
In the bigger picture, EUR/GBP is still bounded inside medium term falling channel. While rebound from 0.8221 might extend higher, it could still develop into a corrective pattern. Overall outlook will be neutral at best and down trend from 0.9267 (2022 high) could extend, at least until decisive break of channel resistance (now at 0.8511).
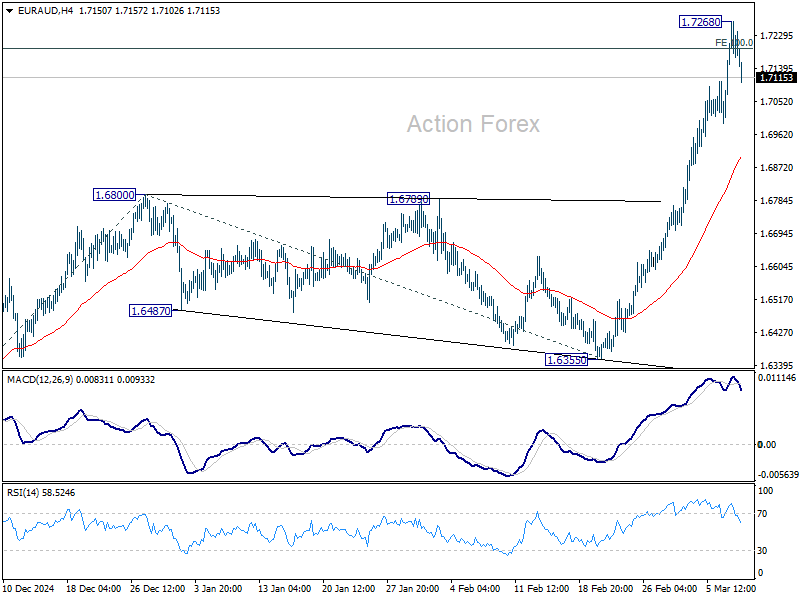
EUR/AUD Daily Outlook
Daily Pivots: (S1) 1.6944; (P) 1.7019; (R1) 1.7106; More...
A temporary top is formed at 1.7268 in EUR/AUD with current retreat and intraday bias is turned neutral for consolidations. downside should be contained by 55 4H EMA (now at 1.6902) to bring another rally. On the upside, sustained trading above 100% projection of 1.5963 to 1.6800 from 1.6355 at 1.7192 will target 161.8% projection at 1.7709 next.
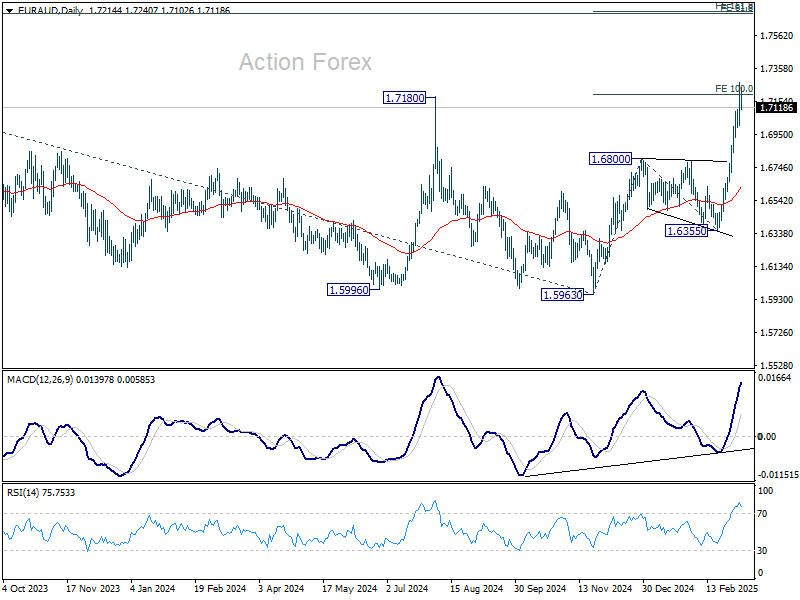
In the bigger picture, the breach of 1.7180 key resistance (2024 high) suggests that up trend from 1.4281 (2022 low) is resuming. Sustained trading above 1.7180 will confirm and target 61.8% projection of 1.4281 to 1.7062 from 1.5963 at 1.7682, which is also close to 61.8% retracement of 1.9799 (2020 high) to 1.4281 at 1.7691. For now, this will remain the favored case as long as 1.6355 support holds, even in case of deep pullback.
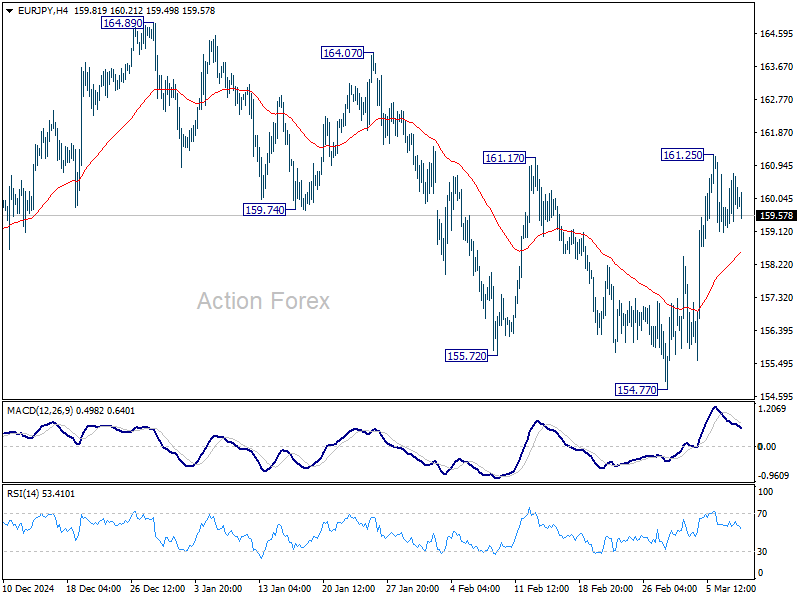
EUR/JPY Daily Outlook
Daily Pivots: (S1) 159.55; (P) 160.15; (R1) 161.03; More...
Intraday bias in EUR/JPY remains neutral for the moment. Overall development suggest that consolidation pattern from 154.40 is extending with another rising leg. On the upside, break of 161.25 will target 164.89 resistance.
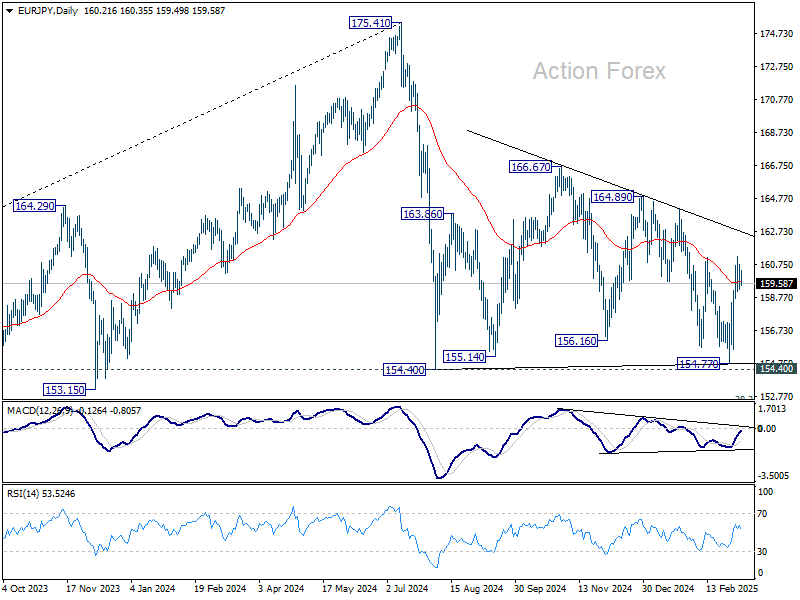
In the bigger picture, price actions from 175.41 are seen as correction to rally from 114.42 (2020 low). Strong support should be seen from 38.2% retracement of 114.42 to 175.41 at 152.11 to contain downside. However, sustained break of 152.11 will bring deeper fall even still as a correction.
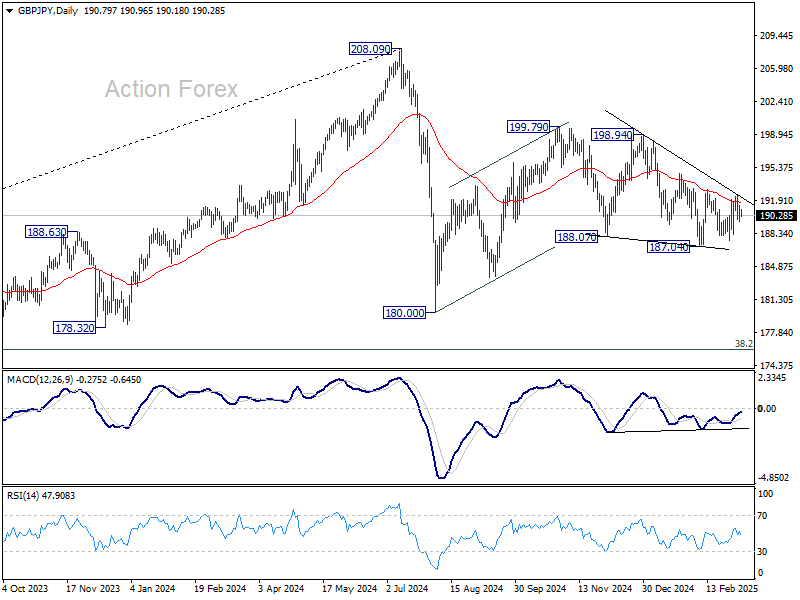
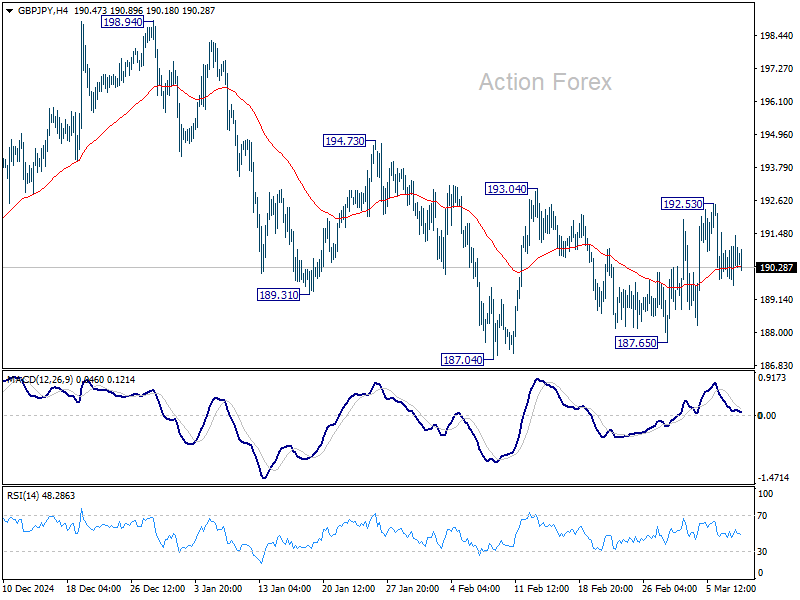
GBP/JPY Daily Outlook
Daily Pivots: (S1) 190.15; (P) 190.79; (R1) 191.93; More...
Intraday bias in GBP/JPY stays neutral as range trading continues. On the upside, firm break of 193.04 will resume the rebound from 187.04 to 194.73 resistance, and then 198.94. On the downside, firm break of 187.04 will extend the fall from 199.79 towards 180.00 support. Overall, corrective pattern from 180.00 might still be extending.
In the bigger picture, price actions from 208.09 are seen as a correction to rally from 123.94 (2020 low). Strong support should be seen from 38.2% retracement of 123.94 to 208.09 at 175.94 to contain downside. However, sustained break of 152.11 will bring deeper fall even still as a correction.