Sample Category Title
USD/JPY Mid-Day Outlook
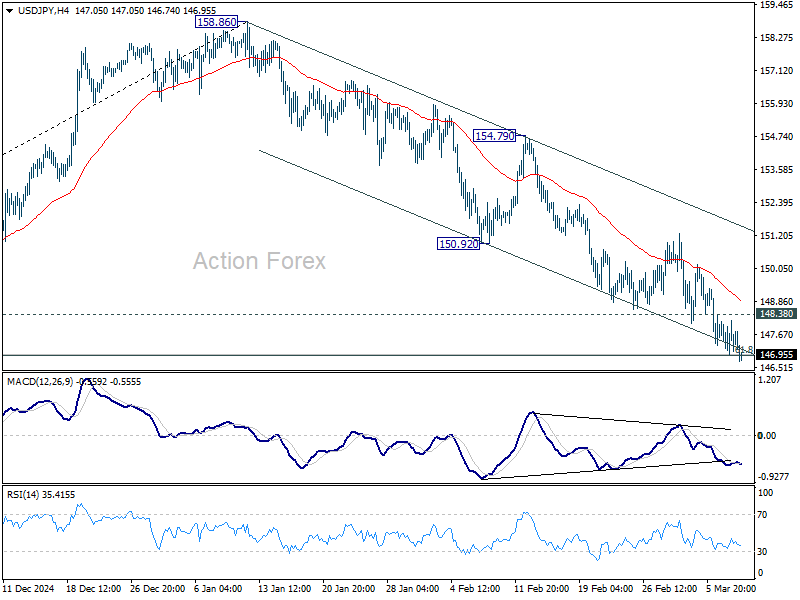
Daily Pivots: (S1) 147.26; (P) 147.73; (R1) 148.51; More...
No change in USD/JPY's outlook and intraday bias stays on the downside. Sustained trading below 61.8% retracement of 139.57 to 158.86 at 146.32 will pave the way to 139.57 support. On the upside, 148.38 minor resistance will turn intraday bias neutral and bring consolidations again, before staging another fall.
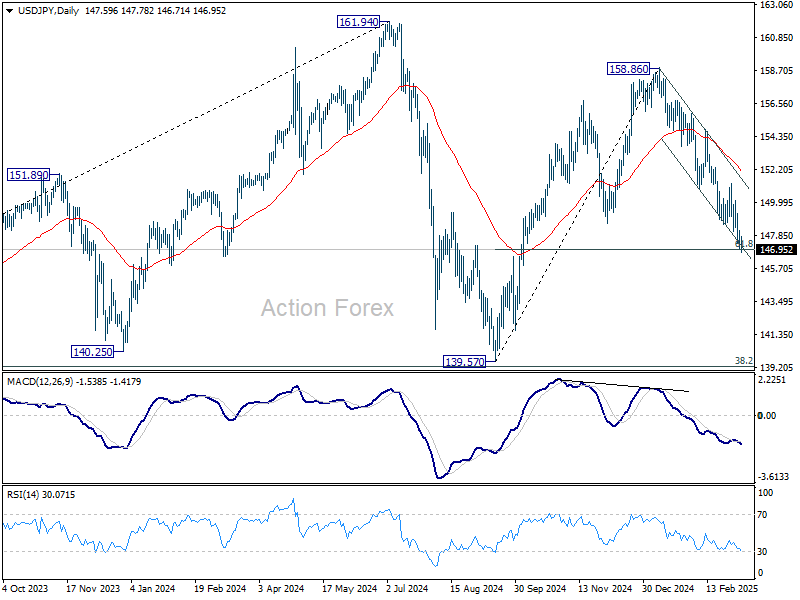
In the bigger picture, price actions from 161.94 are seen as a corrective pattern to rise from 102.58 (2021 low), with fall from 158.86 as the third leg. Strong support should be seen from 38.2% retracement of 102.58 to 161.94 at 139.26 to bring rebound. However, sustained break of 139.26 would open up deeper medium term decline to 61.8% retracement at 125.25.
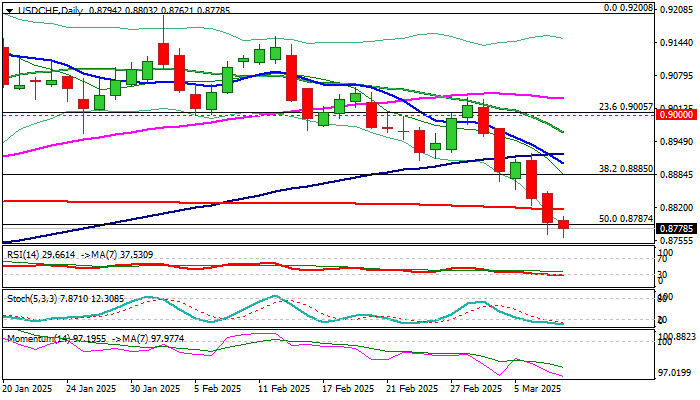
USD/CHF Mid-Day Outlook
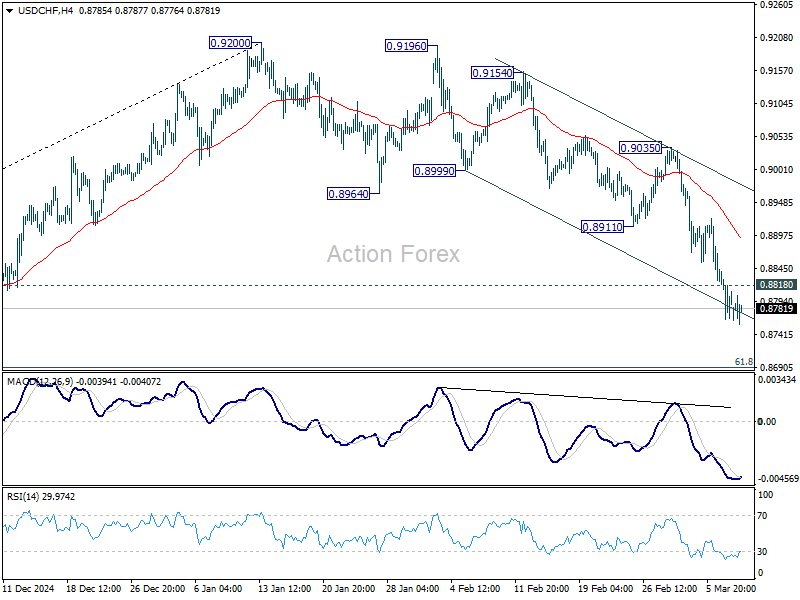
Daily Pivots: (S1) 0.8759; (P) 0.8809; (R1) 0.8850; More…
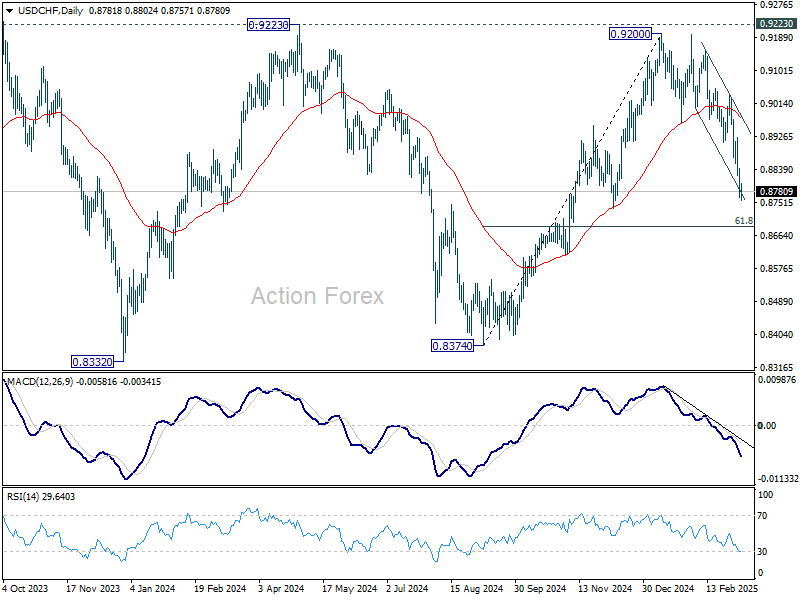
USD/CHF's decline from 0.9200 is still in progress and intraday bias stays on the downside. Next target is 61.8% retracement of 0.8374 to 0.9200 at 0.8690. Sustained break there will pave the way back to 0.8374 support. On the upside, above 0.8818 minor resistance will turn intraday bias neutral and bring consolidations, before staging another fall.
In the bigger picture, rejection by 0.9223 key resistance keep medium term outlook bearish. That is, larger fall from 1.0342 (2017 high) is not completed yet. Firm break of 0.8332 (2023 low) will confirm down trend resumption.
GBP/USD Mid-Day Outlook
Daily Pivots: (S1) 1.2879; (P) 1.2912; (R1) 1.2953; More...
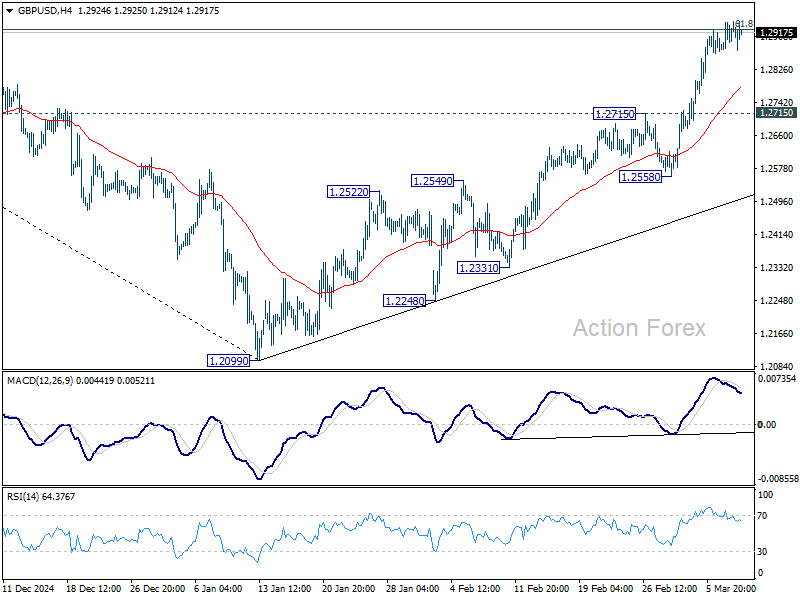
Intraday bias in GBP/USD remains neutral for the moment. Some consolidations could be seen first, but downside should be contained by 1.2715 resistance turned support to bring another rally. On the upside, sustained break of 61.8% retracement of 1.3433 to 1.2099 at 1.2923 will pave the way back to 1.3433 high.
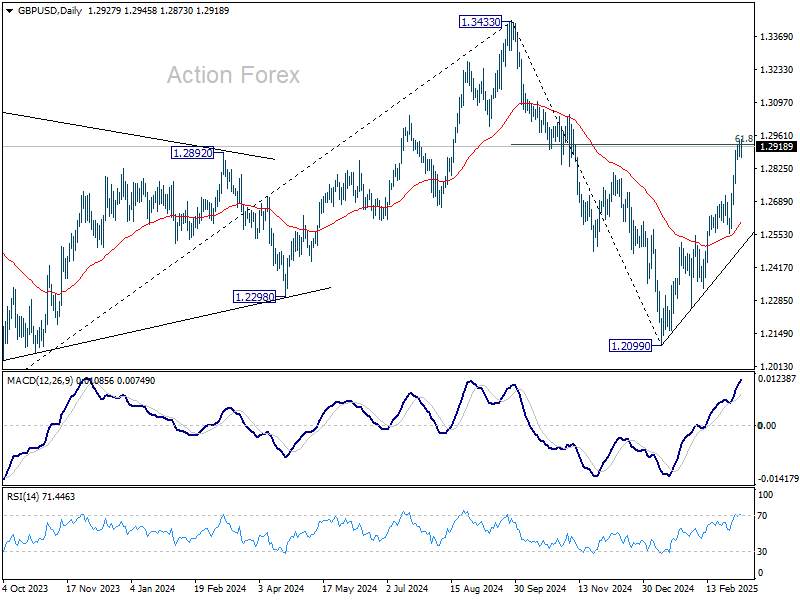
In the bigger picture, fall from 1.3433 (2024 high) should have completed at 1.2099 as a corrective move. Up trend from 1.3051 (2022 low) is still in progress but it's too early to say that it's resuming. Corrective pattern from 1.3433 could extend with one more down leg. But after all, eventual upside breakout is expected at a later stage.
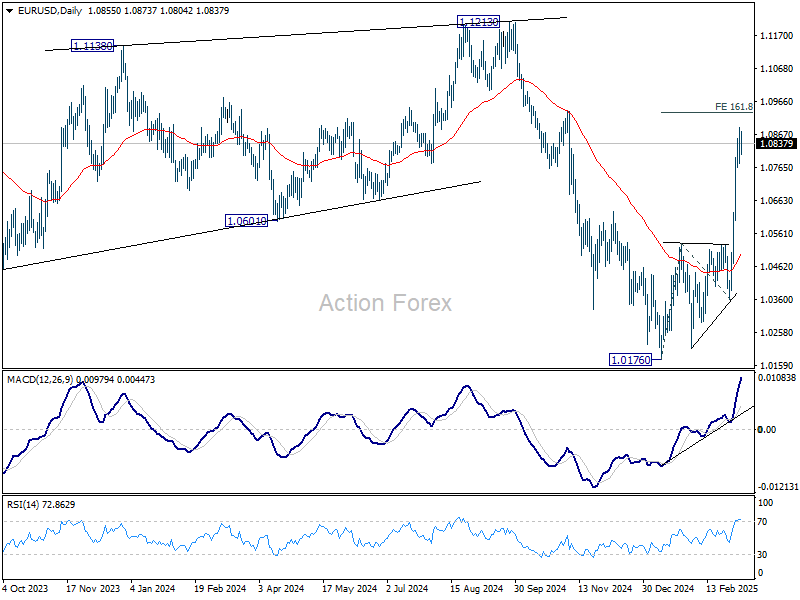
EUR/USD Mid-Day Outlook
Daily Pivots: (S1) 1.0780; (P) 1.0834; (R1) 1.0888; More...
While further rise could be seen in EUR/USD, loss of momentum as seen in 4H MACD could limit upside to bring retreat. On the downside, break of 1.0764 minor support will with bias neutral for consolidations first, before staging another rally. Nevertheless, firm break of 1.0932 will pave the way back to 1.1274 key resistance next.
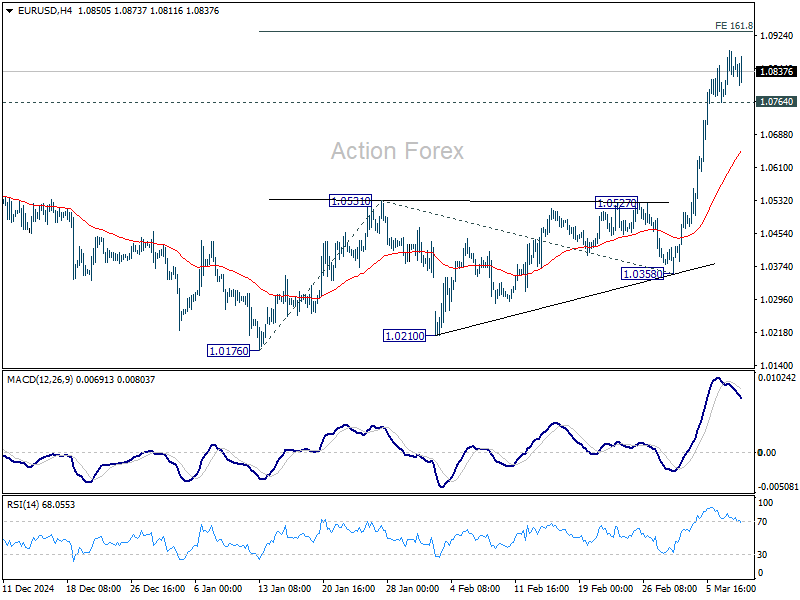
In the bigger picture, the strong break of 55 W EMA (now at 1.0675) suggests that fall from 1.1274 (2024 high) has completed as a three wave correction to 1.0176. Rise from 0.9534 is still intact, and might be ready to resume. Decisive break of 1.1274 will target 100% projection of 0.9534 to 1.1274 from 1.0176 at 1.1916. Also, that will send EUR/USD through a multi-decade channel resistance will carries larger bullish implication. This will now be the favored case as long as 1.0531 resistance turned support holds.
Risk Sentiment Dips in Europe But Euro Holds Steady
Risk sentiment took a mild turn to the downside in European markets today, with DAX pulling back from last week’s solid gains. Investors are watching developments in Germany’s political arena, where Greens have voiced opposition to proposals by CDU’s Friedrich Merz for a sweeping overhaul of debt rules, including a massive increase in state borrowing and a EUR 500B infrastructure fund.
While this move appears to have dampened market confidence temporarily, the broader reaction remains measured, suggesting that investors are just waiting for more clarity on any subsequent political negotiations.
Despite initially rejecting Merz’s plans, Greens have indicated they will present their own ideas and hold further talks with both conservative CDU/CSU and SPD. This could be a strategic negotiation tactic aimed at extracting additional concessions for climate protection measures or other political agenda.
Meanwhile, Euro is largely unfazed, holding steady in tight range against Dollar. Supporting Euro’s relative resilience, strong investor confidence data in both the Eurozone and Germany stand in stark contrast to deteriorating sentiment in the US.
Elsewhere, Canadian Dollar lingers as the day’s worst performer, finding little support even after former BoC and BoE Governor Mark Carney emerged as Canada’s next Prime Minister, replacing Justin Trudeau. However, uncertainties loom over Canada’s political and economic future. His Liberal Party has recently gained ground, fueled by renewed sense of national unity against US tariffs. Yet, the party still faces tough challenges from the opposition Conservatives, who have consistently led in the polls for months—often by double digits.
Carney is expected to call an election soon in an effort to capitalize on the momentum and strengthen the Liberal Party’s position. However, it is clearly an uphill battle as the Conservatives remain well-positioned to challenge for power. While Carney’s track record in central banking has earned him global respect, translating that expertise into electoral momentum could prove challenging.
Overall in the forex markets, Yen is topping the performance chart today, followed by Kiwi and Swiss Franc, reflecting a slight tilt toward safer assets. At the other end of the spectrum, Loonie is the weakest, with Dollar and Sterling also lagging. Euro and Aussie find themselves in the middle of the pack.
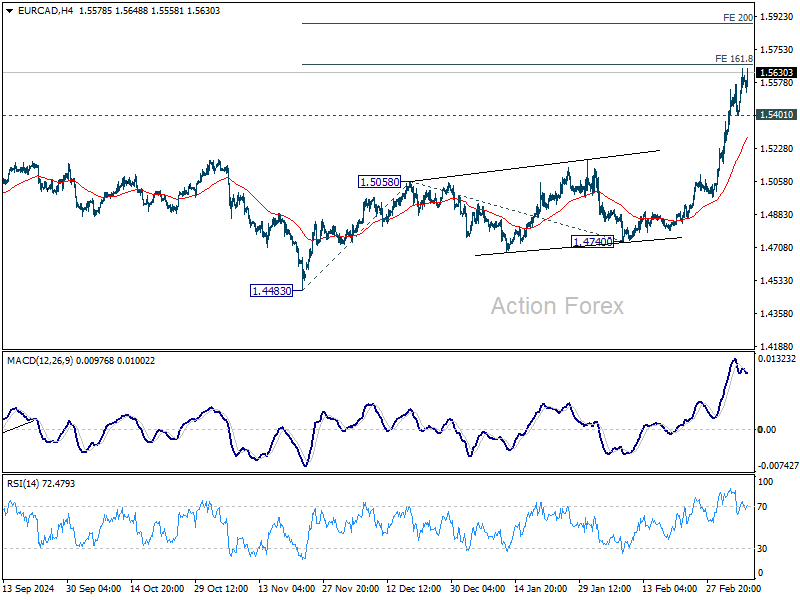
Technically, EUR/CAD is now eyeing 161.8% projection of 1.4483 to 1.5058 from 1.4740 at 1.5670 after recent strong rally. Firm break of 1.5670 will push the cross further to 200% projection at 1.5890, where it could find strong resistance for short term topping. Or, break of 1.5401 support will argue that a consolidation phase has already started.
In Europe, at the time of writing, FTSE is down -0.92%. DAX is down -1.25%. CAC is down -0.42%. UK 10-year yield is down -0.007 at 4.596. Germany 10-year yield is down -0.029 at 2.815. Earlier in Asia, Nikkei rose 0.57%. Hong Kong HSI fell -1.57%. China Shanghai SSE fell -0.38%. Singapore Strait Times fell -0.21%. Japan 10-year JGB yield rose 0.063 to 1.587.
ECB’s Kazimir: No automatic decisions or rushing
Slovak ECB Governing Council member Peter Kazimir emphasized the need for flexibility in monetary policy, cautioning against premature decisions on interest rate cuts.
In a blog post, he highlighted that inflation risks remain "tilted to the upside". He added that historical precedent showing that tariffs tend to slow economic growth while simultaneously pushing prices higher—precisely the scenario ECB seeks to avoid.
Given these uncertainties, Kazimir reinforced the importance of keeping "all options open," suggesting that the ECB could either proceed with further rate cuts or pause.
He made it clear that he is still seeking "undeniable confirmation" that the current disinflation trend will persist before endorsing any easing measures.
With inflation dynamics remaining complex, he stressed that "now is not the time for automatic decisions or rushing."
Eurozone Sentix investor confidence jumps to -2.9, Germany feeling downright euphoric
Eurozone Sentix Investor Confidence index jumped from -12.7 to -2.9, far exceeding market expectations of -10 and reaching its highest level since June 2024. Current Situation Index improved relatively modestly from -25.5 to -21.8. Expectations Index soared from 1.0 to 18.0, marking its third consecutive increase and the highest reading since July 2021. This month's surge in expectations represents the largest monthly increase since 2012, signaling a dramatic shift in sentiment among investors.
Germany saw an even more impressive turnaround. The Invest Confidence index rose from -29.7 to -12.5, its best level since April 2023. Current Situation Index climbed from -50.8 to -40.5, the highest since July 2024. Meanwhile, Expectations surged from -5.8 to 20.5, marking the highest level since July 2021.
According to Sentix, much of this optimism is rooted in expectations for increased investment in the EU’s armaments sector and Germany’s infrastructure, which has left investors feeling "downright euphoric" about future prospects.
In contrast, investor sentiment in the US deteriorated significantly. The Sentix Investor Confidence Index plunged from 21.2 to -2.7, its lowest level since 2023. The Current Situation Index dropped from 35.3 to 13.5, the weakest reading since September 2024, while the Expectations Index tumbled from 8.0 to -7.8, its lowest since November 2022.
Sentix described this downturn as a "historic turning point," with such a sharp simultaneous decline in both current and expected values only observed once before—during the 2008 financial crisis.
Japan’s nominal wages rises 2.8% yoy in Jan, real wages fall -1.8% yoy
Japan’s labor cash earnings rose 2.8% yoy in January, falling short of market expectations of 3.2% yoy. Nominal wage growth remained positive for the 37th month.
Real wages, adjusted for inflation, fell -1.8% yoy, reversing two months of slight gains. The decline was largely driven by a sharp rise in consumer inflation.
The inflation rate used by the Ministry of Health, Labor and Welfare to calculate real wages—which includes fresh food prices but excludes rent—accelerated to 4.7% yoy, its highest level since January 2023.
Regular pay, or base salary, rose 3.1% yoy, the largest gain since 1992. This was overshadowed by a sharp -3.7% yoy decline in special payments, which consist largely of one-off bonuses.
China’s inflation turns negative, but seasonal factors skew the picture
Released over the weekend, China’s consumer inflation dipped into negative territory for the first time in over a year, with February’s CPI coming in at -0.7% yoy, weaker than the expected -0.5% yoy, and a sharp reversal from January’s 0.5% yoy gain.
Core CPI, which strips out food and energy prices, also slipped by -0.1% yoy—its first decline since January 2021—signaling weak underlying demand.
On a month-over-month basis, consumer prices fell -0.2%, more than the expected -0.1%, reversing some of January’s 0.7% increase.
While the decline may raise concerns about deflationary pressures, NBS attributed much of the drop to seasonal distortions tied to the timing of the Lunar New Year. Stripping out this factor, NBS estimates that CPI actually rose 0.1% yoy.
Given these distortions, a clearer picture of China’s inflation trajectory will likely emerge in March when seasonal effects fade.
Meanwhile, producer prices remained in contraction for the 29th consecutive month, with PPU declining -2.2% yoy, slightly better than January’s -2.3% yoy but still below expectations of -2.1% yoy.
EUR/USD Mid-Day Outlook
Daily Pivots: (S1) 1.0780; (P) 1.0834; (R1) 1.0888; More...
While further rise could be seen in EUR/USD, loss of momentum as seen in 4H MACD could limit upside to bring retreat. On the downside, break of 1.0764 minor support will with bias neutral for consolidations first, before staging another rally. Nevertheless, firm break of 1.0932 will pave the way back to 1.1274 key resistance next.+
In the bigger picture, the strong break of 55 W EMA (now at 1.0675) suggests that fall from 1.1274 (2024 high) has completed as a three wave correction to 1.0176. Rise from 0.9534 is still intact, and might be ready to resume. Decisive break of 1.1274 will target 100% projection of 0.9534 to 1.1274 from 1.0176 at 1.1916. Also, that will send EUR/USD through a multi-decade channel resistance will carries larger bullish implication. This will now be the favored case as long as 1.0531 resistance turned support holds.
ECB’s Kazimir: No automatic decisions or rushing
Slovak ECB Governing Council member Peter Kazimir emphasized the need for flexibility in monetary policy, cautioning against premature decisions on interest rate cuts.
In a blog post, he highlighted that inflation risks remain "tilted to the upside". He added that historical precedent showing that tariffs tend to slow economic growth while simultaneously pushing prices higher—precisely the scenario ECB seeks to avoid.
Given these uncertainties, Kazimir reinforced the importance of keeping "all options open," suggesting that the ECB could either proceed with further rate cuts or pause.
He made it clear that he is still seeking "undeniable confirmation" that the current disinflation trend will persist before endorsing any easing measures.
With inflation dynamics remaining complex, he stressed that "now is not the time for automatic decisions or rushing."
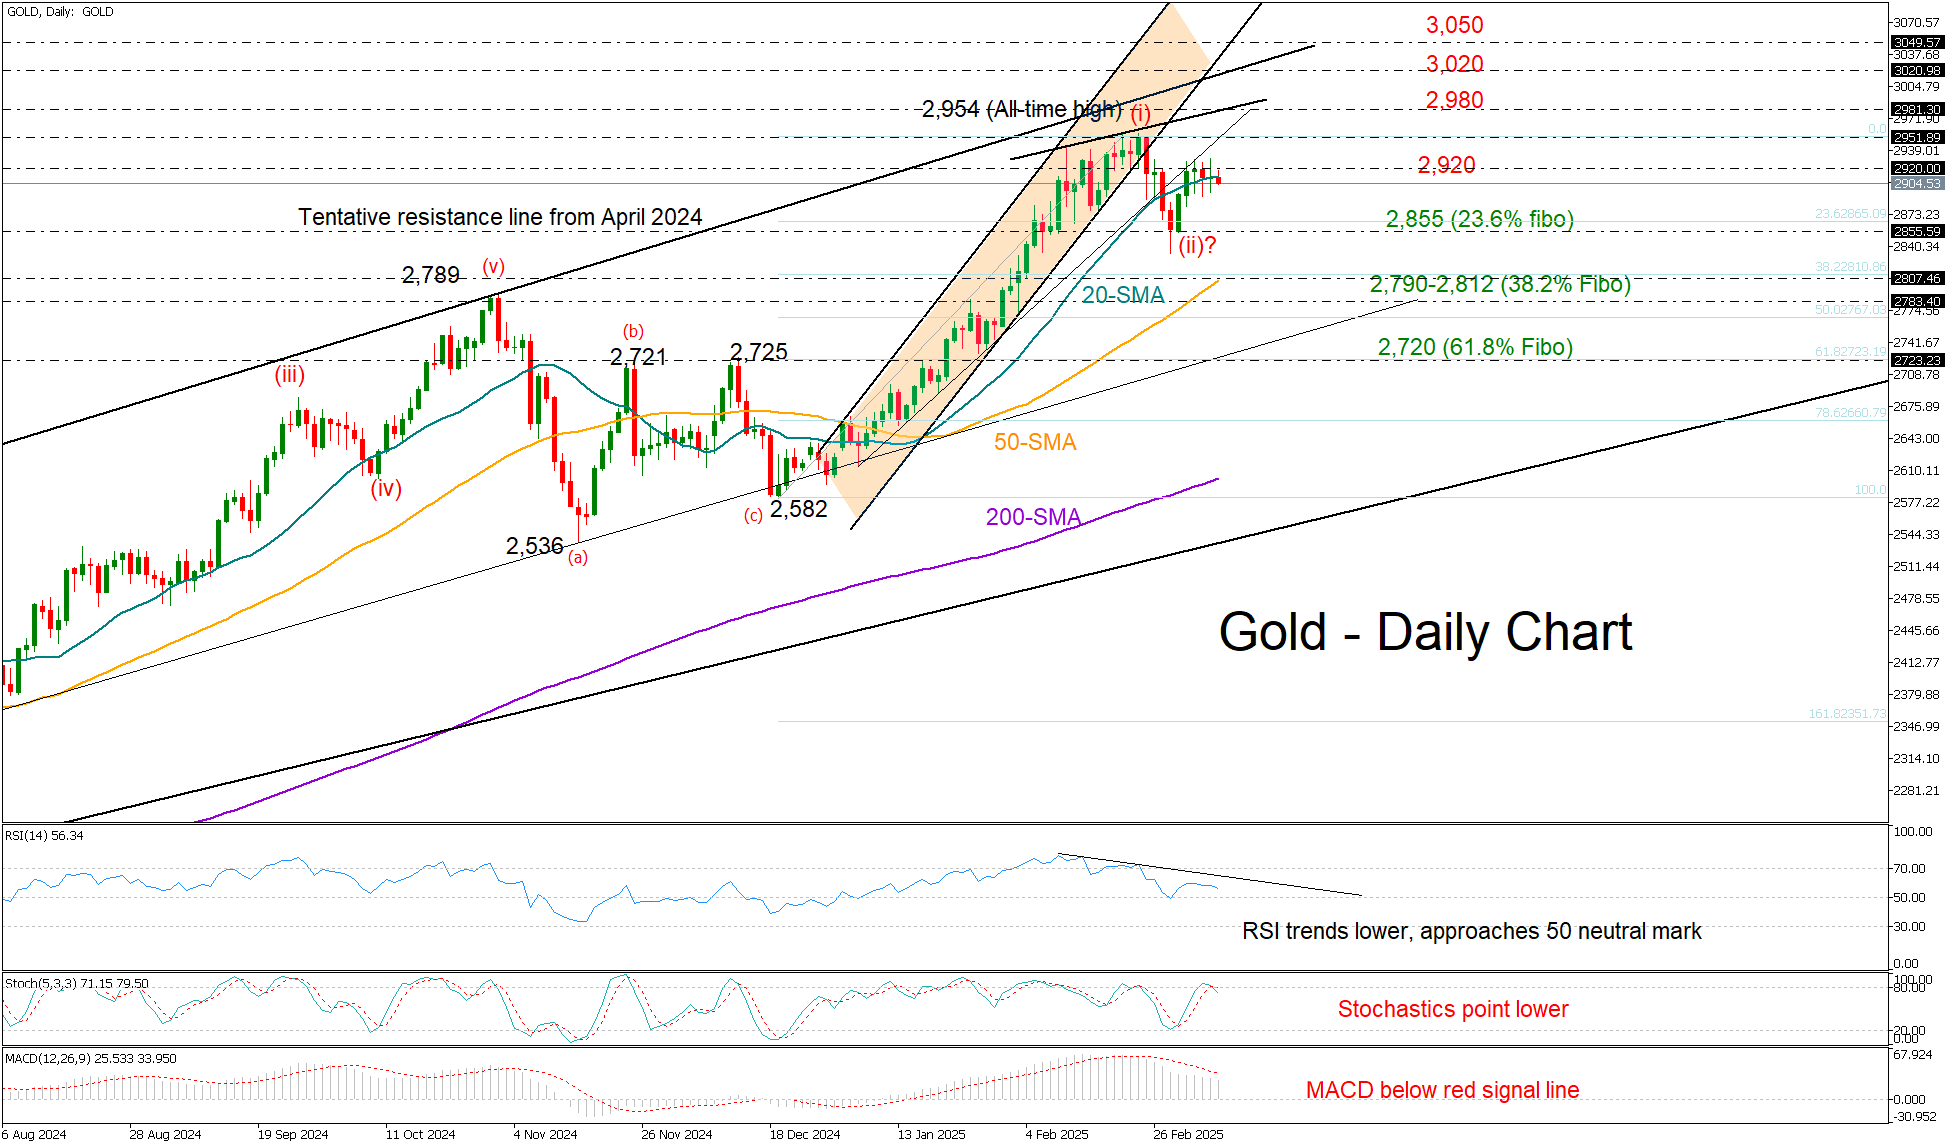
Gold in Neutral Mode, Awaiting Next Signal
- Gold faces low volatility around 20-day SMA.
- Short-term bias looks neutral-to-bearish.
Gold maintained a muted tone around the 2,900 mark as the new week kicked off, disregarding concerns about a potential US economic slowdown. The precious metal continues to hover around its 20-day simple moving average (SMA) for the fourth-consecutive trading day, awaiting a fresh directional catalyst.
Upside momentum quickly faded after a rebound attempt at the start of the month, reinforcing fears that the decline from the all-time high of 2,954 has yet to bottom out.
With the RSI trending downwards and the stochastic oscillator on the verge of a negative crossover, optimism for a bullish continuation is dimming. If the price closes below its 20-day SMA and the 2,900 round-level, attention will shift back to the 2,855 support area. A breach of this floor could pave the way for further downside toward the 50-day SMA, aligning with the 38.2% Fibonacci retracement level of the December-February rally at 2,810. A firm drop below the October 2024 high of 2,790 could accelerate losses toward the critical support zone at 2,720.
On the flip side, if gold manages to cross above the nearby resistance of 2,920, bullish forces could initially pause near the top of 2,954 before aiming for a fresh all-time high near 2,980. Beyond that, the rally might extend toward the key trendline region of 3,025-3,050.
In summary, gold currently maintains a neutral-to-bearish stance. A decisive break above or below the 20-day SMA will likely set the stage for the next significant market move.
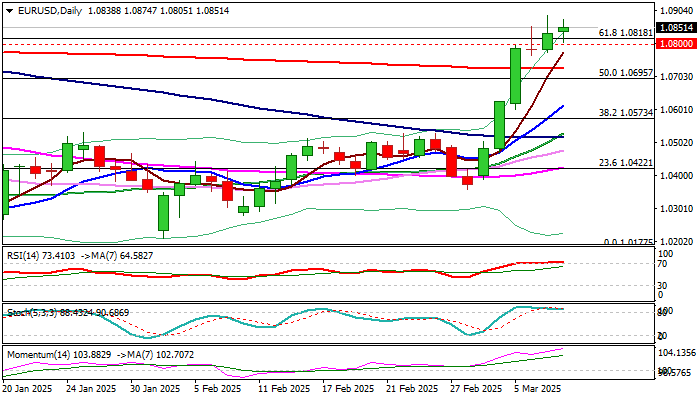
EUR/USD: Bulls Likely to Take a Breather After Last Week’s Strong Gains
The Euro keeps firm tone on Monday after surging over 4% last week and consolidating near new four-month high.
The single currency continues to ride on a fresh wave of dollar’s weakness, with last week’s gains being the biggest since the third week of March 2009, adding to significance of the latest rally.
Overall picture remains supportive, as fundamentals continue to work in favor of euro and technical studies are in full bullish configuration.
Last week’s close above important Fibo resistance at 1.0818 (61.8% of 1.1214/1.0177) contributed to bullish structure.
However, overbought conditions on daily chart suggest that bears may lose traction at this zone and pause for consolidation.
Broken 1.0818/00 supports (Fibo / psychological) offer immediate support, with broken 200DMA (1.0726) to ideally contain extended dips and mark positioning for fresh push higher and attack at 1.0969/1.1000 (Fibo 76.4% / psychological).
Res: 1.0888; 1.0900; 1.0969; 1.1000.
Sup: 1.0800; 1.0726; 1.0695; 1.0613.
USD/CHF: Hits Lowest in Three Months as Strong Safe Haven Demand Inflates Swiss Franc
USDCHF remains in red at the start of the week and hit new three-month low, as safe-haves Swiss franc continues to shine on growing concerns on overheated economic and geopolitical conditions.
Anticipated impact from tariffs on imports from Canada, Mexico and China in form of destabilization of flow of goods, higher prices which would lift inflation and push America closer to recession, continues fuel worries among investors.
The pair was down 2.5% last week, in the biggest weekly drop since the last week of July last year, as the dollar was hit strongly by growing concerns about global trade war and franc benefited from migration into safety.
Near-term action is weighed by a massive bearish weekly candle, Friday’s close below 200DMA (0.8815) and probe through pivotal Fibo support at 0.8787 (50% retracement of 0.8374/0.9200 upleg).
Firmly bearish daily technical studies (strong negative momentum, MA’s in bearish configuration with the latest formation of 10/100 bear-cross) contribute to negative outlook.
Close below cracked 0.8787 Fibo support to add to bearish signals and open way for extension towards 0.8700 zone (psychological / Fibo 61.8%).
Meanwhile, oversold conditions warn that bears may pause for consolidation, with 200DMA to ideally cap and extended upticks not to exceed broken Fibo 38.2% (0.8885) to keep larger bears in play.
Res: 0.8815; 0.8851; 0.8885; 0.8906.
Sup: 0.8762; 0.8725; 0.8690; 0.8615.
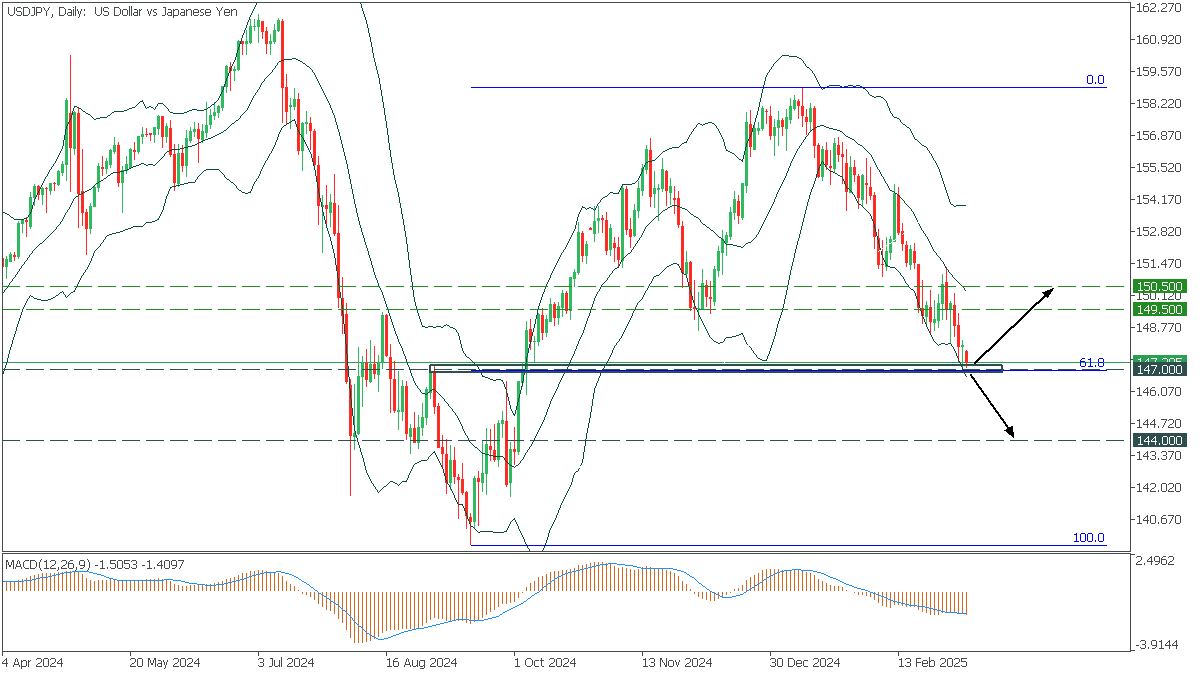
USDJPY: Critical Moment
USDJPY, Daily
In the Daily timeframe, USDJPY fell to 61.8 Fibonacci after a short-term rise, testing strong support. At the same time, the price has reached the lower Bollinger line, and the %R confirms a significant oversold condition, which makes a bounce possible.
- If the price breaks the 147,000 support area, it will fall to 144,000;
- However, if USDJPY rebounds, we can expect a rise to 149.500 and further to 150.500;