Sample Category Title
Bitcoin and Ethereum slide further as market reacts to strategic reserve letdown
Bitcoin has come under selling pressure in recent days, and slips closer to 80k mark. Ethereum, with a even worse outlook, has been struggling at its lowest levels since late 2023.
The broader cryptocurrency market has been in decline since early February, mirroring weak risk sentiment in the US financial markets. While there was a brief revival earlier this month after US President Donald Trump announced plans to establish a "strategic reserve" for cryptos, that optimism quickly faded once details of the initiative were revealed.
The market’s disappointment stemmed from the fact that the reserve would be funded solely by those seized in criminal and civil forfeiture cases, with no actual government purchases planned. Many investors had initially hoped for a more aggressive accumulation strategy.
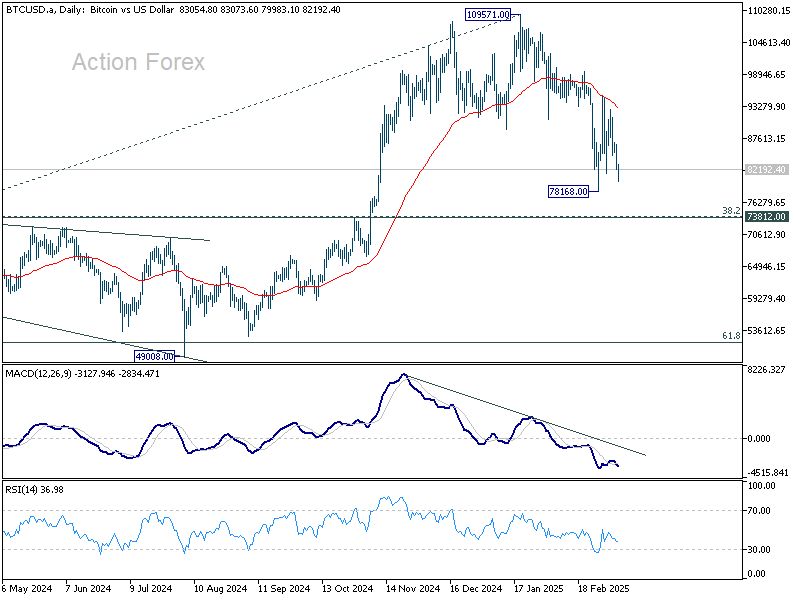
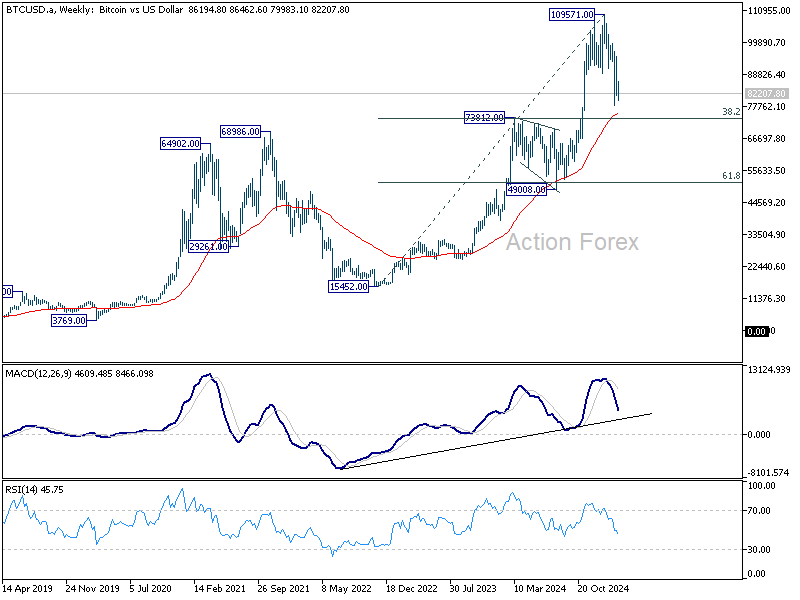
Technically, Bitcoin is still holding above 55 W EMA (now at 75052), which is slightly above 73812 cluster support (38.2% retracement of 15452. to 109571 at 73617). Price actions from 109571 high could still be seen as just forming a sideway consolidation pattern.
However, decisive break of 73k-75k support zone will argue that Bitcoin is already in a medium term downtrend, even still as correction. In the bearish case, Bitcoin could head to around 50k mark, that is, 49008 support and 61.8% retracement at 51405,before bottoming.
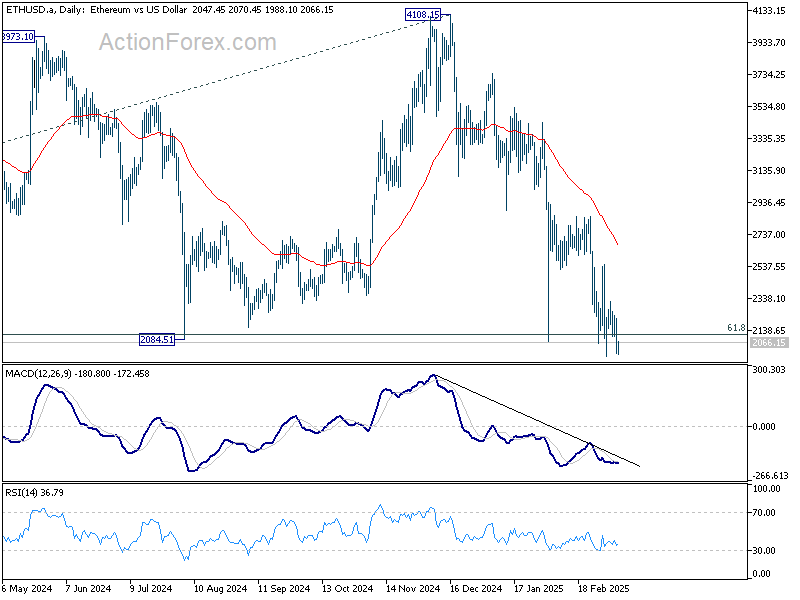
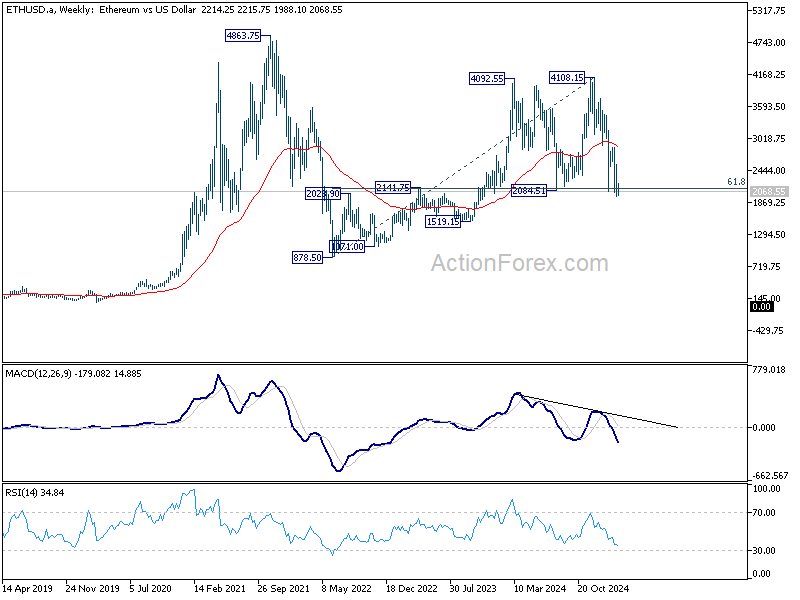
Outlook for Ethereum is even worse with focus now on 2000 psychological level, which is close to 2084.51 cluster support (61.8% retracement of 878.50 to 4108.15 at 2112.22).
Sustained break of this support zone around 2000 will raise the chance that fall from 4108.15 is the third leg of the decline from 4863.75 (2021 high). That could set up deeper medium term fall through 878.50 (2022 low).
Euro Strengthens—EUR/USD Begins Smooth Uptrend
Key Highlights
- EUR/USD started a fresh increase above the 1.0750 resistance zone.
- A short-term rising channel with support at 1.0800 on the 4-hour chart.
- GBP/USD surged above the 1.2850 and 1.2880 resistance levels.
- Crude oil prices dived below the $68.00 support zone.
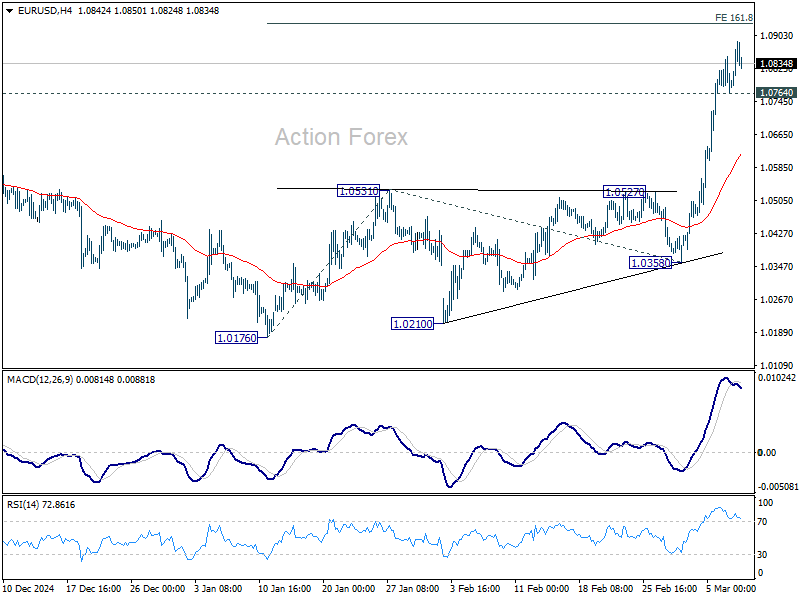
EUR/USD Technical Analysis
The Euro started a decent increase above the 1.0750 resistance against the US Dollar. EUR/USD broke the 1.0800 and 1.0820 resistance levels.
Looking at the 4-hour chart, the pair settled above the 1.0800 level, the 100 simple moving average (red, 4-hour), and the 200 simple moving average (green, 4-hour). The pair even climbed above the 1.0850 zone before the bears appeared.
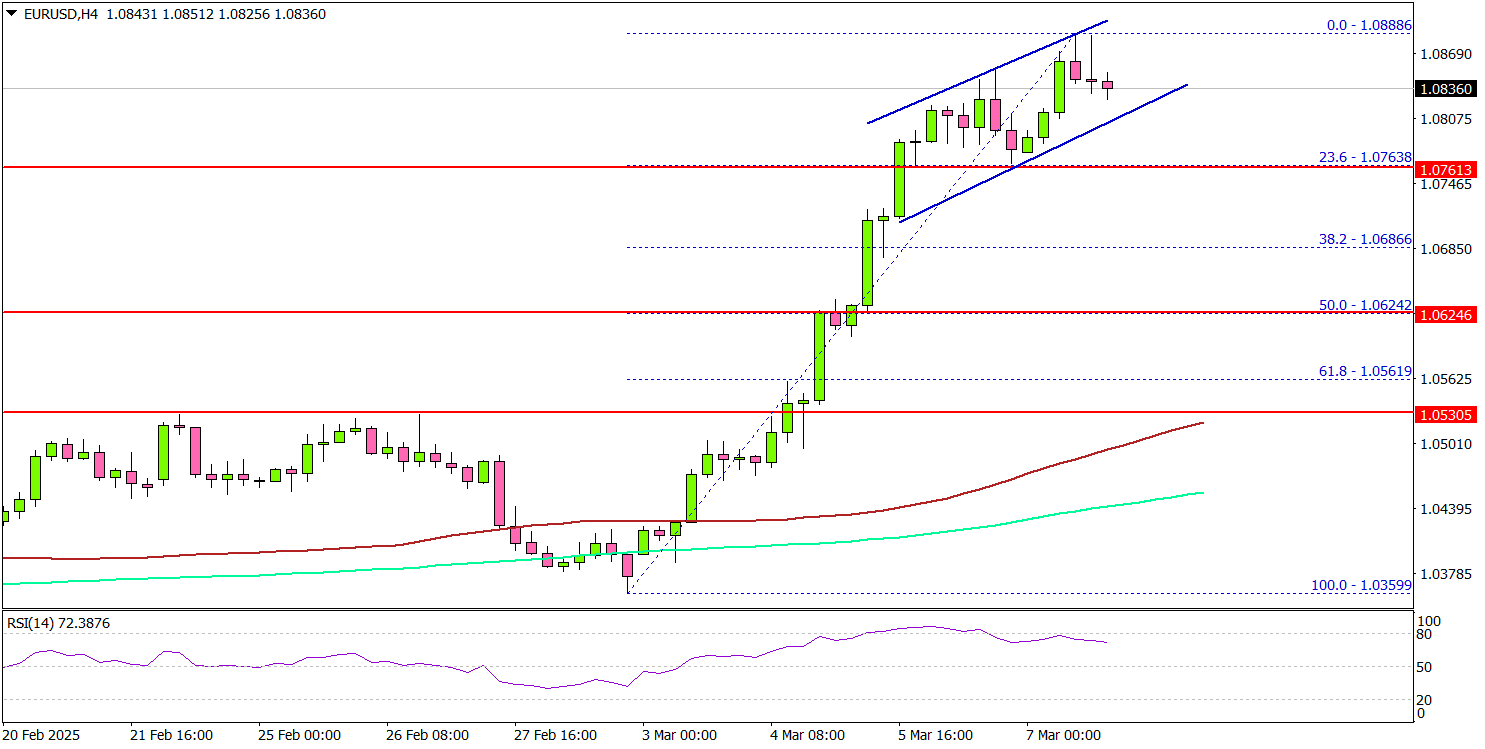
It tested the 1.0880 zone. On the upside, the pair seems to be facing hurdles near the 1.0880 level. The next major resistance is near the 1.0920 level.
The main resistance is now forming near the 1.0950 zone. Any more gains might send the pair toward the 1.1000 zone. On the downside, immediate support sits near the 1.0800 level. There is also a short-term rising channel with support at 1.0800 on the same chart.
The next key support sits near the 1.0765 level. Any more losses could send the pair toward the 1.0750 level. A close above the 1.0750 level could set the tone for another increase. In the stated case, the pair could even clear the 1.0720 resistance.
Looking at GBP/USD, the pair also started a decent increase and the pair even cleared the 1.2880 resistance zone.
Upcoming Economic Events:
- Germany’s Trade Balance for Jan 2025 - Forecast €21B, versus €20.7B previous.
Japan’s nominal wages rises 2.8% yoy in Jan, real wages fall -1.8% yoy
Japan’s labor cash earnings rose 2.8% yoy in January, falling short of market expectations of 3.2% yoy. Nominal wage growth remained positive for the 37th month.
Real wages, adjusted for inflation, fell -1.8% yoy, reversing two months of slight gains. The decline was largely driven by a sharp rise in consumer inflation.
The inflation rate used by the Ministry of Health, Labor and Welfare to calculate real wages—which includes fresh food prices but excludes rent—accelerated to 4.7% yoy, its highest level since January 2023.
Regular pay, or base salary, rose 3.1% yoy, the largest gain since 1992. This was overshadowed by a sharp -3.7% yoy decline in special payments, which consist largely of one-off bonuses.
China’s inflation turns negative, but seasonal factors skew the picture
Released over the weekend, China’s consumer inflation dipped into negative territory for the first time in over a year, with February’s CPI coming in at -0.7% yoy, weaker than the expected -0.5% yoy, and a sharp reversal from January’s 0.5% yoy gain.
Core CPI, which strips out food and energy prices, also slipped by -0.1% yoy—its first decline since January 2021—signaling weak underlying demand.
On a month-over-month basis, consumer prices fell -0.2%, more than the expected -0.1%, reversing some of January’s 0.7% increase.
While the decline may raise concerns about deflationary pressures, NBS attributed much of the drop to seasonal distortions tied to the timing of the Lunar New Year. Stripping out this factor, NBS estimates that CPI actually rose 0.1% yoy.
Given these distortions, a clearer picture of China’s inflation trajectory will likely emerge in March when seasonal effects fade.
Meanwhile, producer prices remained in contraction for the 29th consecutive month, with PPU declining -2.2% yoy, slightly better than January’s -2.3% yoy but still below expectations of -2.1% yoy.
USDCHF Wave Analysis
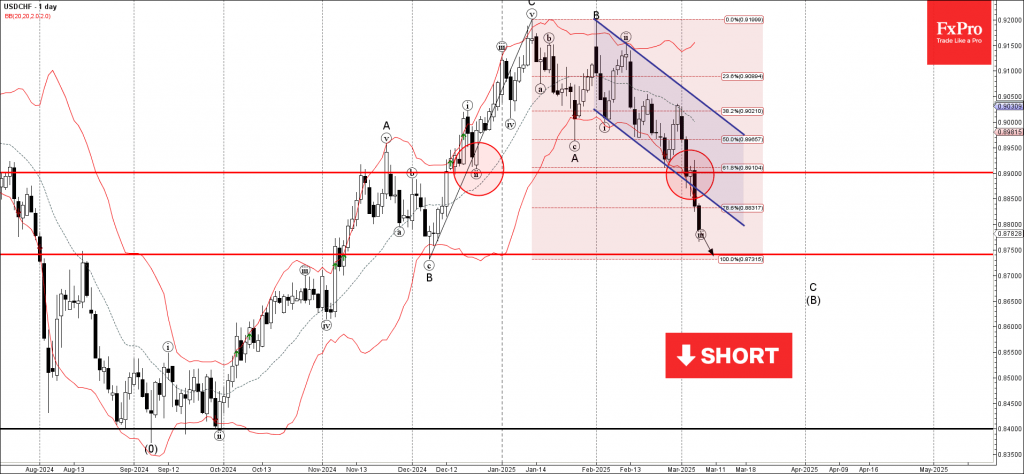
USDCHF: ⬇️ Sell
- USDCHF broke the support zone
- Likely to fall to support level 0.8750
USDCHF currency pair recently broke the support zone between the support level 0.8900 (which has been reversing the price from December), the support trendline of the daily down channel from January and the 61.8% Fibonacci correction of the upward impulse from December.
The breakout of this support zone accelerated the active strong downward impulse wave C of the ABC correction (B) from January.
USDCHF currency pair can be expected to fall further to the next support level 0.8750 (the monthly low from December and the target for the completion of wave C).
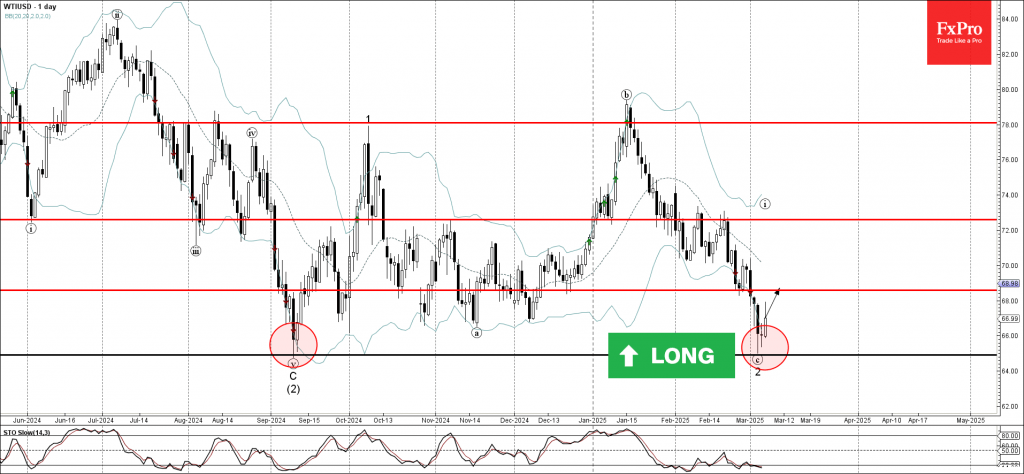
WTI Crude Oil Wave Analysis
WTI crude oil: ⬆️ Buy
- WTI reversed from the multi-month support level 64.90
- Likely to rise to resistance level 68.60
WTI crude oil recently reversed sharply from the powerful multi-month support level 64.90, which stopped the previous sharp downtrend at the start of September.
The upward reversal from the support level 64.90 will likely form the daily Japanese candlesticks reversal pattern Morning Star Doji.
Given the strength of the support level 64.90 and the oversold daily Stochastic, WTI crude oil can be expected to rise further to the next resistance level 68.60.
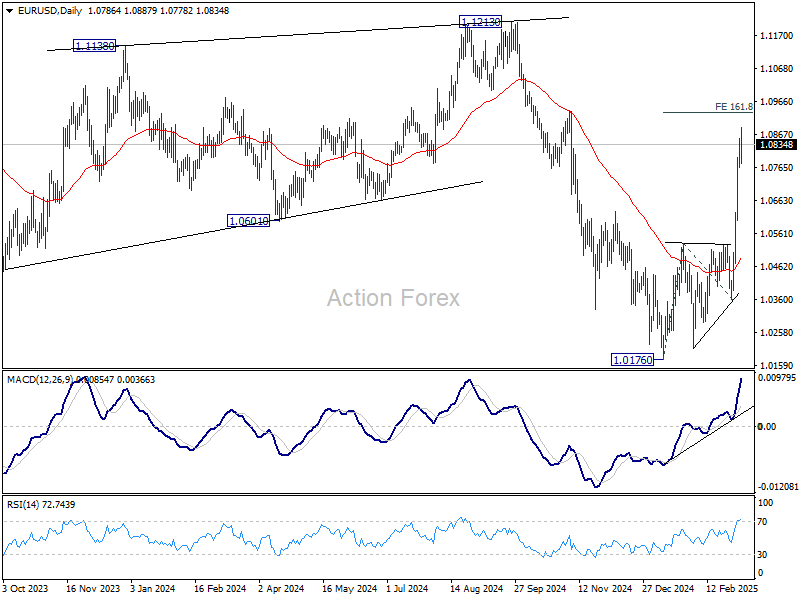
EUR/USD Weekly Outlook
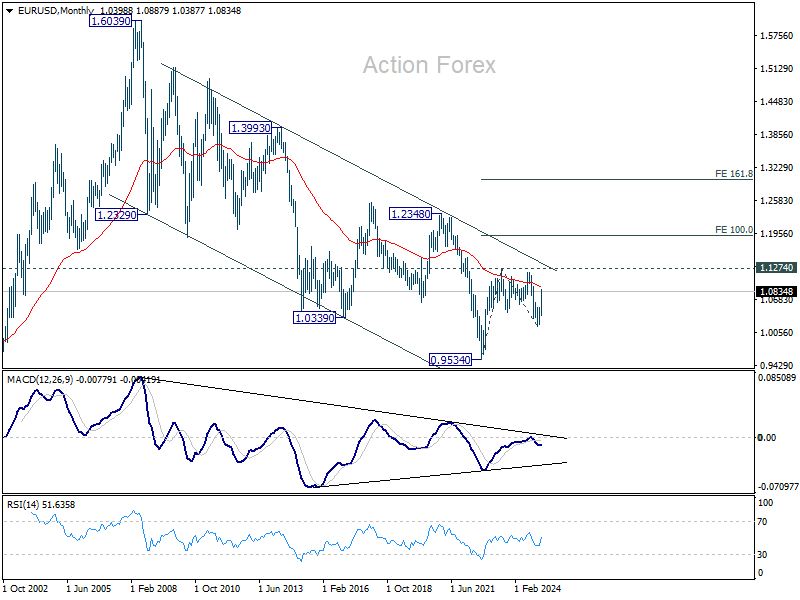
EUR/USD's rebound from 1.0176 resumed last week with strong upside acceleration. Initial bias stays on the upside this week for 161.8% projection of 1.0176 to 1.0531 from 1.0358 at 1.0932. Firm break there will pave the way back to 1.1274 key resistance next. On the downside, below 1.0764 minor support will turn bias neutral and bring consolidations, before staging another rise.
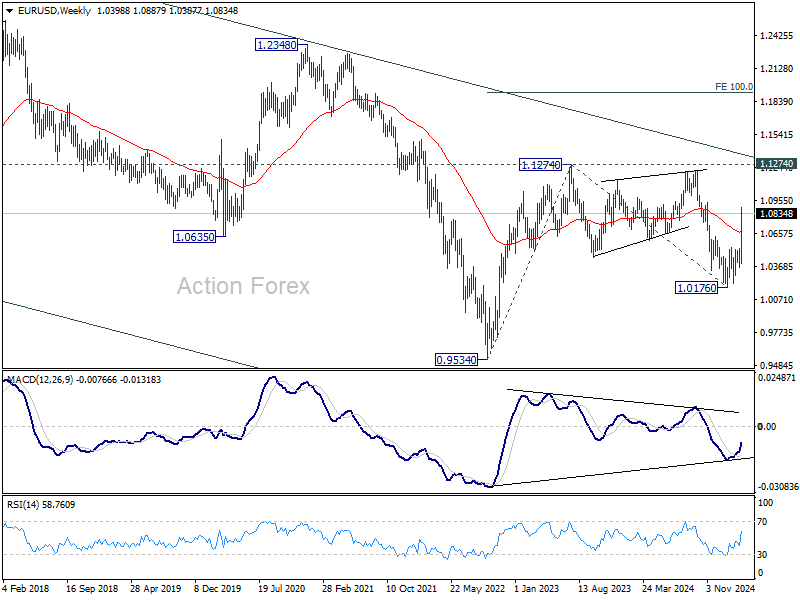
In the bigger picture, the strong break of 55 W EMA (now at 1.0675) suggests that fall from 1.1274 (2024 high) has completed as a three wave correction to 1.0176. Rise from 0.9534 is still intact, and might be ready to resume. Decisive break of 1.1274 will target 100% projection of 0.9534 to 1.1274 from 1.0176 at 1.1916. Also, that will send EUR/USD through a multi-decade channel resistance will carries larger bullish implication. This will now be the favored case as long as 1.0531 resistance turned support holds.
In the long term picture, the case of long term bullish reversal is building up. Sustained break of falling channel resistance (now at around 1.1400) will argue that the down trend from 1.6039 (2008 high) has completed at 0.9534. A medium term up trend should then follow even as a corrective move. Nevertheless, rejection by the channel resistance will keep outlook bearish.
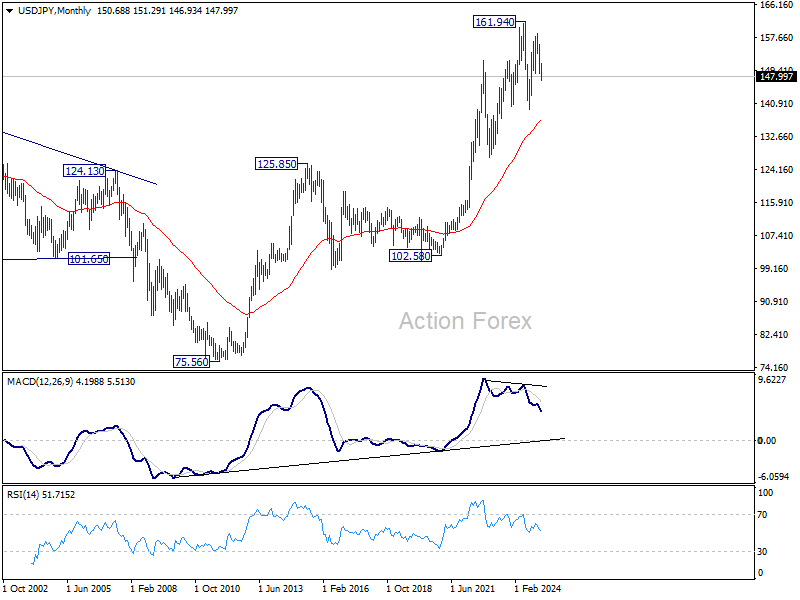
USD/JPY Weekly Outlook
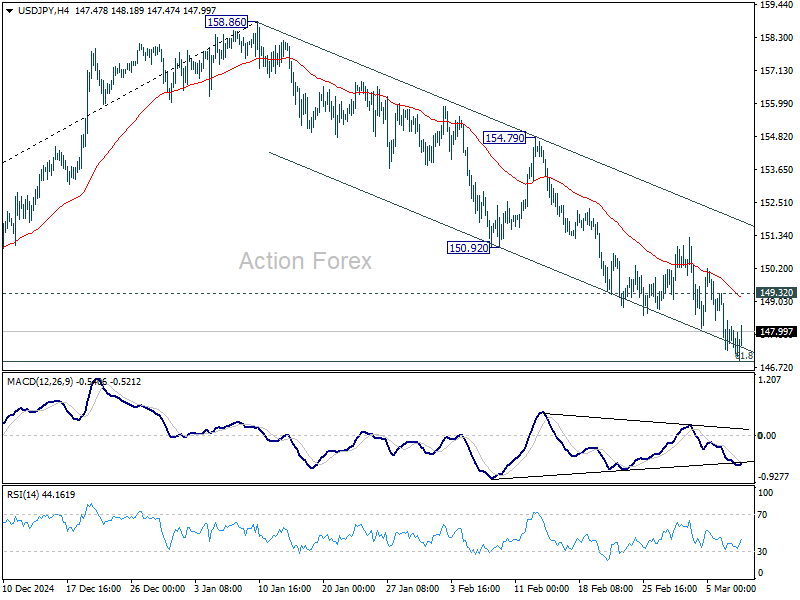
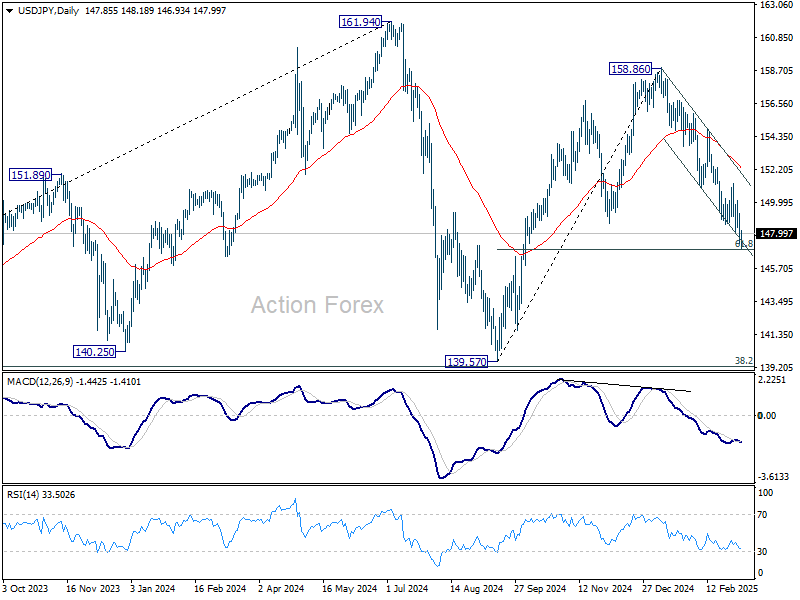
USD/JPY's fall from 158.86 extended lower last week but downside momentum was somewhat limited by near term falling channel. Still, initial bias stays on the downside this week. Sustained trading below 61.8% retracement of 139.57 to 158.86 at 146.32 will pave the way to 139.57 support. On the upside, 149.32 minor resistance will turn intraday bias neutral and bring consolidations again, before staging another fall.
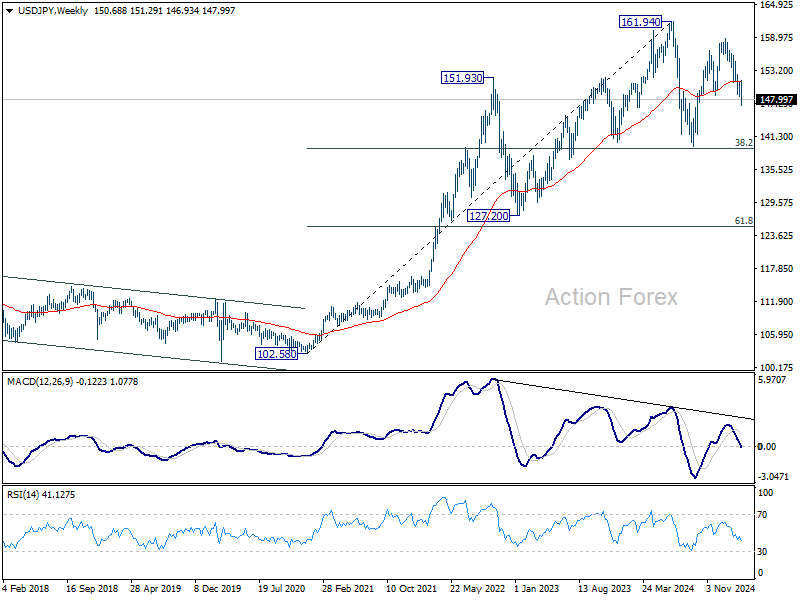
In the bigger picture, price actions from 161.94 are seen as a corrective pattern to rise from 102.58 (2021 low), with fall from 158.86 as the third leg. Strong support should be seen from 38.2% retracement of 102.58 to 161.94 at 139.26 to bring rebound. However, sustained break of 139.26 would open up deeper medium term decline to 61.8% retracement at 125.25.
In the long term picture, it's still early to conclude that up trend from 75.56 (2011 low) has completed. A medium term corrective phase should have commenced, with risk of deep correction towards 55 M EMA (now at 136.88).
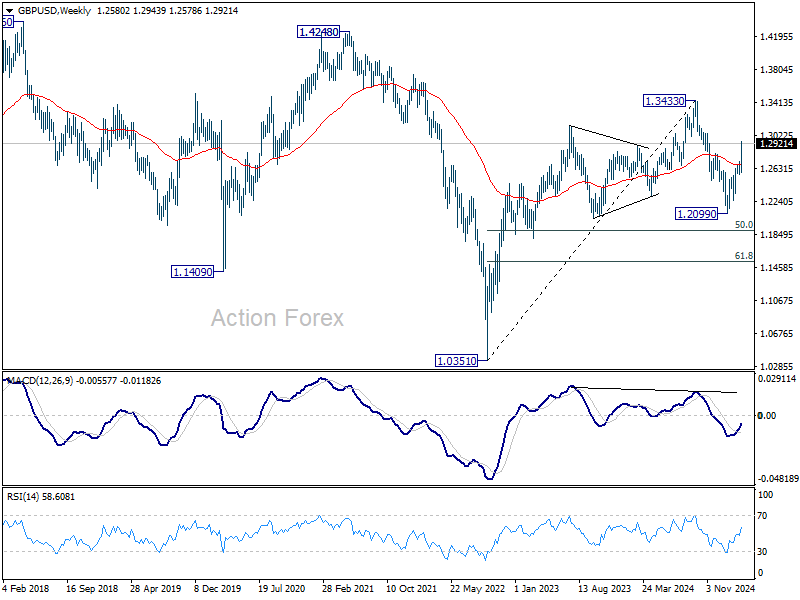
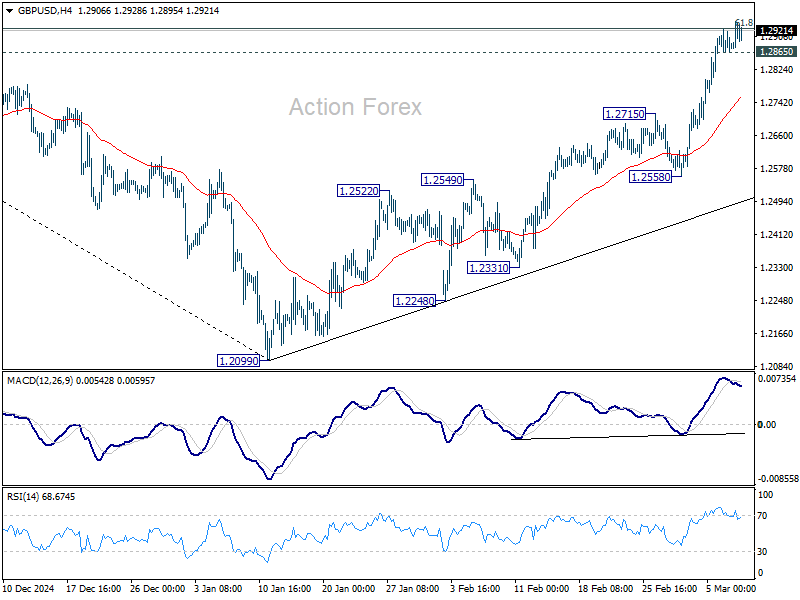
GBP/USD Weekly Outlook
GBP/USD's rally from 1.2099 resumed last week and the development argues that fall from 1.3433 has already completed. Initial bias stays on the upside this week. Sustained break of 61.8% retracement of 1.3433 to 1.2099 at 1.2923 will pave the way back to 1.3433 high. On the downside, below 1.2865 minor support will turn intraday bias neutral again and bring consolidations.
In the bigger picture, up trend from 1.3051 (2022 low) is not completed. Resumption is expected after corrective pattern from 1.3433 completes. Next target will be 1.4248 key resistance. This will now remain the favored case as long as 1.2099 support holds.
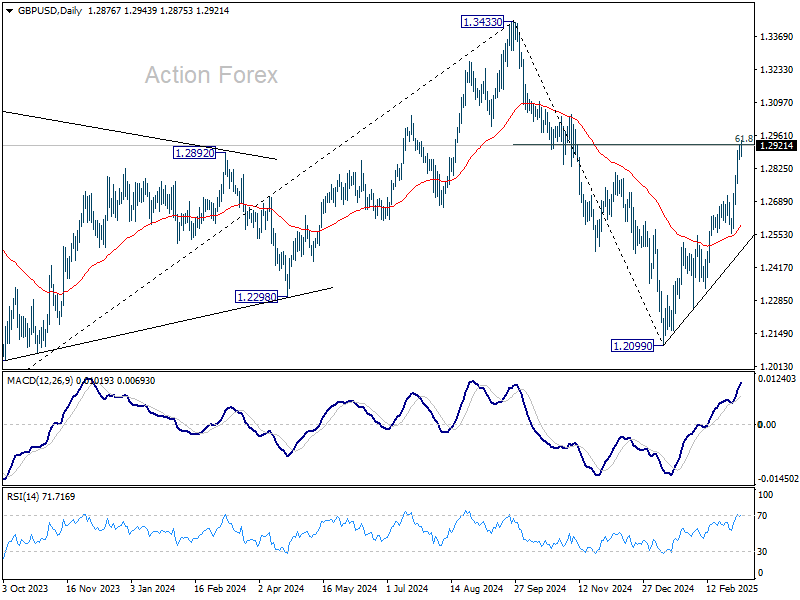
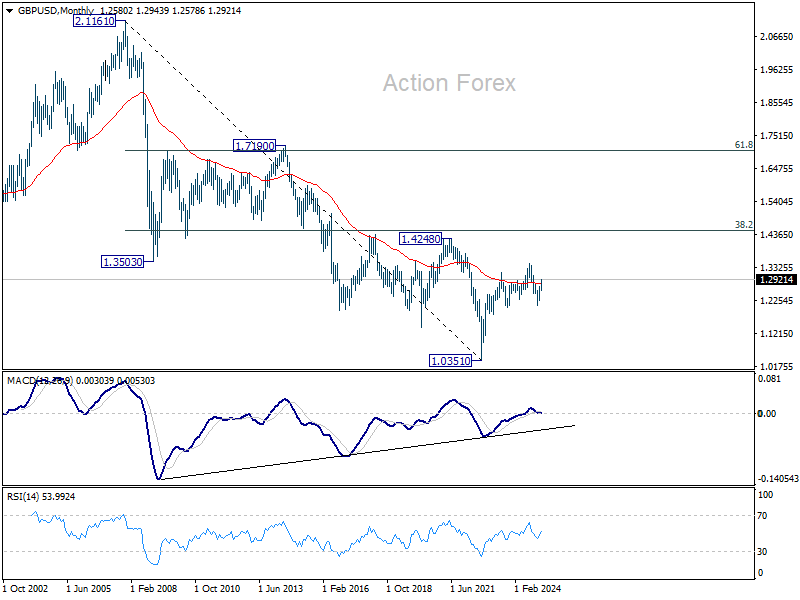
In the long term picture, price actions from 1.0351 (2022 low) are seen as a corrective pattern to the long term down trend from 2.1161 (2007 high) only. Outlook will be neutral at best as long as 1.4248 structural resistance holds, even in case of strong rebound.