Sample Category Title
USD/CHF Weekly Outlook
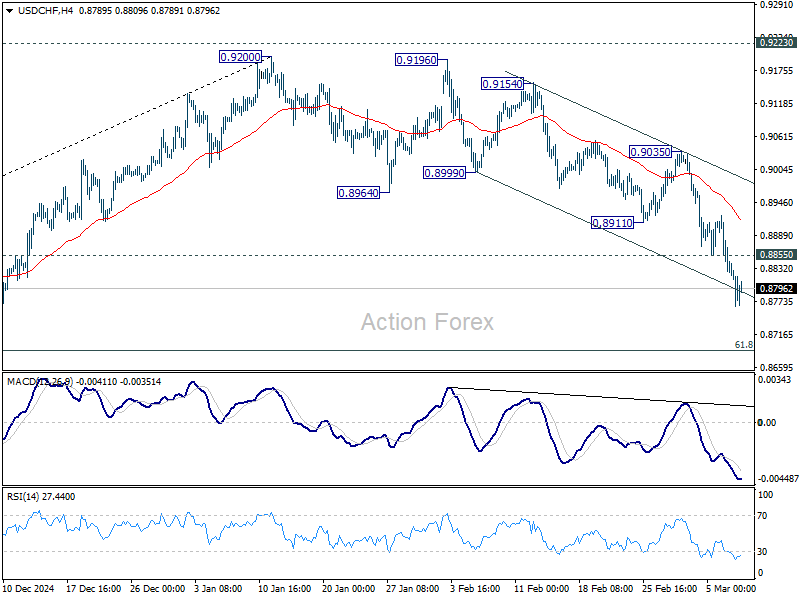
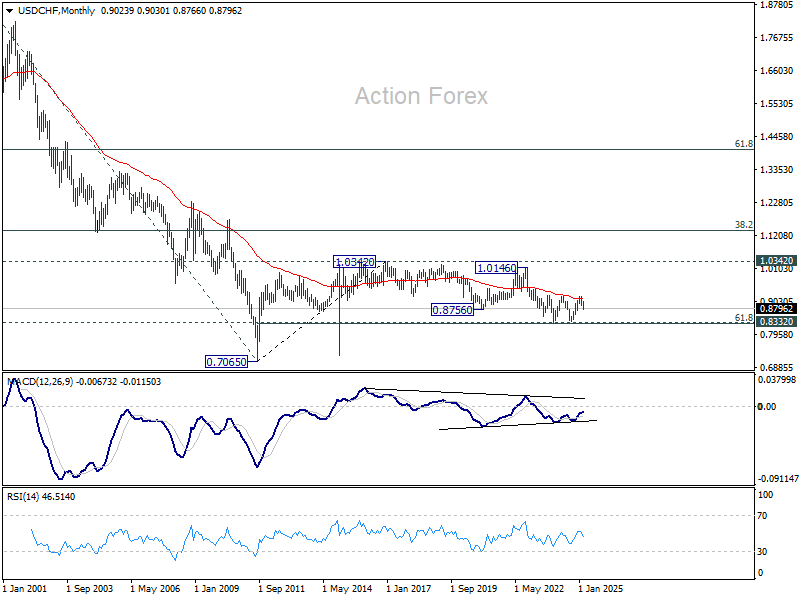
USD/CHF's extended decline last week indicates that rise from 0.8374 has already completed at 0.9200, after rejection by 0.9223 key resistance. Initial bias stays on the downside this week for 61.8% retracement of 0.8374 to 0.9200 at 0.8690. Sustained break there will pave the way back to 0.8374 support. On the upside, above 0.8855 minor resistance will turn intraday bias neutral and bring consolidations, before staging another fall.
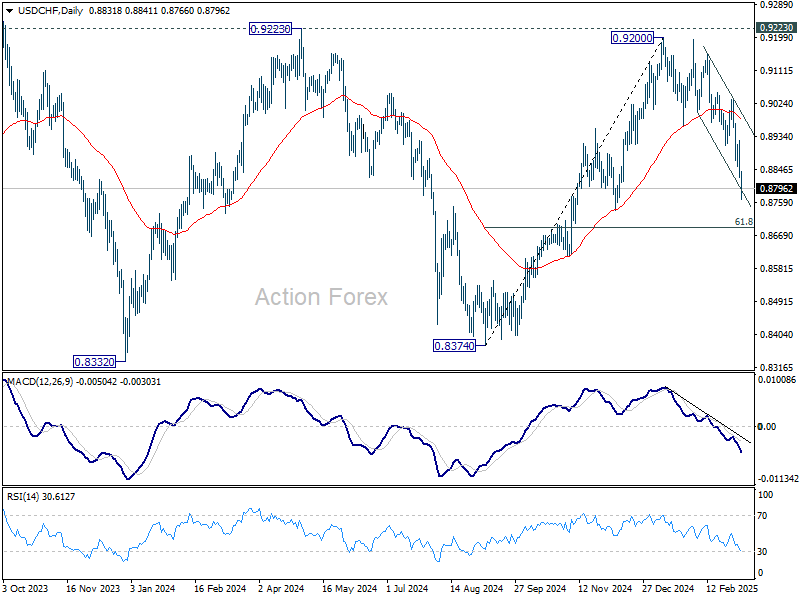
In the bigger picture, rejection by 0.9223 key resistance keep medium term outlook bearish. That is, larger fall from 1.0342 (2017 high) is not completed yet. Firm break of 0.8332 (2023 low) will confirm down trend resumption.
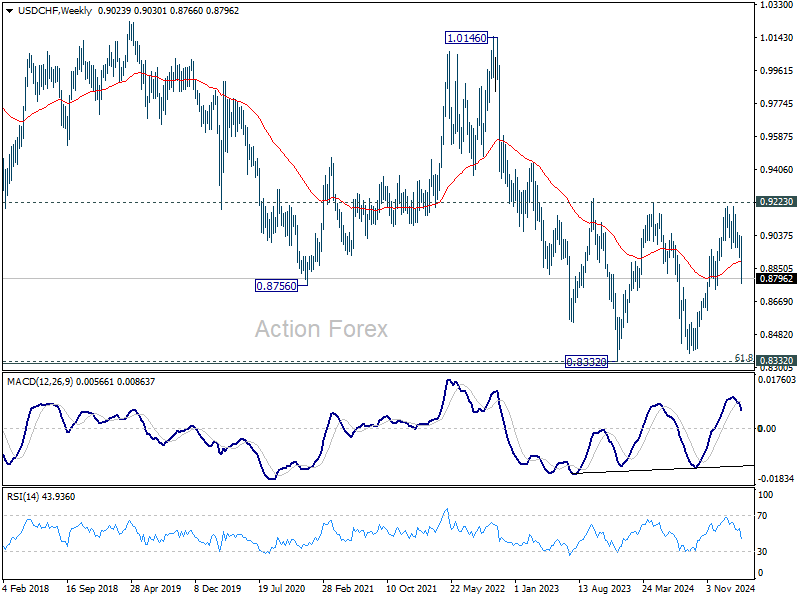
In the long term picture, price action from 0.7065 (2011 low ) are seen as a corrective pattern to the multi-decade down trend from 1.8305 (2000 high). Fall from 1.0342 (2016 high) is seen as the second leg. Sustained break of 55 M EMA (now at 0.9115) will indicate that the third leg has already started. However, rejection by 55 M EMA again, followed by break of 61.8% retracement of 0.7065 to 1.0342 at 0.8317, will pave the way back to 0.7065.
AUD/USD Weekly Report
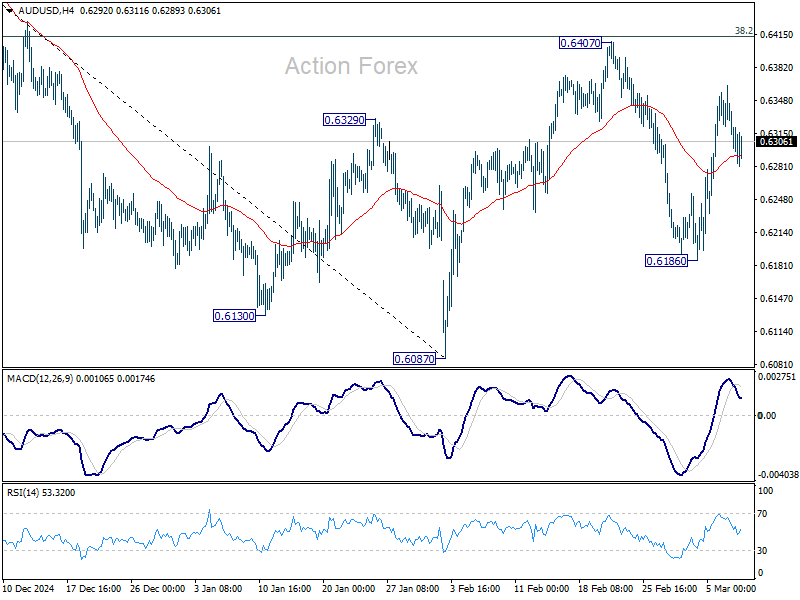
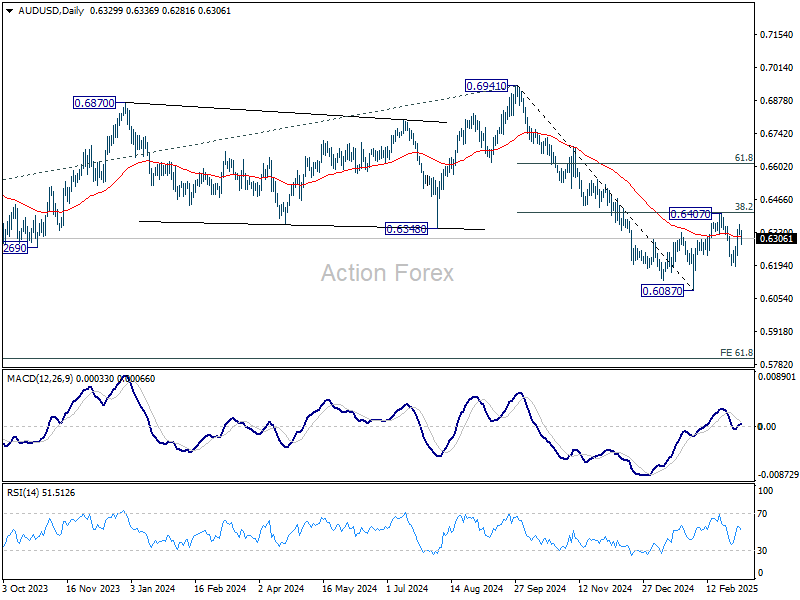
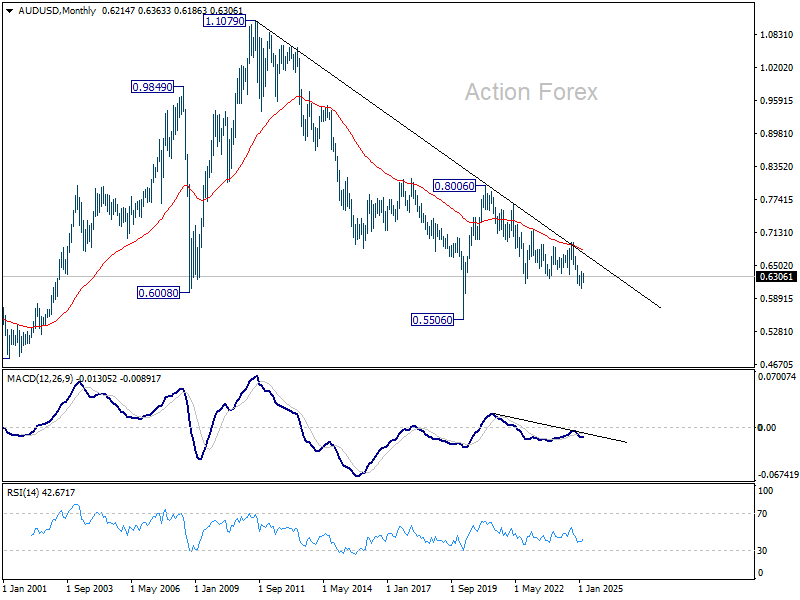
AUD/USD's strong rebound last week mixed up the near term outlook. Initial bias stays neutral this week first. On the downside, break of 0.6186 will target 0.6087 support first. Firm break there will resume whole decline from 0.6941. However, sustained trading above 38.2% retracement of 0.6941 to 0.6087 at 0.6413 will raise the chance of near term bullish reversal, and target 61.8% retracement at 0.6615 next.
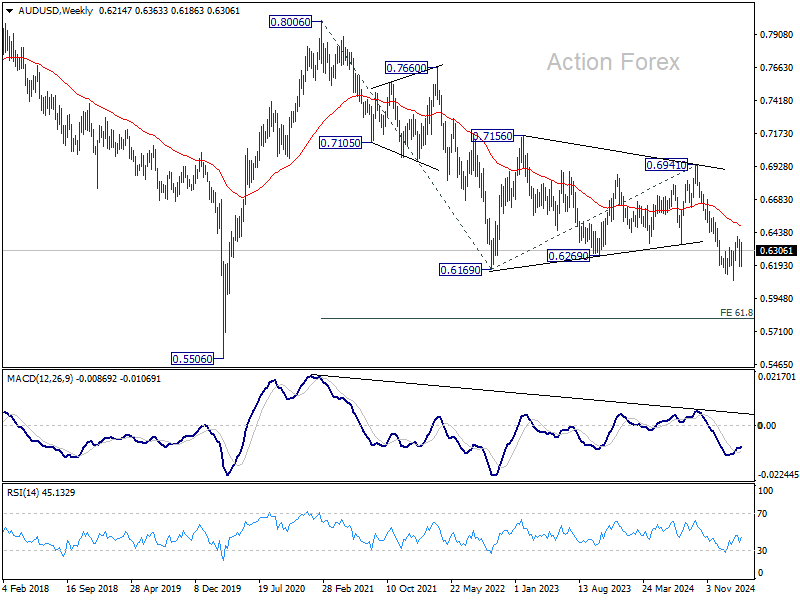
In the bigger picture, fall from 0.6941 (2024 high) is seen as part of the down trend from 0.8006 (2021 high). Next medium term target is 61.8% projection of 0.8006 to 0.6169 from 0.6941 at 0.5806. In any case, outlook will stay bearish as long as 55 W EMA (now at 0.6487) holds.
In the long term picture, prior rejection by 55 M EMA (now at 0.6823) is taken as a bearish signal. But for now, fall from 0.8006 is still seen as the second leg of the corrective pattern from 0.5506 long term bottom (2020 low). Hence, in case of deeper fall, strong support should emerge above 0.5506 to contain downside to bring reversal. However, this view is subject to adjustment if current decline accelerates further.
USD/CAD Weekly Outlook
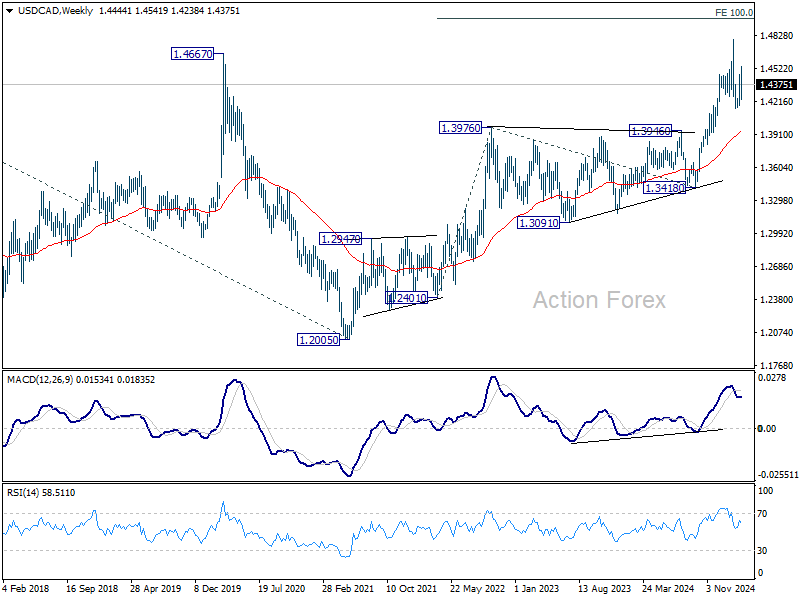
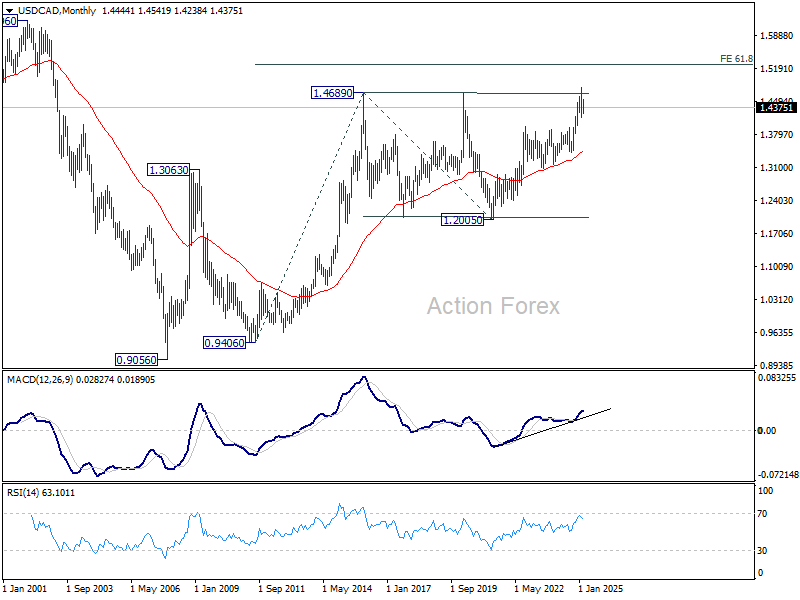
USD/CAD reversed after edging higher to 1.4541 last week but subsequent decline was contained at 1.4238. Initial bias is turned neutral this week first. Overall, corrective pattern from 1.4791 should still be extending. Below 1.3248 will target 1.4150 support and possibly below. Meanwhile, break of 1.4541 will bring stronger rise back to retest 1.4791.
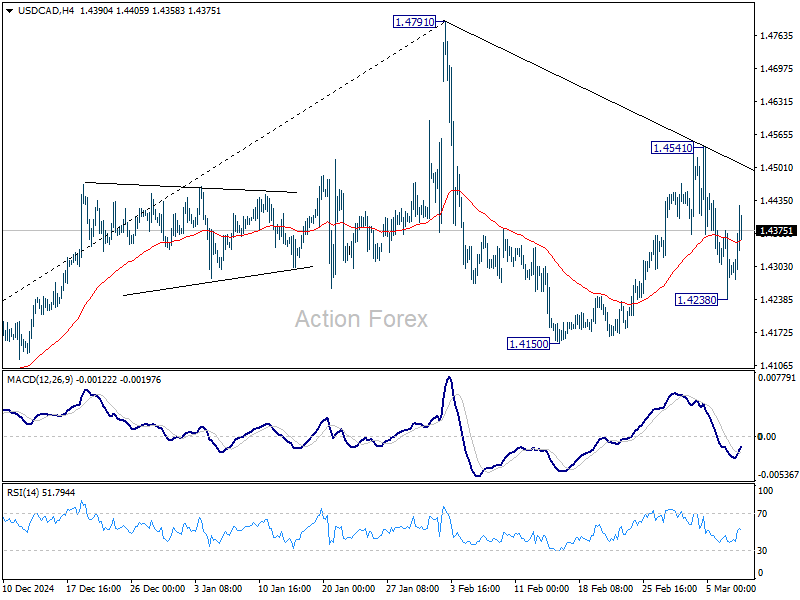
In the bigger picture, long term up trend is tentatively seen as resuming with prior breach of 1.4667/89 key resistance zone (2020/2015 highs). Next target is 100% projection of 1.2401 to 1.3976 from 1.3418 at 1.4993. This will remain the favored case as long as 1.3976 resistance turned support holds (2022 high), even in case of deep pullback.
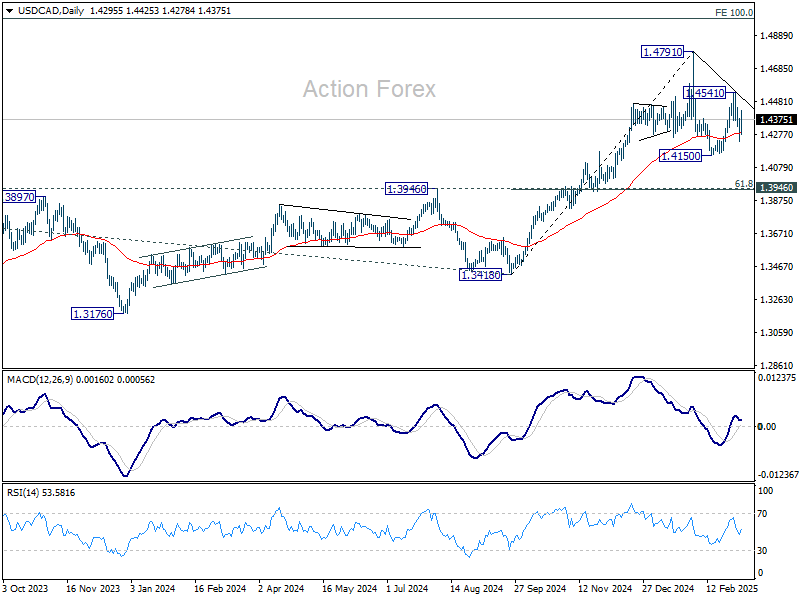
In the longer term picture, up trend from 0.9506 (2007 low) is in progress and possibly resuming. Next target is 61.8% projections of 0.9406 to 1.4689 from 1.2005 at 1.5270. While rejection by 1.4689 will delay the bullish case, further rally will remain in favor as long as 55 M EMA (1.3430) holds.
GBP/JPY Weekly Outlook
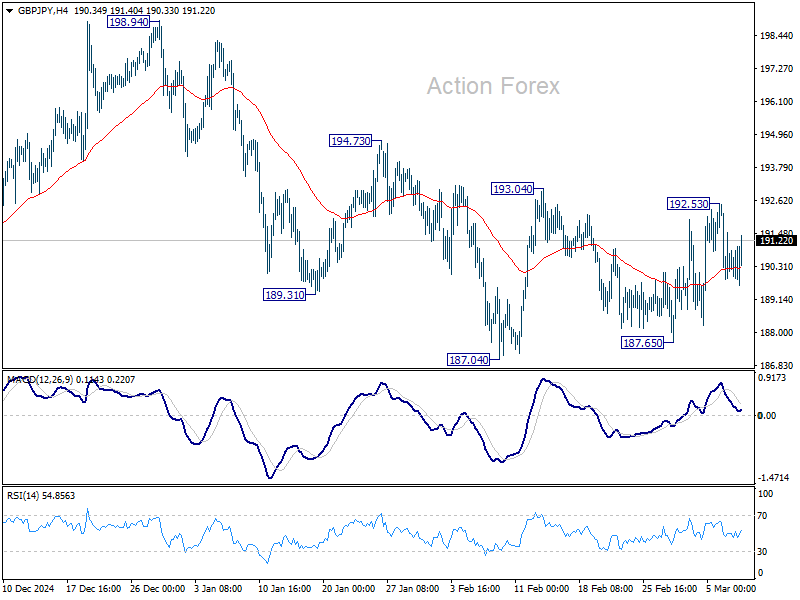
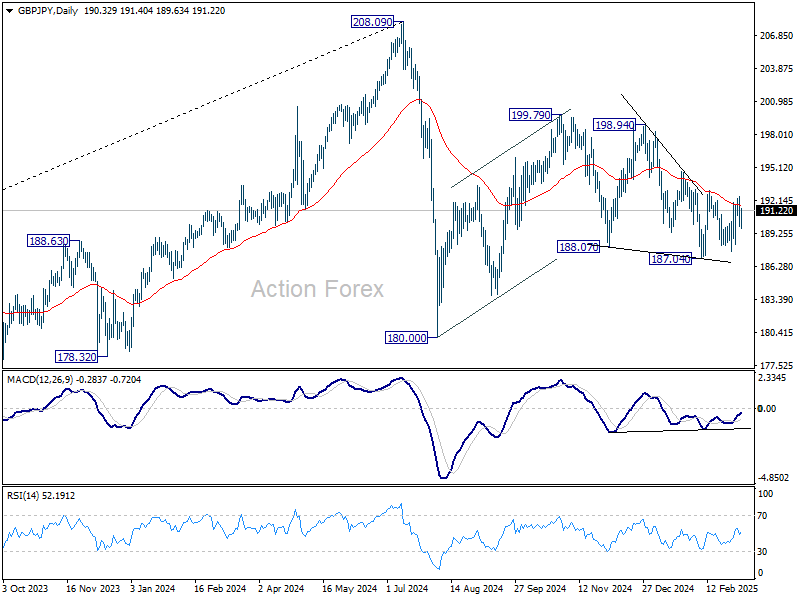
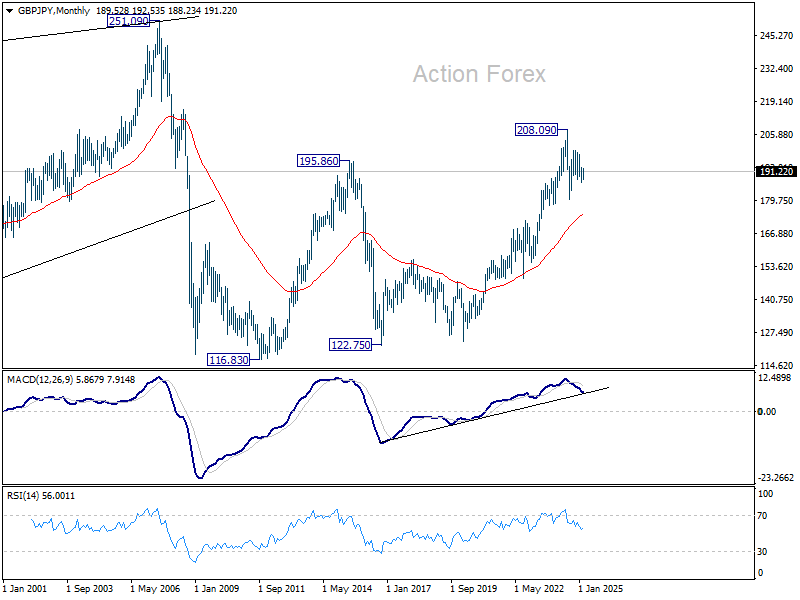
Range trading continued in GBP/JPY last week and outlook is unchanged. Initial bias remains neutral this week first. On the upside, firm break of 193.04 will resume the rebound from 187.04 to 194.73 resistance, and then 198.94. On the downside, firm break of 187.04 will extend the fall from 199.79 towards 180.00 support. Overall, corrective pattern from 180.00 might still be extending.
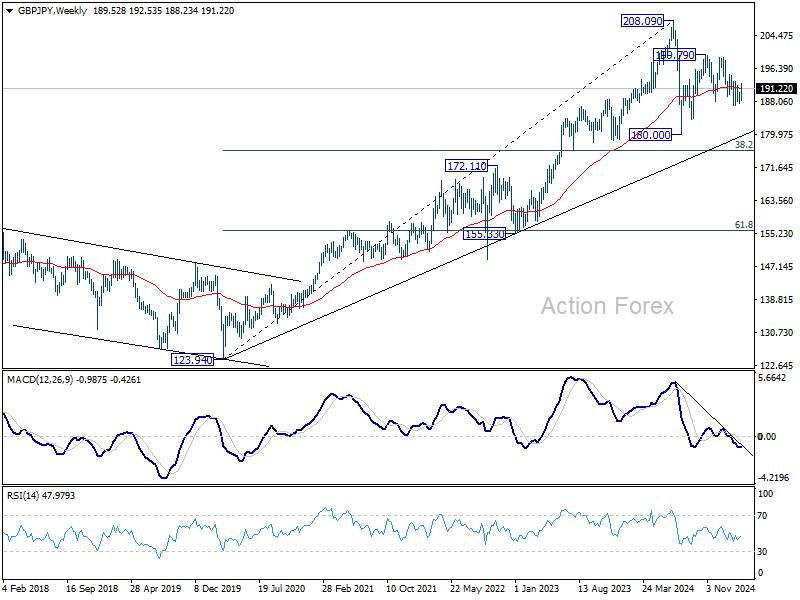
In the bigger picture, price actions from 208.09 are seen as a correction to rally from 123.94 (2020 low). Strong support should be seen from 38.2% retracement of 123.94 to 208.09 at 175.94 to contain downside. However, sustained break of 152.11 will bring deeper fall even still as a correction.
In the longer term picture, while a medium term top was formed at 208.09 (2024 high), it's still early to conclude that the up trend from 122.75 (2016 low) has completed. But GBP/JPY is at least in a medium term corrective phase, with risk of correction to 55 M EMA (now at 173.92).
EUR/JPY Weekly Outlook
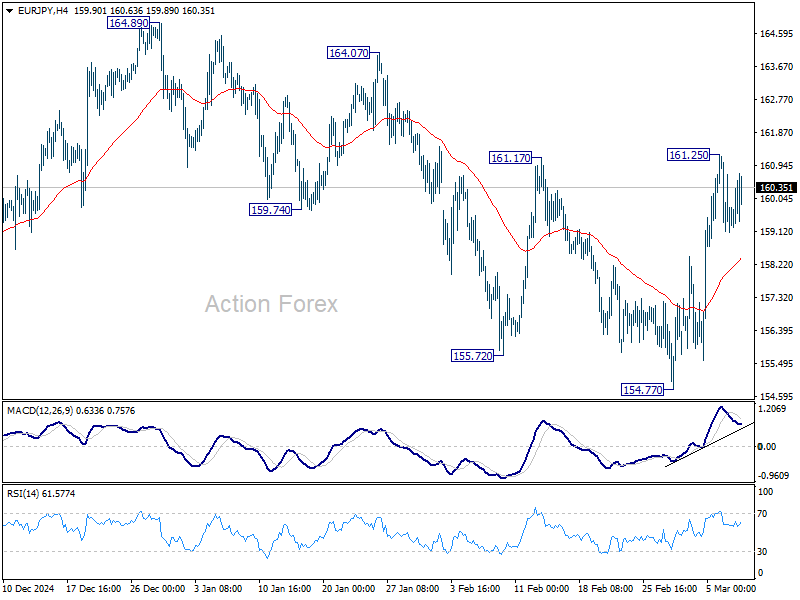
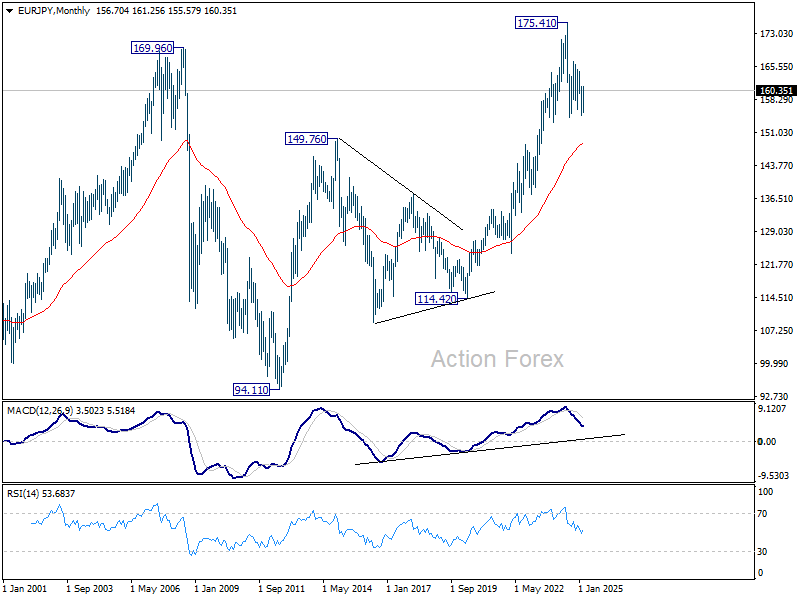
EUR/JPY rebounded to as high as 161.25 last week but turned sideway since then. Initial bias remains neutral this week. Overall development suggest that consolidation pattern from 154.40 is extending with another rising leg. On the upside, break of 161.25 will target 164.89 resistance.
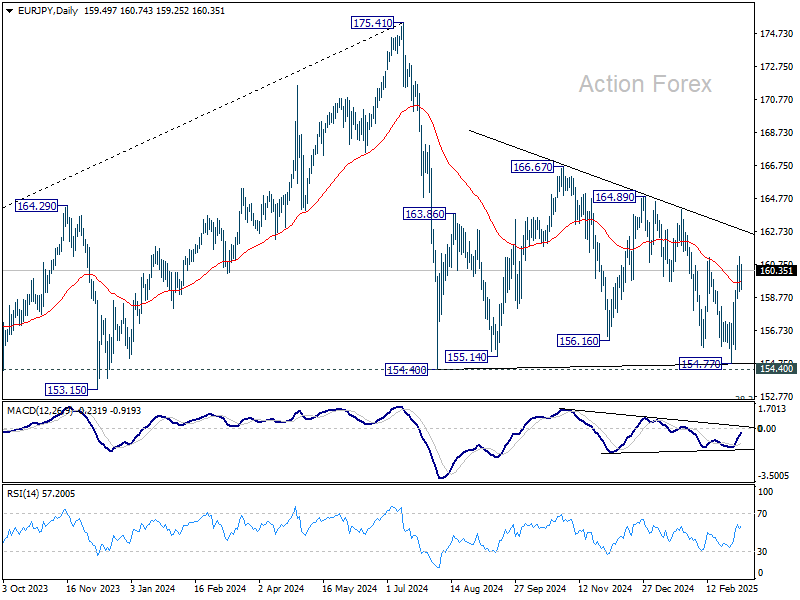
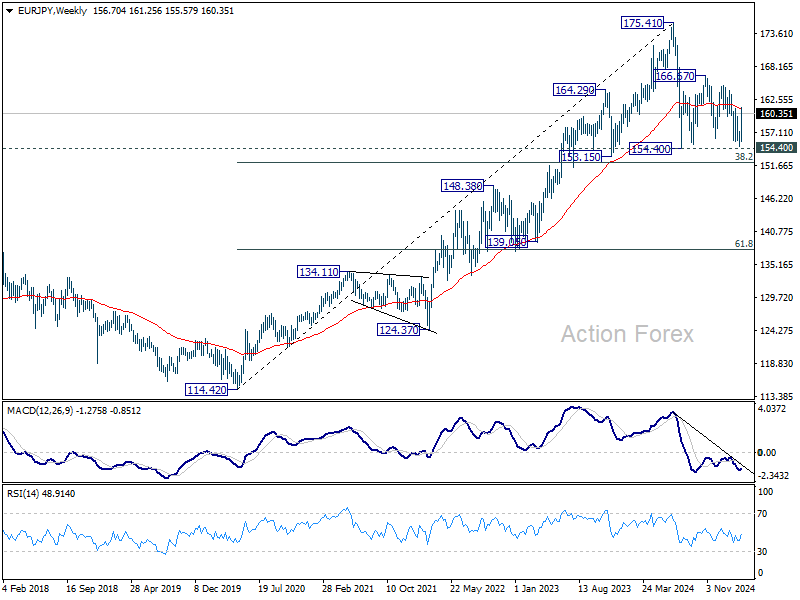
In the bigger picture, price actions from 175.41 are seen as correction to rally from 114.42 (2020 low). Strong support should be seen from 38.2% retracement of 114.42 to 175.41 at 152.11 to contain downside. However, sustained break of 152.11 will bring deeper fall even still as a correction.
In the long term picture, while 175.41 is at least a medium term top, it's still early to conclude that up trend from 94.11 (2012 low) has completed. A medium term corrective phase is in progress with risk of deeper fall back to 55 M EMA (now at 148.45).
EUR/GBP Weekly Outlook
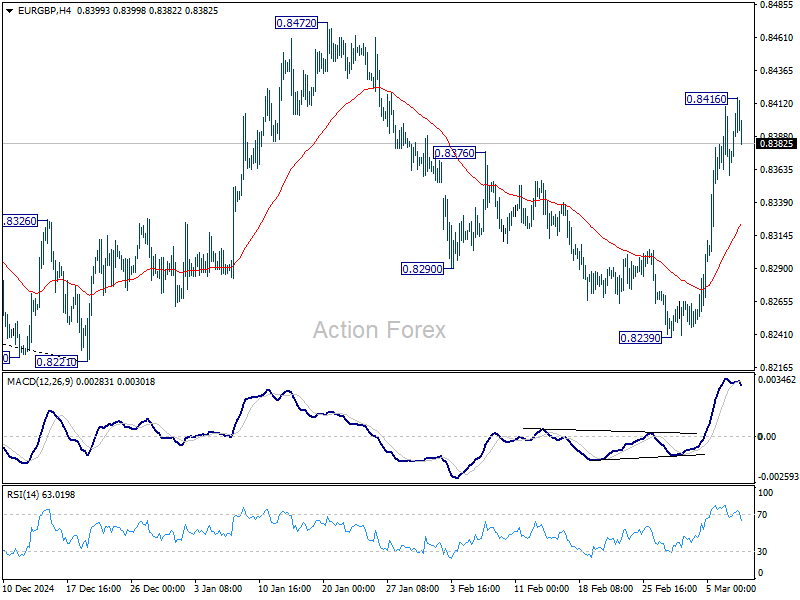
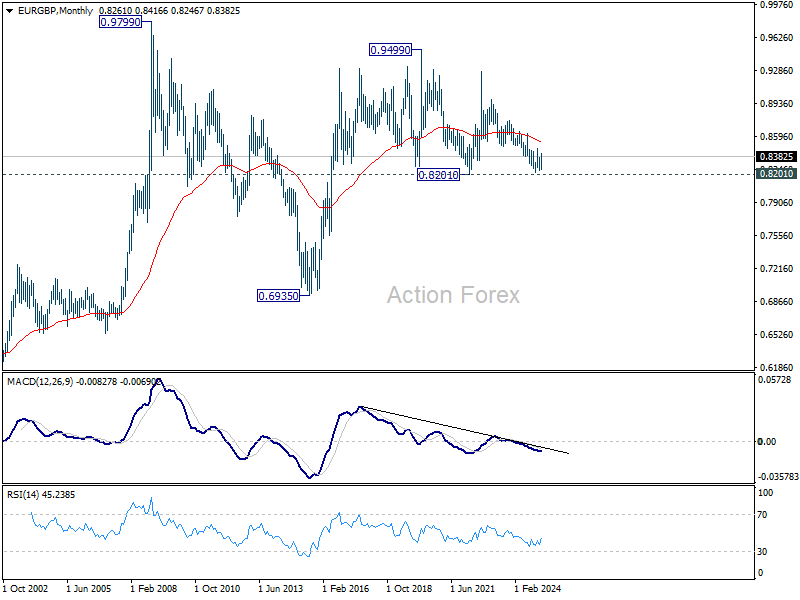
EUR/GBP's strong rally last week suggest that fall from 0.8472 has completed as a corrective three-wave move down to 0.8239. However, the cross lost momentum after final push to 0.8416. Initial bias is neutral this week for consolidations. Downside should be contained above 55 4H EMA (now at 0.8323) to bring another rise. Break of 0.8416 temporary top will target 0.8472 resistance next.
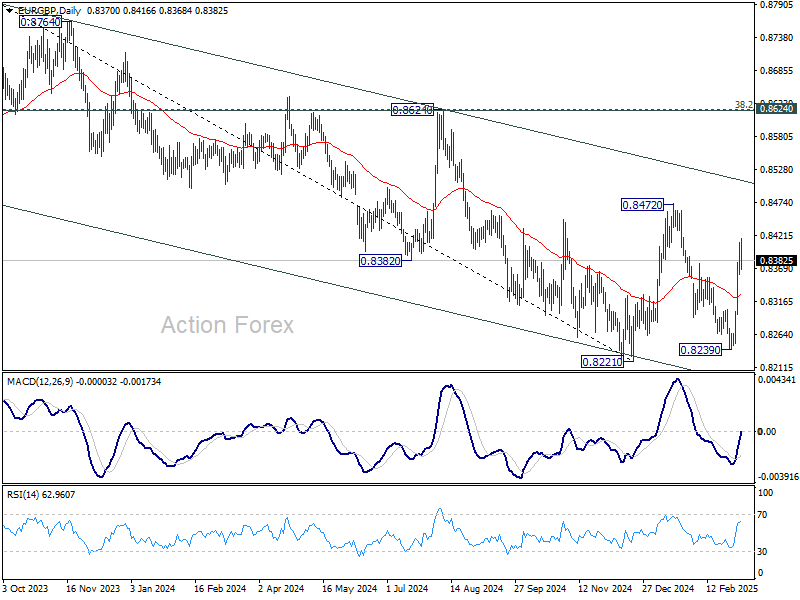
In the bigger picture, EUR/GBP is still bounded inside medium term falling channel. While rebound from 0.8221 might extend higher, it could still develop into a corrective pattern. Overall outlook will be neutral at best and down trend from 0.9267 (2022 high) could extend, at least until decisive break of channel resistance (now at 0.8511).
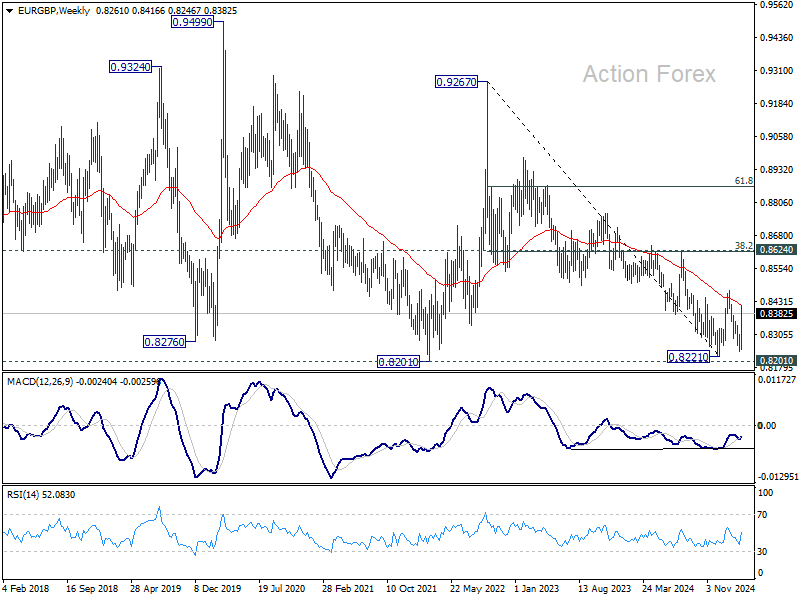
In the long term picture, price action from 0.9499 (2020 high) is seen as part of the long term range pattern from 0.9799 (2008 high). Range trading should continue between 0.8201 and 0.9499, until there is clear signal of imminent breakout.
EUR/AUD Weekly Outlook
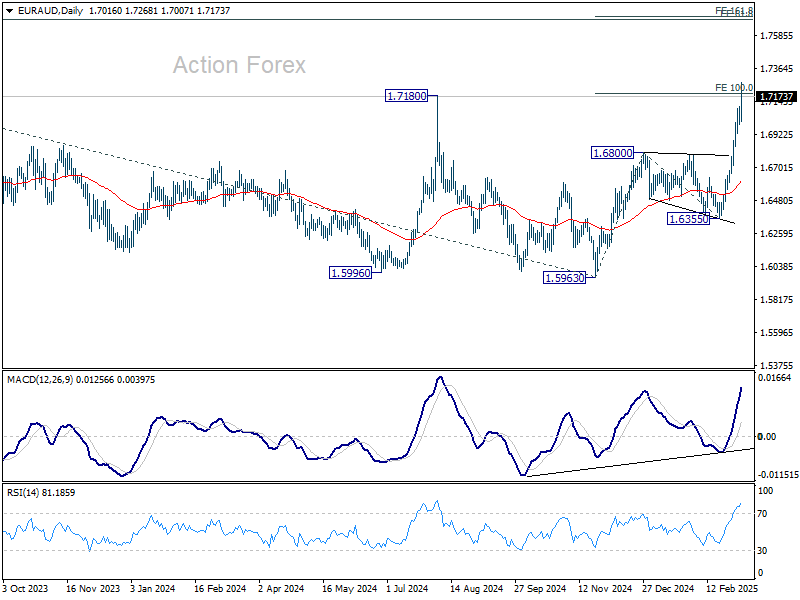
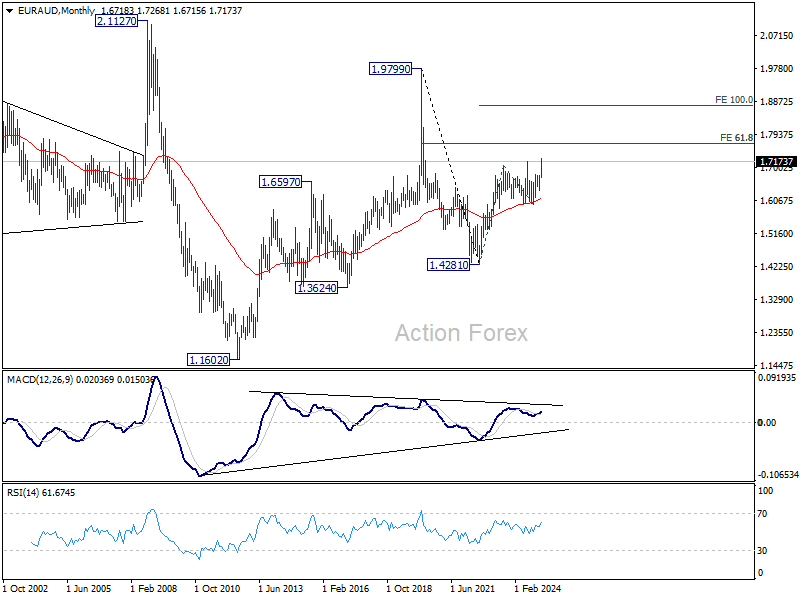
EUR/AUD's rally from 1.5693 resumed last week and accelerated to as high as 1.7268. There is no clear sign of topping yet and initial bias stays on the upside this week. Sustained trading above of 100% projection of 1.5963 to 1.6800 from 1.6355 at 1.7192 will target 161.8% projection at 1.7709 next. On the downside, below 1.7016 minor support will turn intraday bias neutral and bring consolidations first.
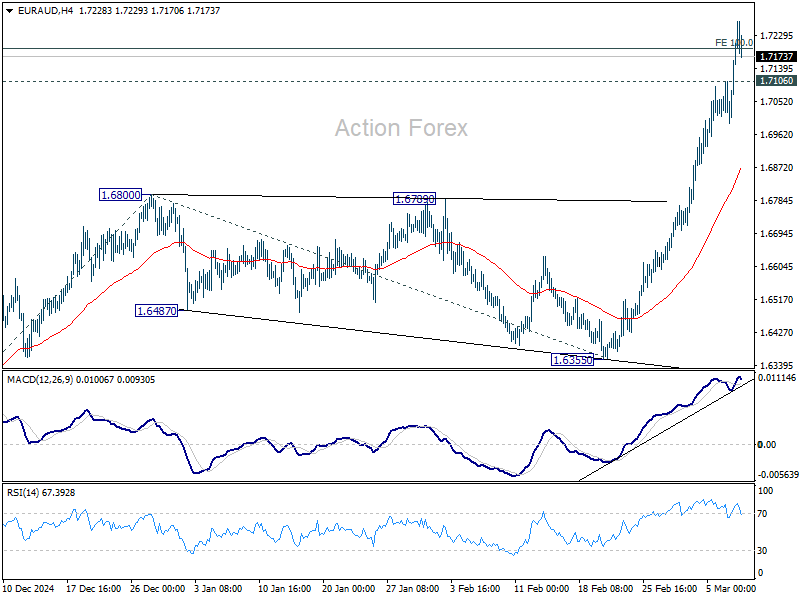
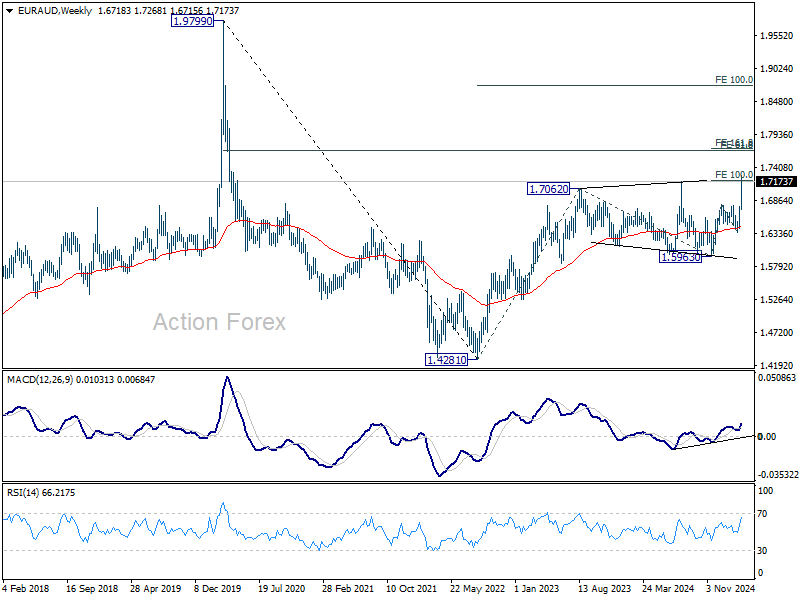
In the bigger picture, the breach of 1.7180 key resistance (2024 high) suggests that up trend from 1.4281 (2022 low) is resuming. Sustained trading above 1.7180 will confirm and target 61.8% projection of 1.4281 to 1.7062 from 1.5963 at 1.7682, which is also close to 61.8% retracement of 1.9799 (2020 high) to 1.4281 at 1.7691. For now, this will remain the favored case as long as 1.6355 support holds, even in case of deep pullback.
In the longer term picture, rise from 1.4281 is seen as the second leg of the pattern from 1.9799 (2020 high), which is part of the pattern from 2.1127 (2008 high). As long as 55 M EMA (now at 1.6090) holds, this second leg could still extend higher. However, sustained trading below 55 M EMA will open up the bearish case for extending the decline through 1.4281 low.
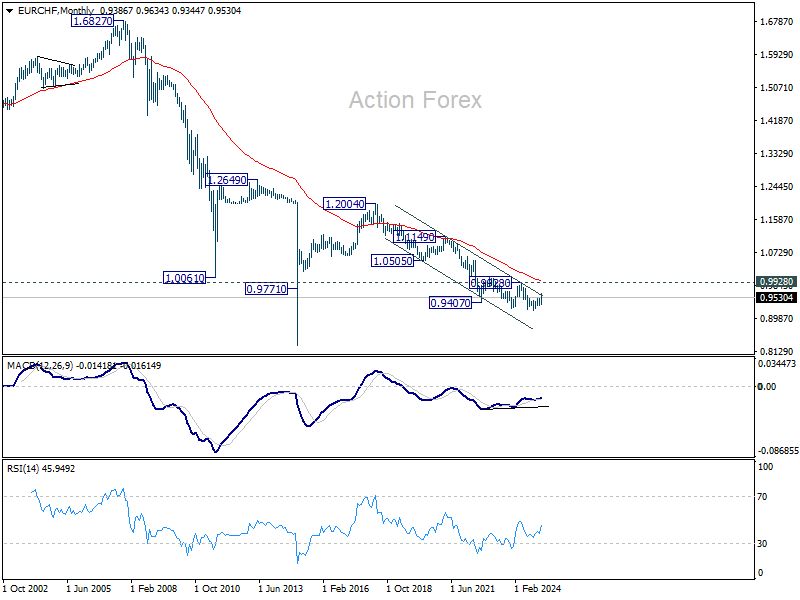
EUR/CHF Weekly Outlook
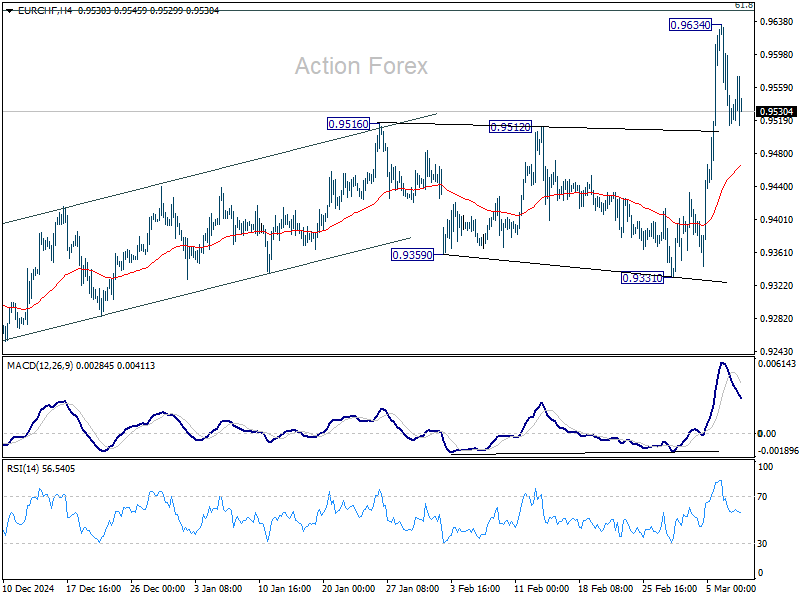
EUR/CHF surged to as high as 0.9634 last week but faced strong resistance from long term falling channel and retreated. Initial bias stays neutral this week first and some more consolidations could be seen. Further rally will be expected as long as 55 4H EMA (now at 0.9467) holds. On the upside, above 0.9634, and sustained trading above 0.9651 fibonacci level will pave the way back to 0.9928 key resistance next.
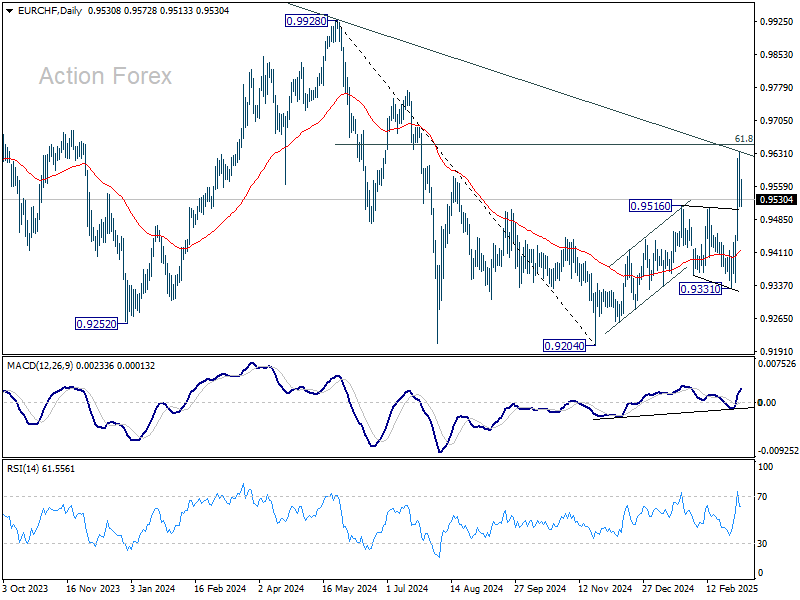
In the bigger picture, the strong break of 55 W EMA (now at 0.9482) is a medium term bullish sign. Sustained break trading above long-term falling channel resistance (at around 0.9620) would suggest that the downtrend from 1.2004 (2018 high) has bottomed at 0.9204. Stronger rally should then be see to 0.9928 key resistance at least.
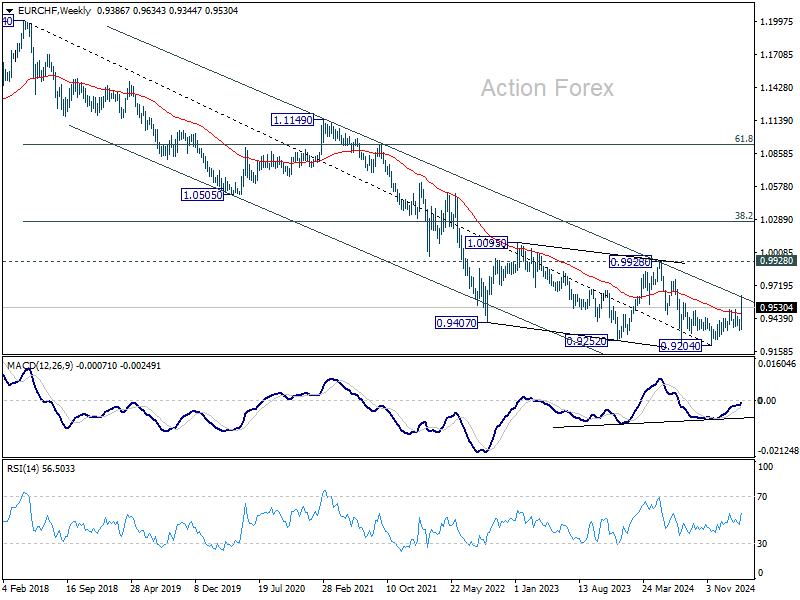
In the long term picture, bullish signs are emerging. However, the important hurdle at 0.9928 resistance, which is close to 55 M EMA (now at 0.9960), is needed to be taken out decisively before considering long term trend reversal. Otherwise, outlook is neutral at best.
A Multi-Decade Trend Reversal Underway in EUR/USD?
The sharp contrast between Europe’s newfound unity and the ongoing tariff chaos in the US has been a defining theme in the financial markets. Euro’s extraordinary strength last week reflected growing investor confidence in the region’s strategic shift toward fiscal expansion and defense spending. From the formation of the "Coalition of the Willing" to the ReArm Europe initiative, they highlighted a strong, coordinated response to challenges, be it geopolitical or economic. That could set the stage for a long-term structural shift in European markets.
Meanwhile, the US continued to grapple with trade policy uncertainty, with tariffs now more seen as a drag on sentiment and economic growth rather than a source of inflationary pressure. The recent exemptions granted to Canada and Mexico only reinforced the perception of inconsistency in Washington’s trade strategy. The lack of clarity on future policy moves has started to weigh on investor sentiment. That, if persists, could lead to a outflow of capital from the US and weakening the Dollar further.
From a technical points of view, EUR/USD has shown clear signs of a potential long-term bullish reversal. The pair’s strong surge last week suggests that the multi-year downtrend may have bottomed out, with further upside potential if Europe successfully executes its ambitious fiscal and defense spending plans. However, challenges remain, including implementation risks and the broader impact of trade tensions on European exports.
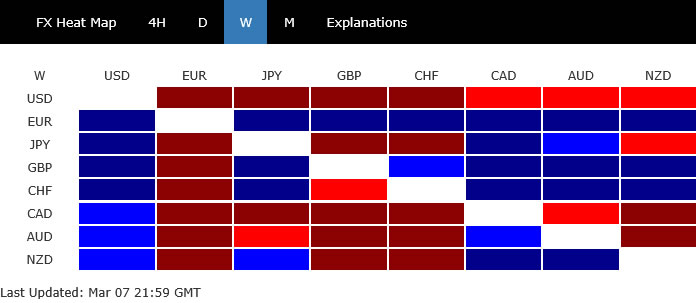
Currency market performance last week reflected the shifting sentiment. Euro ended as the strongest performer, followed by Sterling and Swiss Franc, which also benefited from Europe’s renewed economic confidence.
On the other hand, Dollar closed as the worst performer, struggling under the weight of investor skepticism and diminishing safe-haven appeal. Elsewhere, Canadian Dollar and Australian Dollar also underperformed, indicating that risk-off sentiment remains present, particularly in the US. Yen and Kiwi positioned themselves in the middle of the performance spectrum.
Europe’s Bold Shift Ignites Market Optimism
Last week brought a seismic shift in Europe's geopolitical, defense, and fiscal policies. In a move not seen in decades, the region is asserting greater strategic independence while ramping up economic stimulus. The changes were embraced by investors with enthusiasm, fueling rallies in European assets, particularly in Euro and German equities.
Euro surged 4.4% against Dollar, its best weekly performance since 2009. Meanwhile, Germany’s 10-year yield posted its biggest jump since the fall of the Berlin Wall. DAX hit fresh record highs, with cyclical and defense-related stocks leading the charge.
At the heart of this shift is the “ReArm Europe” initiative, which commits the EU to a significant defense buildup. European Commission President Ursula von der Leyen has proposed mechanisms to mobilize up to EUR 800B in special funds. This landmark decision not only strengthens military readiness, but also reduces reliance on external allies.
Further reinforcing this new direction, EU leaders took a bold stand against Hungarian Prime Minister Viktor Orbán, overriding his veto on aid to Ukraine. In an unusual move, member states issued a separate statement reaffirming their unified support for Kyiv.
Meanwhile, in Germany, despite ongoing coalition talks, CDU leader Friedrich Merz wasted no time aligning with the SPD to push for loosening of the "debt brake", which would unlock EUR 500B for infrastructure projects. Additionally, defense spending above 1% of GDP will be permanently exempt from fiscal constraints. Over the next decade, these measures could increase government spending by a staggering 20% of GDP. The scale surpasses even that seen after German reunification in the 1990s.
This massive fiscal shift in Germany carries significant upside potential for both domestic and Eurozone growth. With a sharp boost in public spending, it could also act as a buffer against potential US tariffs. For years, European growth has been held back by fiscal conservatism—but now, these bold new policies could reshape the region’s economic future for years to come.
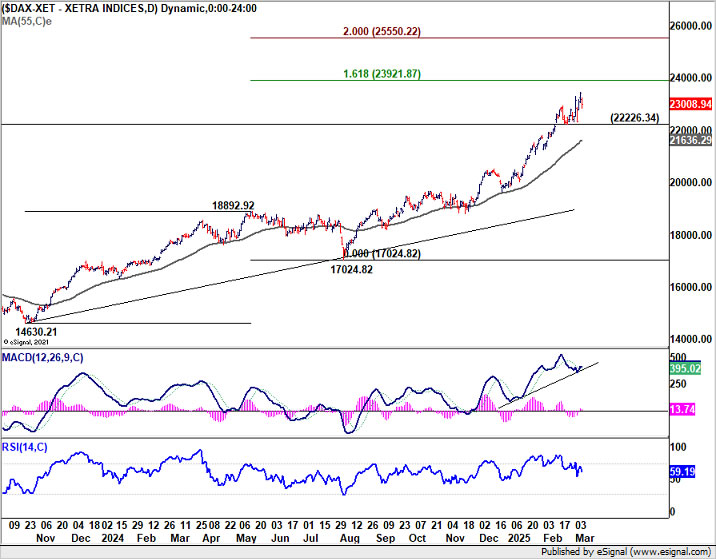
Technically, DAX might be rebuilding upside momentum as seen in D MACD. Current up trend should head to take on 161.8% projection of 14630.21 to 18892.92 from 17024.82 at 23921.87. Decisive break there would target 200% projection at 25550.22 next. Nevertheless, firm break of 22226.34 support will suggest DAX has topped for the near term at least, and consolidations should follow first.
Is Euro Entering a Long-Term Bull Cycle?
As Europe embarks on a new era of fiscal expansion and policy coordination, Euro's looks well-positioned for a prolonged rally and with prospects of long term bullish trend reversal.
Another key factor supporting Euro is the growing belief that ECB is nearing a pause in its policy easing cycle. With monetary policy now "meaningfully less restrictive", as described by President Christine Lagarde, a pause could start as soon as in April. ECB could opt for a wait-and-see approach, to assess how trade policy, fiscal initiatives, and broader geopolitical risks play out.
However, key risks remain, including escalation in trade disputes with the US, as well as how effectively Europe executes its ambitious spending plans. The coming months will be crucial in determining whether this historic shift translates into sustained economic momentum or if internal and external headwinds slow down the Euro’s resurgence.
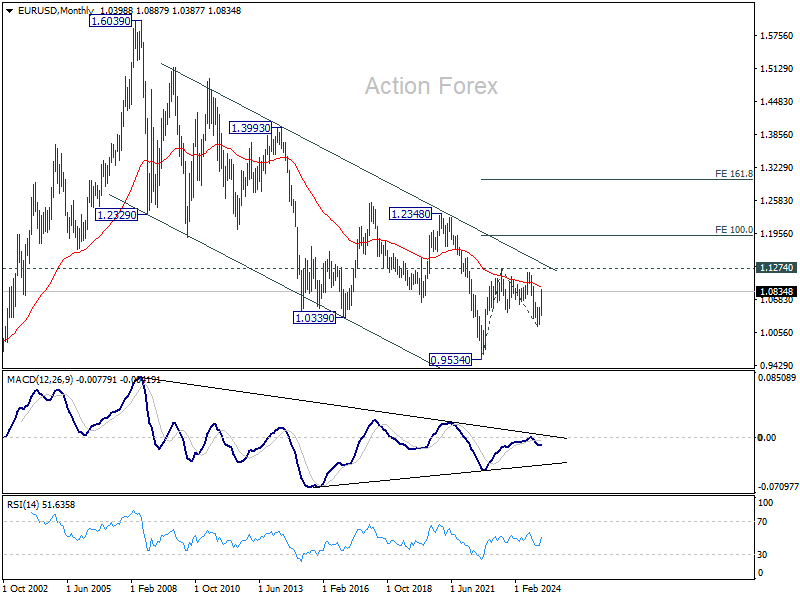
Technically, EUR/USD's strong rally suggests that fall from 1.1274 (2023 high) has completed as a correction, with three waves down to 1.0176. Firm break of 1.1274 would resume larger rally from 0.9534 (2022 low), to 100% projection of 0.9534 to 1.1274 from 1.0176 at 1.1916.
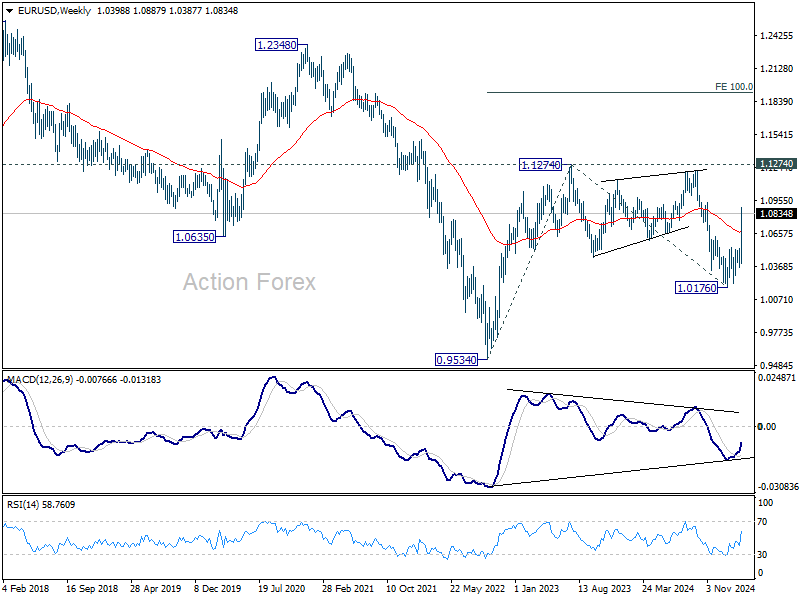
More significantly, if the bullish case is realized, that would push EUR/USD through the two-decade falling channel resistance, which could be an important sign of long term trend reversal.
US Stocks at Risk of Bearish Trend Reversal Amid Tariff Chaos
US stocks endured a turbulent week as investors wrestled with the unpredictable nature of President Donald Trump's trade policies. The volatility has taken a clear toll on market sentiment, with technical indicators increasingly pointing to bearish trend reversal in major indexes. The coming weeks could prove decisive in determining whether the strong uptrend that has defined the past few months has reversed or if equities can regain their footing.
S&P 500 logged its worst week since September, falling -3.1%, while DOW dropped -2.4%. NASDAQ was hit hardest, tumbling -3.5%.
The implementation of 25% tariffs on Canadian and Mexican imports on March 4, had initially sent markets into a tailspin. However, Trump’s decision on Thursday to pause tariffs on USMCA-covered goods for another month only added to the confusion, as investors struggled to decipher the long-term direction of trade policy.
This chaotic cycle of tariff imposition followed by temporary reversals has created an uncertain and fragile investment environment. Businesses remain hesitant to make forward-looking decisions, while consumer confidence is showing signs of strain. The erratic nature of US trade policy has left markets with little clarity, and the risk of further deterioration in sentiment remains high.
Nevertheless, Friday’s non-farm payroll report provided some relief, as job growth remained near its recent average, unemployment stayed within its recent range, and wage growth held robust. The data suggested that, at least for now, the feared economic fallout from tariffs has not yet materialized in a meaningful way. However, lingering uncertainty around trade and global economic conditions continues to weigh on sentiment.
Meanwhile, Fed Chair Jerome Powell reiterated on Friday that the central bank is in no rush to cut rates, stating that the Fed is “well-positioned to wait for clarity.” Powell’s cautious stance contrasts with growing market expectations for rate cuts, as investors bet on economic weakness forcing the Fed’s hand.
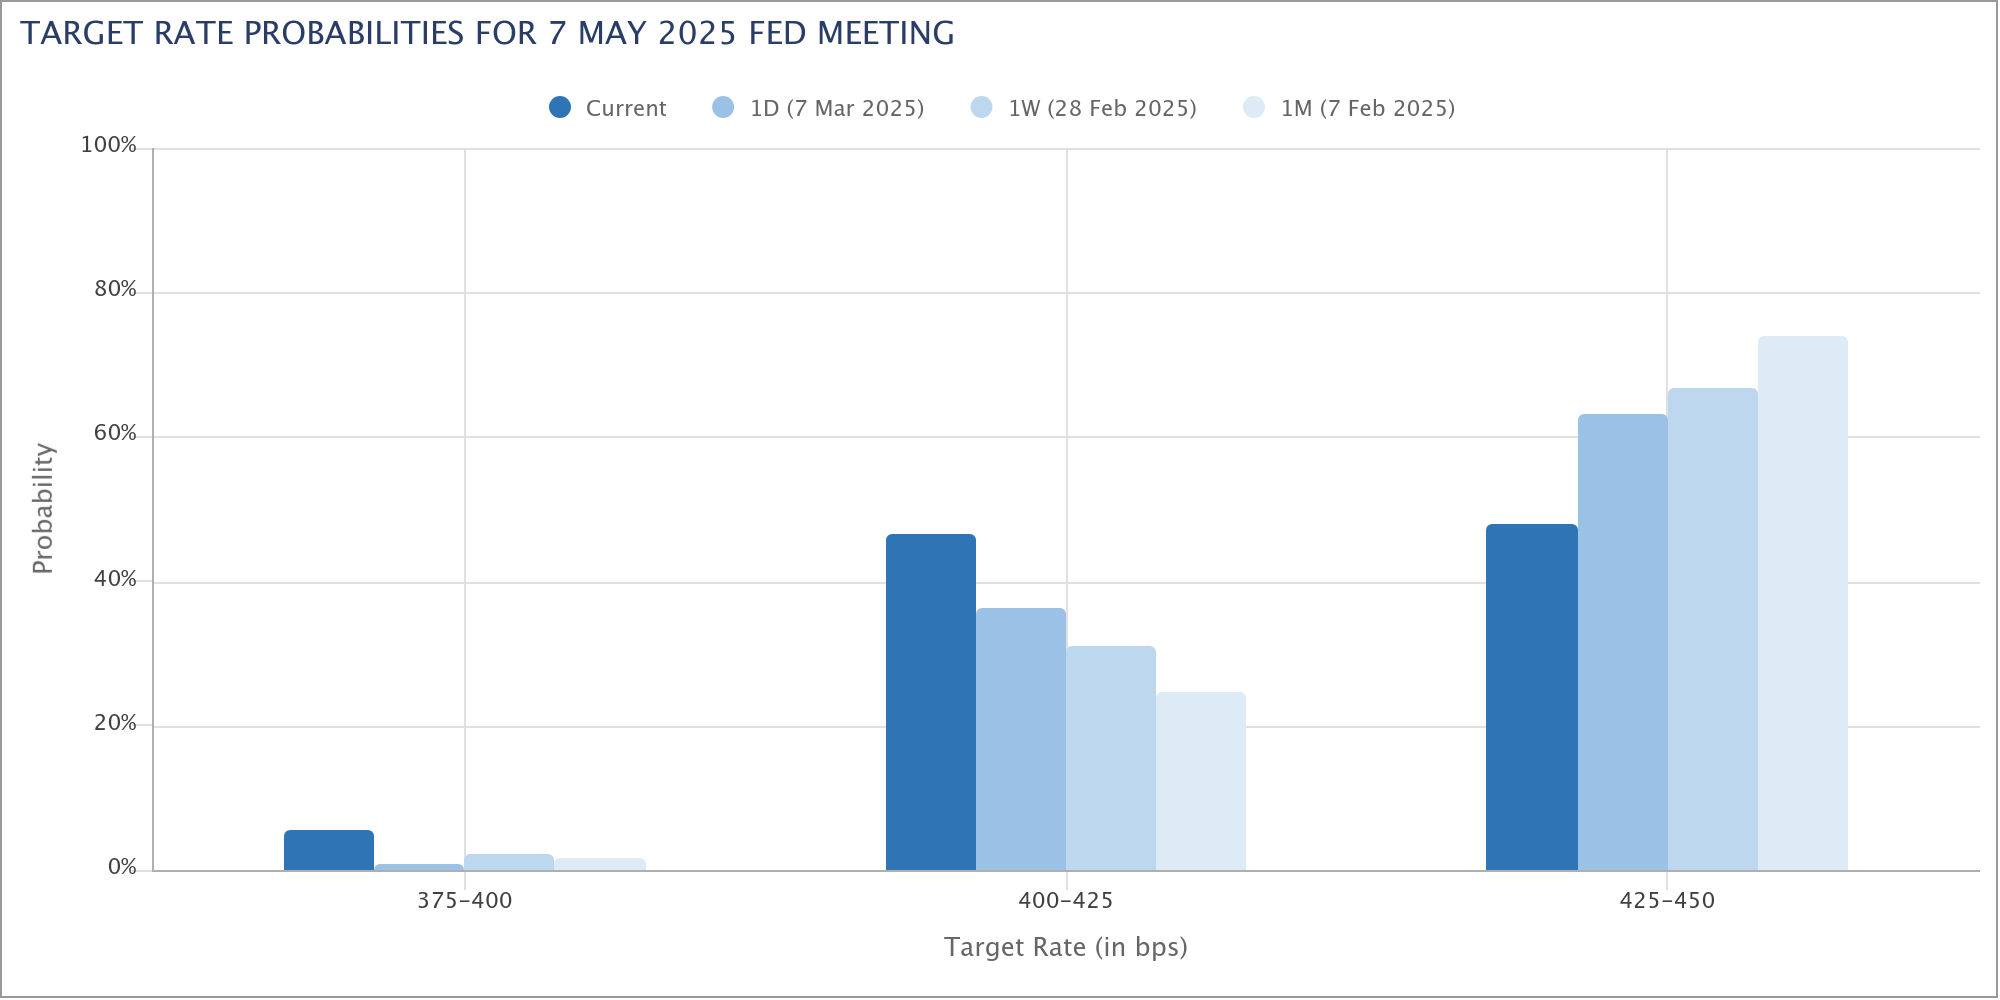
While a hold in March remains the base case, with 88% odds, Fed fund futures now price in a 52% probability of a 25bps rate cut in May, up sharply from 33% a week ago and 26% a month ago. This suggests that investors are bracing for the possibility of further economic softening, with Fed being forced to act sooner than its current guidance suggests.
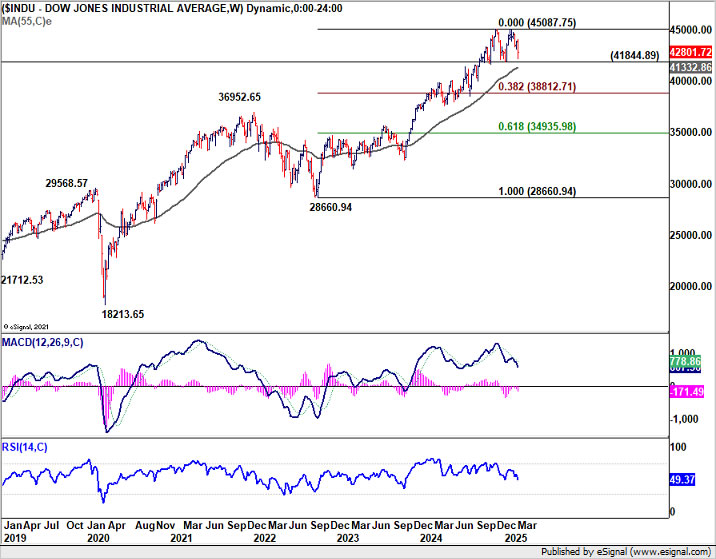
Technically, DOW's up trend should still be intact as long as 41844.89 support holds. However, firm break there will argues that it's already in correction to the up trend from 28660.93 (2022 low). Sustained trading below 55 W EMA (now at 41332.86) will further solidify this bearish case. Next target will be 38.2% retracement of 28660.94 to 45087.75 at 38812.71.
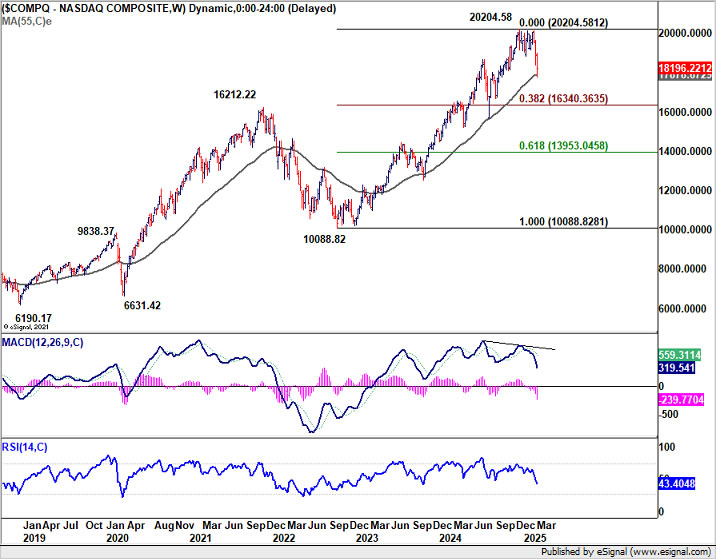
As for NASDAQ, it's now pressing 55 W EMA (at 17878.67). Sustained break there will also indicate that it's already correcting the up trend from 10088.82 (2022 low). Next target is 38.2% retracement of 10088.82 to 20204.58 at 16340.36.
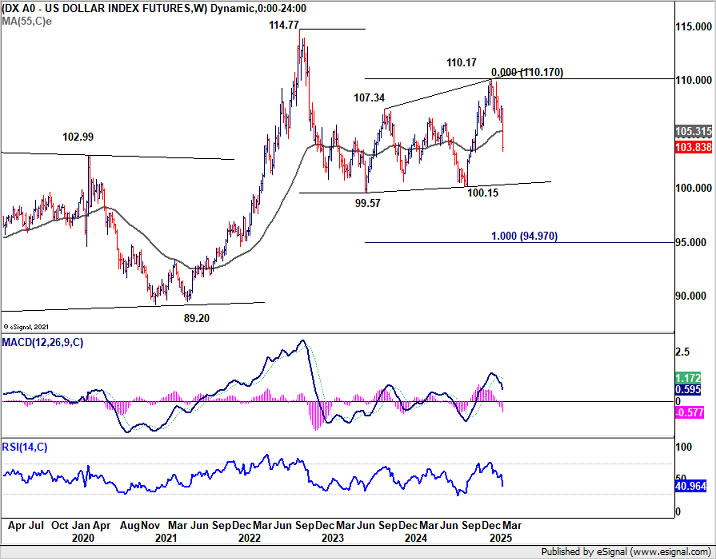
As for Dollar Index, last week's steep decline and strong break of 55 W EMA (now at 105.31) argues that corrective pattern from 99.57 (2023 low) has completed with three waves up to 110.17. Near term risk will now stay on the downside as long as 55 D EMA (now at 106.91) holds. Further downside acceleration will raise the chance that Dollar Index is indeed resuming the whole down trend from 114.77 (2022 high) .
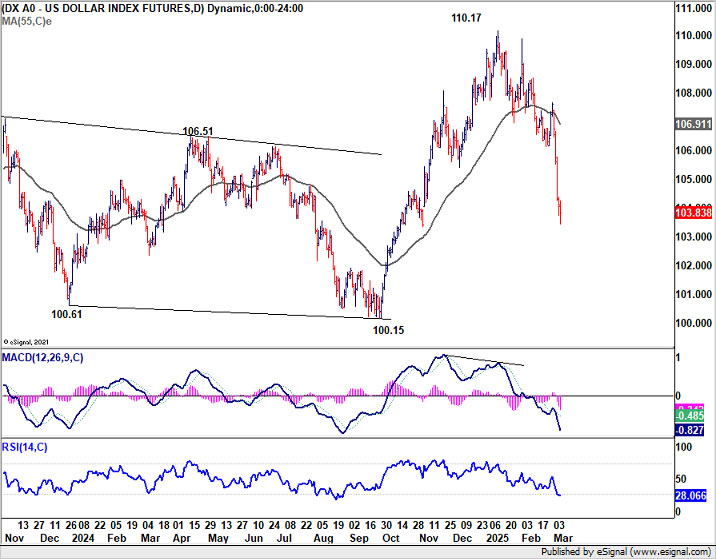
While it's still too early to confirm the bearish case, firm break of 100.15 support could set up further medium term fall to 100% projection of 114.77 to 99.57 from 110.17 at 94.97.
The challenge for Dollar is that risk aversion no longer seems to be offering support. Tariffs are providing little help unlike what it did this year. Meanwhile, Fed appears poised to resume rate cuts sooner than expected. With these factors in play, it's unclear what could drive a rebound for the greenback, other then implosion of Euro and other currencies
EUR/CHF Weekly Outlook
EUR/CHF surged to as high as 0.9634 last week but faced strong resistance from long term falling channel and retreated. Initial bias stays neutral this week first and some more consolidations could be seen. Further rally will be expected as long as 55 4H EMA (now at 0.9467) holds. On the upside, above 0.9634, and sustained trading above 0.9651 fibonacci level will pave the way back to 0.9928 key resistance next.
In the bigger picture, the strong break of 55 W EMA (now at 0.9482) is a medium term bullish sign. Sustained break trading above long-term falling channel resistance (at around 0.9620) would suggest that the downtrend from 1.2004 (2018 high) has bottomed at 0.9204. Stronger rally should then be see to 0.9928 key resistance at least.
In the long term picture, bullish signs are emerging. However, the important hurdle at 0.9928 resistance, which is close to 55 M EMA (now at 0.9960), is needed to be taken out decisively before considering long term trend reversal. Otherwise, outlook is neutral at best.
February CPI Preview: The Tariff Winds Start to Blow
Summary
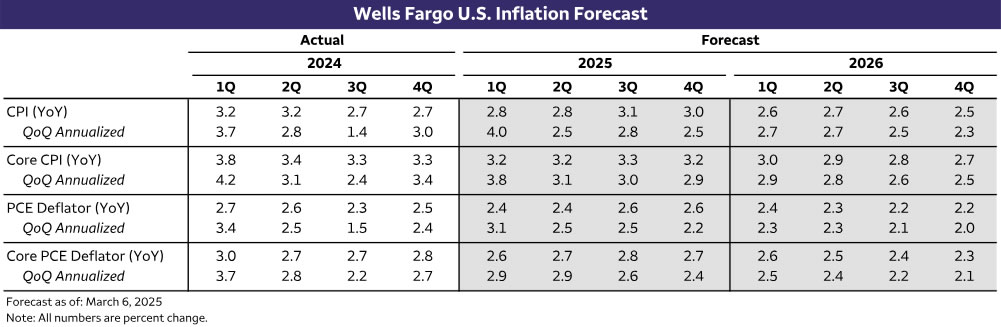
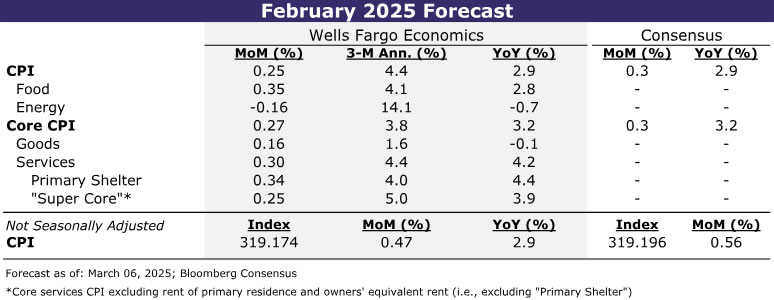
Consumer price inflation came out of the gate strong in 2025, but price growth looks to have cooled somewhat in February. We estimate headline CPI rose 0.25% and the core index advanced 0.27%. The moderation in the core index is likely to reflect some giveback in a handful of categories that soared in January (e.g., prescription drugs, used cars, motor vehicle insurance and recreation services) and lead to softer monthly prints for both core goods and services. However, we believe growing concerns over tariffs are already affecting pricing decisions and will help to keep the pace of consumer price inflation firm overall.
Despite Moderation in February, CPI Inflation to Remain Firm
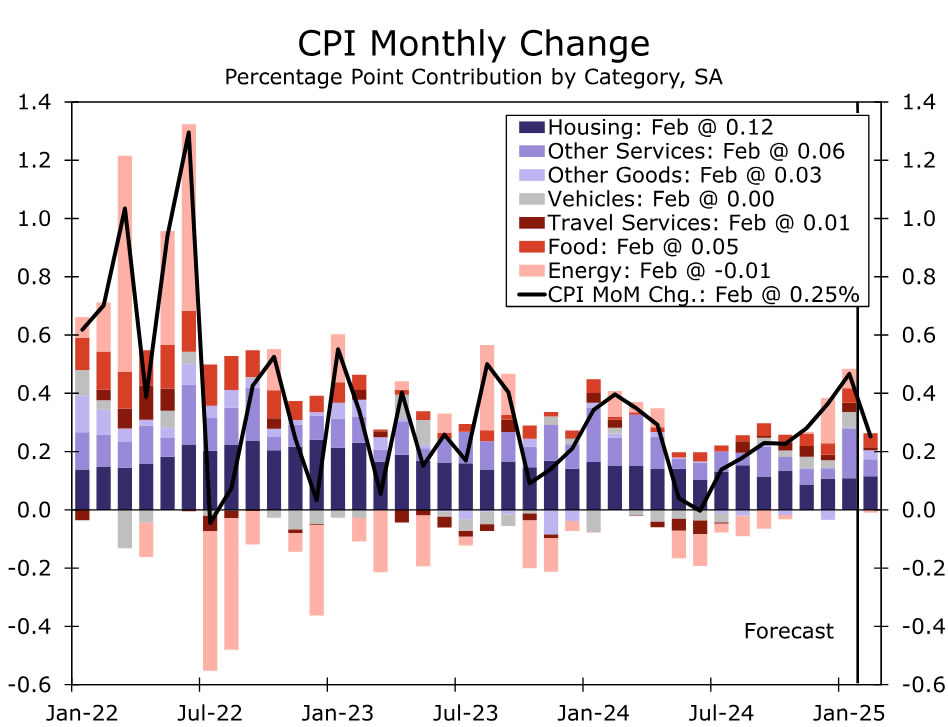
The January CPI report carried echoes of 2024 with the first key inflation read of the year coming in hot. Unlike last year, however, we expect it to be followed up by a more temperate gain in February. Headline CPI likely increased by about 0.25% in February, or roughly half the size of last month's advance. Gasoline prices rose less than usual last month, signaling a decline in energy goods prices on a seasonally-adjusted basis. That should help keep the overall contribution from energy slightly negative despite a pickup in energy services costs from the recent strength in natural gas prices (Figure 1).
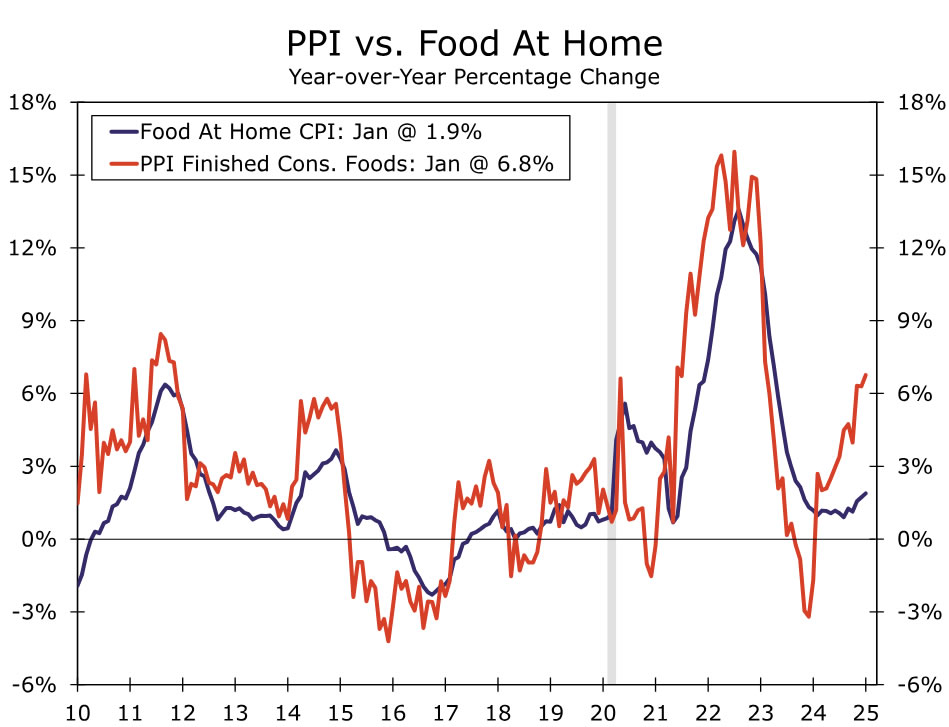
The firmer trend in food inflation that began last fall likely continued in February. We look for a 0.3% rise in food prices, which would push the three-month annualized rate up to 4.1%—the strongest clip in two years. Grocery prices look poised for another solid increase (0.4%) following the jump in producer prices for consumer foods last month and weekly data from the USDA suggesting relief on egg prices has yet to arrive (Figure 2). Slower growth in average hourly earnings for restaurant workers continues to offer some relief to food away from home, but the rebound in food-related commodity costs and the lapping of a low base comparison last February points to the cost of dining out picking up on a year-ago basis.
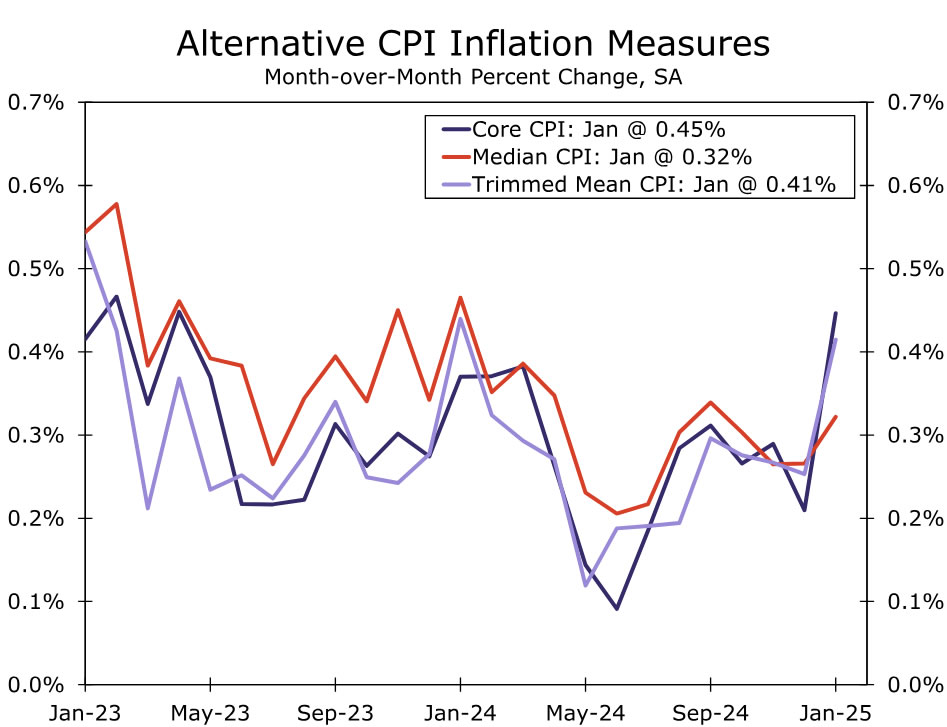
Excluding food and energy, we estimate CPI inflation cooled in February with a 0.3% gain (0.27% unrounded). Whereas January 2024's upside surprise was broadly based, strength at the start of this year was more narrowly driven and suggests price pressures are not quite as persistent as first meets the eye. Specifically, the core CPI's rise of 0.45% exceeded the median CPI increase (0.32%) and trimmed mean CPI increase (0.41%)—a reversal from what played out last year when January's strength was followed in February and March (Figure 3).
When looking across the core, we see a number of categories ripe for reversion toward their recent trend. Among them are prescription drugs after the largest monthly gain on record in January (2.5%). On the services side, we see scope for slowing in motor vehicle insurance, whose 2.0% jump in January looks elevated versus industry rate data, and in recreation services and motor vehicles fees, where prices in each saw their largest monthly increases in at least four years.
The anticipated giveback in these categories should lead to a slowing in non-housing services inflation both on a monthly (0.3%) and annual basis (3.9%). We have penciled in a slight pickup in primary shelter costs in February, however. While any impact of the LA wildfires is likely to be a choppy and drawn out affair, February marks the first month in which rents may be affected (see the Topic of the Week section of our January 24 Weekly for more detail). All told, we expect core services to advance 0.3%, which would nudge the year-over-year rate down to a three-year low of 4.2%.
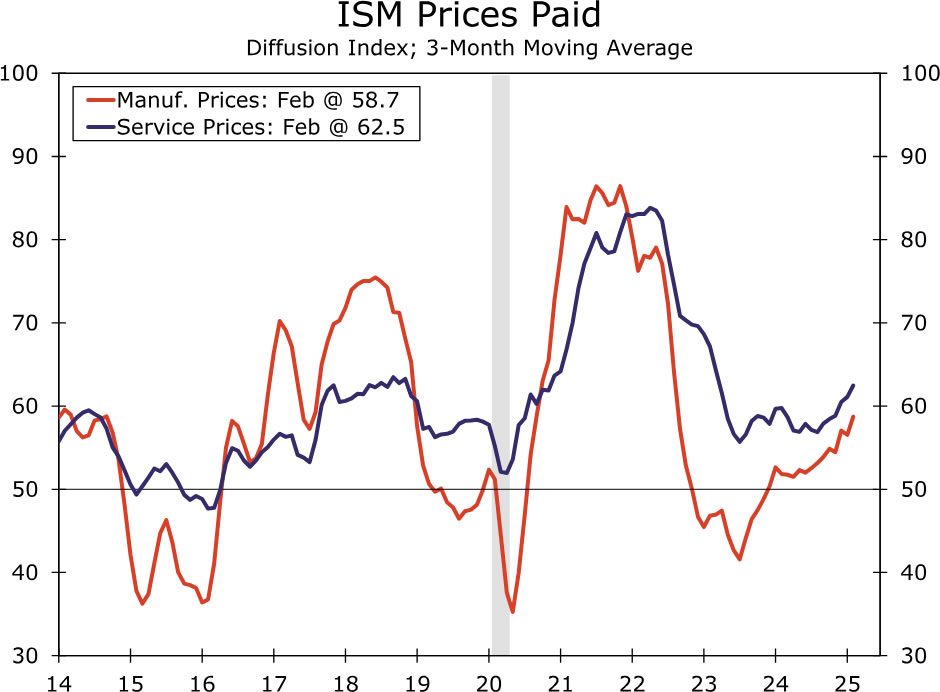
Core goods inflation is likely to have slowed slightly in February with a 0.2% monthly increase. In addition to the anticipated payback for prescription drugs, wholesale auction prices for used cars point to the CPI used vehicle index moving back down in the near term. But elsewhere, we expect the uptrend in goods prices to continue. Goods prices have historically risen the most during the first two months of the year, leaving the potential for residual seasonality in the data to boost February prices on seasonally-adjusted basis. And unlike the tariffs under the first Trump administration, the additional 10% tariffs on Chinese imports implemented at the start of the month included all consumer goods. Furthermore, while even larger tariffs on Canada and Mexico were postponed, the saber-rattling may have been enough to change some firms' pricing decisions already. Notably, both the ISM manufacturing and services surveys reported a pickup in prices paid last month (Figure 4), while the Atlanta Fed's measure of businesses' one-year inflation expectations rose to a seven-month high in February.
While February's CPI report is likely to deliver an initial taste of tariffs, it is likely to be just the start. The implementation of a further 10% tariffs on Chinese goods and the follow-through on 25% tariffs on goods from Canada and Mexico, even with some carve outs, is poised to stoke inflation in the near term. Although we expect both headline and core inflation to tick down on a year-over-year basis in February, we anticipate it will start moving back up this spring and remain stuck near 3% for the duration of this year despite further easing in shelter inflation and growing signs of consumer fatigue.