Sample Category Title
Inflation Expectations Matter
Yesterday brought yet another escalation in the trade war. This time, Trump was reportedly totally annoyed that the Europeans responded to his 25% steel and aluminium tariffs rather than backing down and slapped 200% tariffs on champagne, wine, and other alcoholic beverages from France and the EU.
LVMH, the owner of Moet & Chandon and Veuve Clicquot, slid 1.1%, while Remy Cointreau lost more than 4.5%. The CAC 40 fell 0.64%. In Germany, the clash between the new PM-to-be Merz and the Greens threatens a massive spending deal. But the Stoxx 600 index resists to a slide below its 50-DMA on hope that any positive news from the Gemran political front could re-boost sentiment along with declining nat gas prices on the expectation that a potential resolution to the Ukraine-Russia war could lead to restoration of gas flows to Europe and mark the end of a terrible energy crunch on the old continent.
Elsewhere in energy, crude oil was down yesterday on the back of the escalating trade war that deteriorates the demand outlook while OPEC+ is preparing to restore oil production from April. The growing gap between the demand and supply outlook hints that the market will be in a deeper supply surplus situation later this year – as suggested by the IEA. Note that the US is gently increasing its oil production on Trump’s ‘drill baby drill’ demands, as well. This morning, crude is boosted by news that the US tightened sanctions against Russia and Iran. Yet macro factors will certainly weigh heavier than the geopolitical-led moves. The worsening global trade outlook, higher supply from OPEC and the US could push the barrel of US crude toward the $45/50pb range in the H2.
Softer-than-expected US inflation under the shadow of rising inflation expectations.
Weak energy prices are having a desired easing effect on inflation. The US producer prices fell in February, both the core and the headline figures and for both monthly and yearly basis came below expectations. Alas, the sight of slowing factory-gate inflation couldn’t cheer investors up yesterday. The S&P500 extended losses to more than a 10% slide since the February peak and is now officially in the correction territory. Nasdaq 100 lost some 1.90%. Investors are more focused on rising inflation expectations driven by tariffs than on actual inflation data, as expectations tend to be self-fulfilling. A sharp slowdown in consumer spending could help contain these expectations and their impact on prices, but the latest data suggests otherwise. As a result, today’s Michigan consumer sentiment and inflation expectations update could trigger a stronger market reaction than the CPI and PPI prints. Any signs of further heating in inflation expectations may dampen risk appetite and overshadow the early optimism tied to hopes that U.S. politicians will reach a deal to avert a government shutdown.
In the FX, the US dollar has rebounded this week from oversold conditions that resulted from a sharp selloff since January, explained by rising worries of a sharp US slowdown and mounting bets of a possible US recession later this year. The EURUSD tested the 1.09 offers earlier this week but failed to extend the attempt to the 1.10 psychological mark, somehow laid back by overbought conditions. The EURUSD outlook remains positive on the back of converging growth expectations between the two continent but the euro bulls will likely watch the developments on the German political front before refreshing their push to and above the 1.10 mark.
Negotiations Continue in Germany as the Green Party Voices Distrust
In focus today
Today, we will receive inflation figures for Germany, France, and Spain. These country-specific data serve as valuable indicators for next week's euro area inflation, offering insights into the potential direction of overall inflation trends in the euro area.
In Sweden, focus is on the February LFS. Last month, seasonally adjusted unemployment shot up to a seldom seen 9.7% due to a sharp influx of discouraged workers from the non-labour force to the labour force. As they did not get any jobs on the aggregate, the unemployment rate soared. For February, we expect at least some reversal of this and expect the unemployment rate back down at 9.2%.
Economic and market news
What happened overnight
In Ukraine/Russia, Putin addressed the US backed 30-day ceasefire, expressing support for the concept but requesting several clarifications and conditions. Putin emphasised that many essential details aimed at "solving the root causes" needed to be resolved, suggesting that a swift end to the war was unlikely.
In the US, a top Senate democrat stated support of the Republican bill to prevent a government shutdown, cautioning that failing to pass the measure, scheduled for early Saturday could pave the way for a Trump power grab.
What happened yesterday
In the euro area, industrial production exceeded expectations in January, increasing by 0.8% m/m (cons: 0.6%, prior: -0.4%). However, the less volatile 3M/3M measure indicated that production from November 2024 to January 2025 was still 0.25% below the preceding three months. While hard data is beginning to show signs of stabilisation in the industry following a declining trend, it is still too early to conclude that this trend has ended, as manufacturing PMIs remain below 50.
In Germany, Berlin's fiscal debate offered limited reassurance on securing The Green party's backing for the bill. Merz commended the constructive work with The Greens but faced challenges regarding climate protection. The Green's co-leader expressed distrust, resulting in a pause in negotiations. The bill's passage on Tuesday remains uncertain, further complicated by last-minute lawsuits, which are expected to be dismissed, allowing the "old" parliament to operate until 25 February. The final vote is scheduled for Tuesday, 18 March with negotiations expected to extend into the weekend in pursuit of an agreement.
In the US, February's PPI fell slightly below expectations at the headline level, though excluding volatile components revealed stable price pressures. PPI rose 3.2% y/y (Jan: 3.7%), with services prices pressures easing, as core goods prices showed modest increases, mirroring similar trends seen in the CPI. Meanwhile, both initial and continuing jobless claims saw slight declines, suggesting that labour market conditions remain steady despite concerns over federal layoffs.
In Sweden, the final inflation figures for February matched the preliminary data, showing that inflation was significantly higher than expected, with CPIF ex Energy reaching 3.0% y/y. The final details revealed that the unexpected rise seen in last week's preliminary data was primarily due to increases in food and recreation prices.
Equities: And... we are in correction. Equities substantially lower yesterday after what looked like a dead cat bounce the last two sessions. S&P 500 sold off -1.4% hitting correction territory, while Russell 2000 did no better -1.7% and Nasdaq -2%, on track for the fourth straight weekly drop. Sector performance reversed again, this time to the benefit of defensives but sectors were all over the place. MAG7 led the declines together with defensive real estate, while cyclical materials and financials were relative outperformers with utilities. We interpret this as markets making it clear that it is not economic growth that is yet driving the selloff but uncertainty with valuation in focus rather than earnings. US futures are substantially higher this morning so in the absence of new tariff threats, we might see a little bounce today.
FI&FX: Weak risk sentiment drove equities and US Treasury yields lower as markets worry about an escalating trade war. It has been a volatile week in the financial markets, where 10Y Bunds almost reached 2.95% during the week but have declined and are trading around 2.85%. 10Y US Treasuries have also been trading in a wide range between 4.15% and 4.35% and are currently at 4.26%. EUR/USD moved lower yesterday with the weaker risk sentiment, and the February-to-date USD/SEK rally has paused over the last sessions. After edging just below the 10.00 mark on Tuesday, it now trades at 10.20.
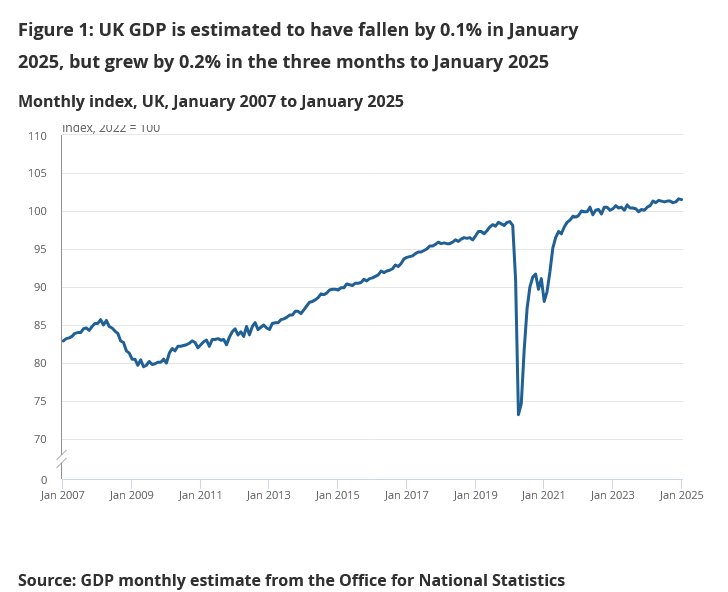
UK GDP down -0.1% mom in Jan, production drags while services support
The UK economy shrank by -0.1% mom in January, falling short of market expectations for a modest 0.1% expansion. The decline was primarily driven by weakness in the production sector, which saw output fall by -0.9% mom , while construction activity also dipped by -0.2% mom. On the other hand, the services sector—accounting for the bulk of the UK economy—managed a modest 0.1% mom gain, helping to cushion the overall contraction.
The broader three-month growth trend is weak too, with real GDP estimated to have expanded by 0.2% in the three months to January 2025 compared to the three months ending in October 2024. Services led the way with a 0.4% rise, while construction also posted a similar 0.4% gain. However, the production sector continued to struggle, contracting by -0.9% over the same period.
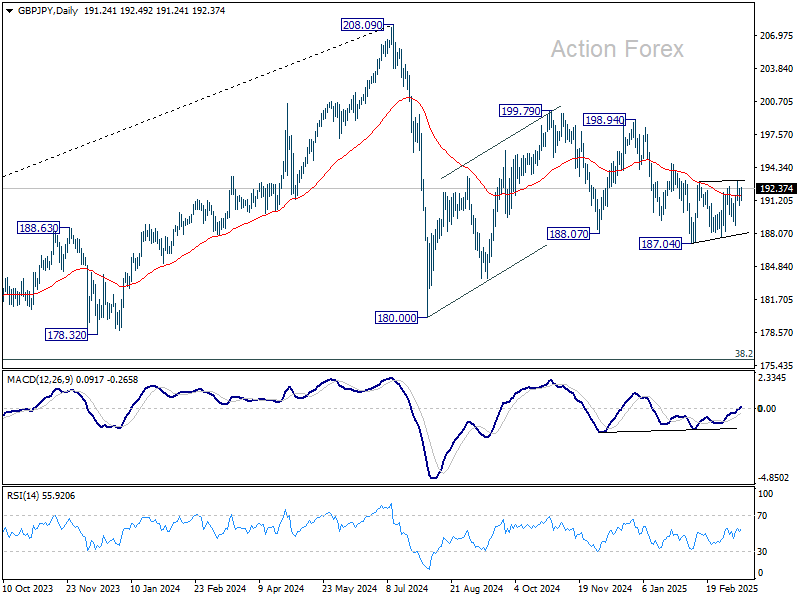
GBP/JPY Daily Outlook
Daily Pivots: (S1) 190.68; (P) 191.51; (R1) 192.29; More...
Intraday bias in GBP/JPY stays neutral as range trading continues. On the upside, firm break of 193.09 will resume the rebound from 187.04 to 194.73 resistance, and then 198.94. On the downside, firm break of 187.04 will extend the fall from 199.79 towards 180.00 support. Overall, corrective pattern from 180.00 might still be extending.
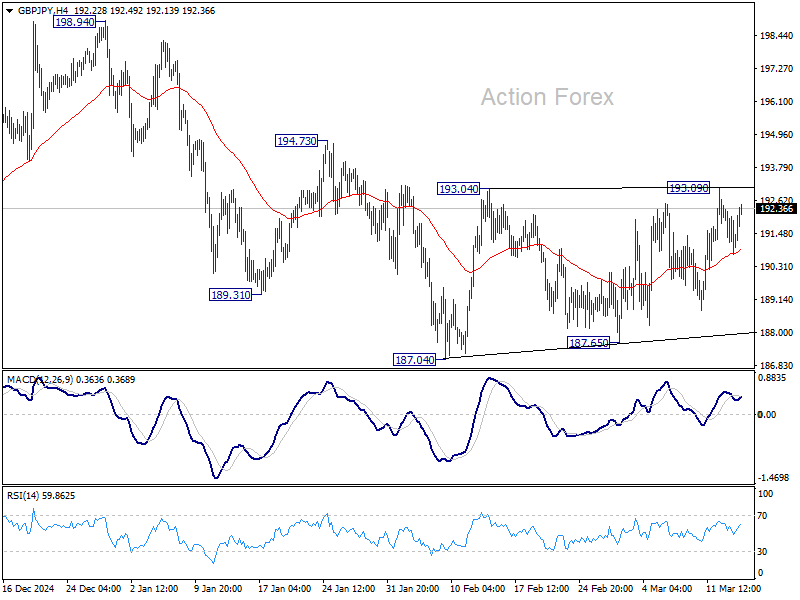
In the bigger picture, price actions from 208.09 are seen as a correction to rally from 123.94 (2020 low). Strong support should be seen from 38.2% retracement of 123.94 to 208.09 at 175.94 to contain downside. However, sustained break of 152.11 will bring deeper fall even still as a correction.
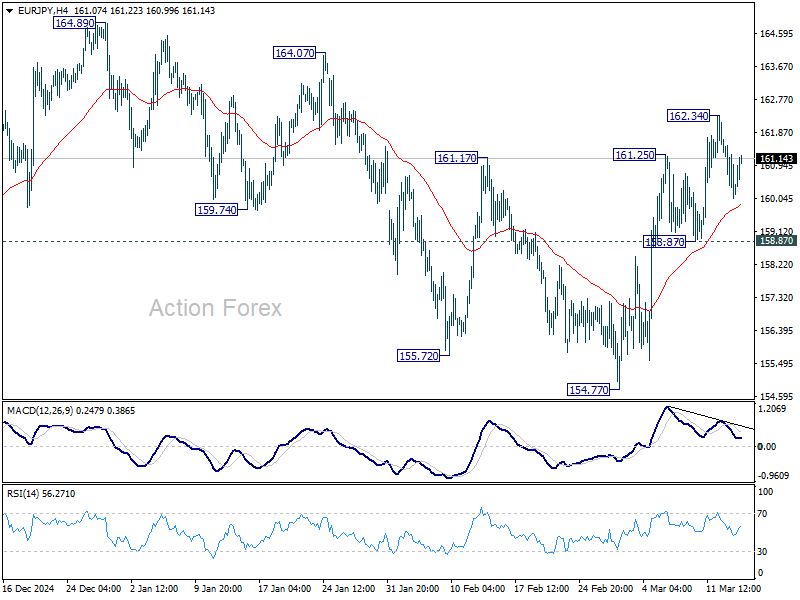
EUR/JPY Daily Outlook
Daily Pivots: (S1) 159.80; (P) 160.68; (R1) 161.30; More...
Intraday bias in EUR/JPY remains neutral for consolidations below 162.34. Further rise is expected as long as 158.87 support holds. Above 162.34 will resume the rise from 154.77 to 164.89 resistance, as another rising leg in the consolidation pattern from 154.40.
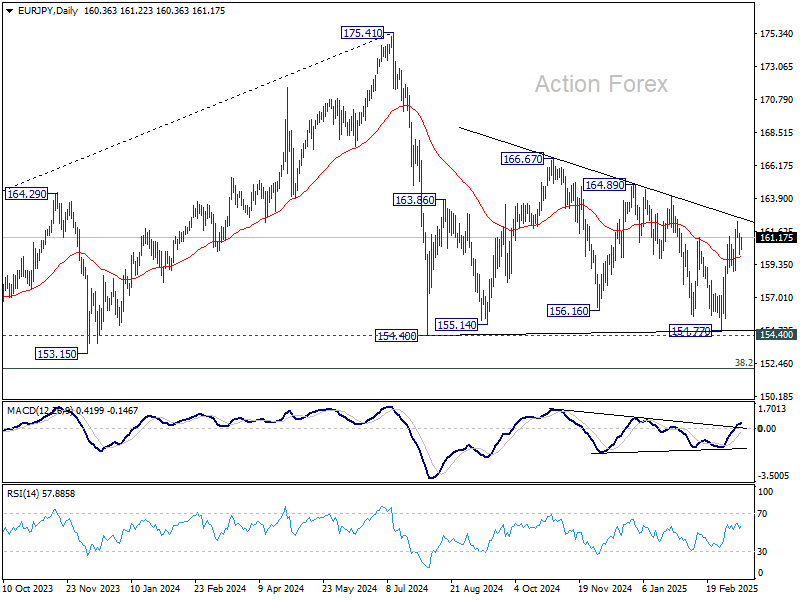
In the bigger picture, price actions from 175.41 are seen as correction to rally from 114.42 (2020 low). Strong support should be seen from 38.2% retracement of 114.42 to 175.41 at 152.11 to contain downside. However, sustained break of 152.11 will bring deeper fall even still as a correction.
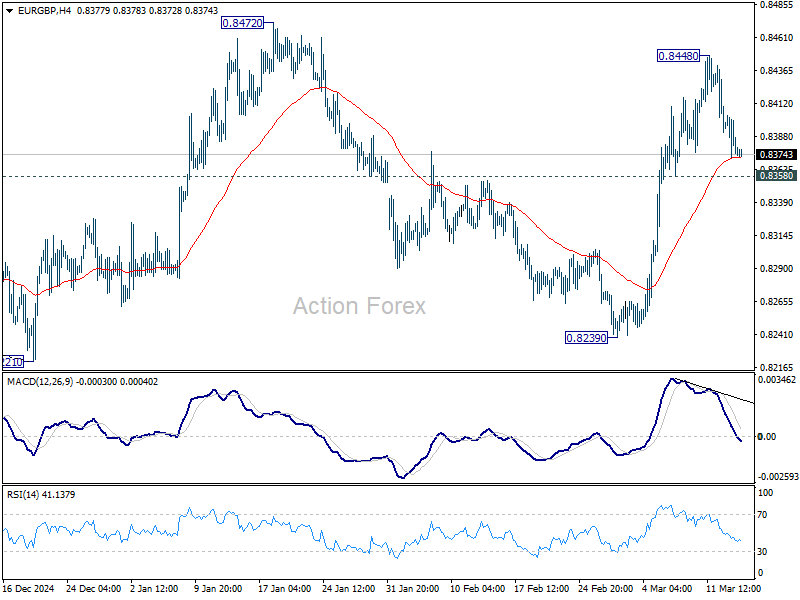
EUR/GBP Daily Outlook
Daily Pivots: (S1) 0.8366; (P) 0.8387; (R1) 0.8401; More...
Intraday bias in EUR/GBP remains neutral for consolidations below 0.8448. Further rise is expected as long as 0.8358 support holds. Above 0.8448 will target 0.8472 resistance. Firm break there will resume whole rebound from 0.8221 to medium term falling channel resistance. Nevertheless, break of 0.8358 will suggest that rise from 0.8239 has completed and turn bias back to the downside instead.
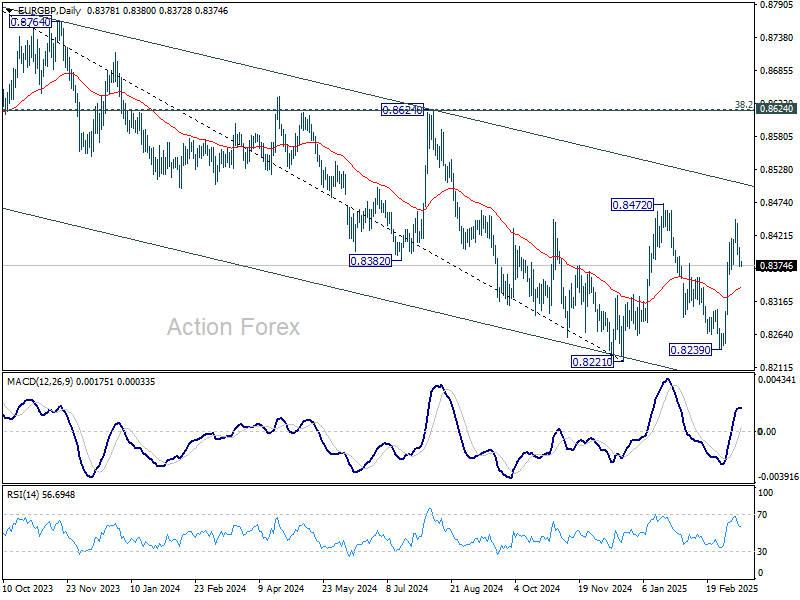
In the bigger picture, EUR/GBP is still bounded inside medium term falling channel. While rebound from 0.8221 might extend higher, it could still develop into a corrective pattern. Overall outlook will be neutral at best and down trend from 0.9267 (2022 high) could extend, at least until decisive break of channel resistance (now at 0.8506).
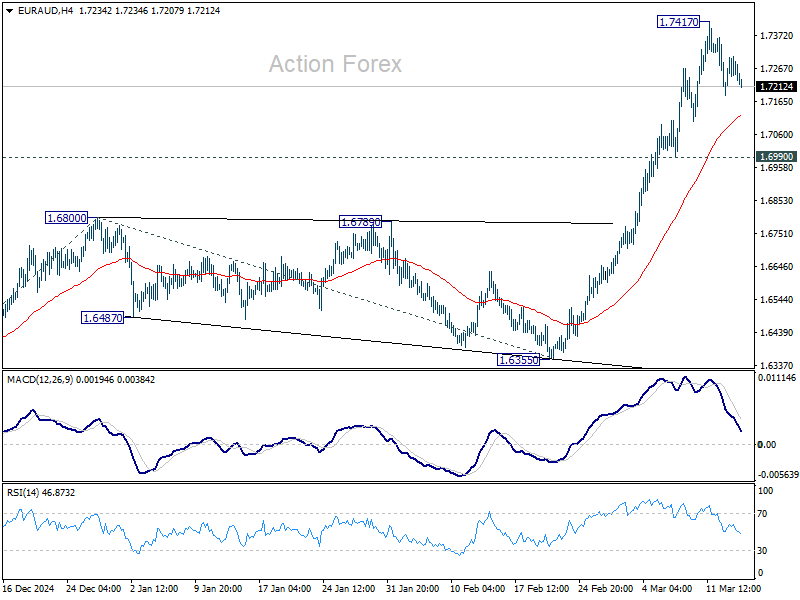
EUR/AUD Daily Outlook
Daily Pivots: (S1) 1.7204; (P) 1.7256; (R1) 1.7323; More...
Intraday bias in EUR/AUD remains neutral for consolidations below 1.7417. Downside of retreat should be contained by 0.6990 support to bring rebound. Meanwhile, break of 1.7417 will resume rise from 1.6335 to 161.8% projection of 1.5963 to 1.6800 from 1.6355 at 1.7709 next.
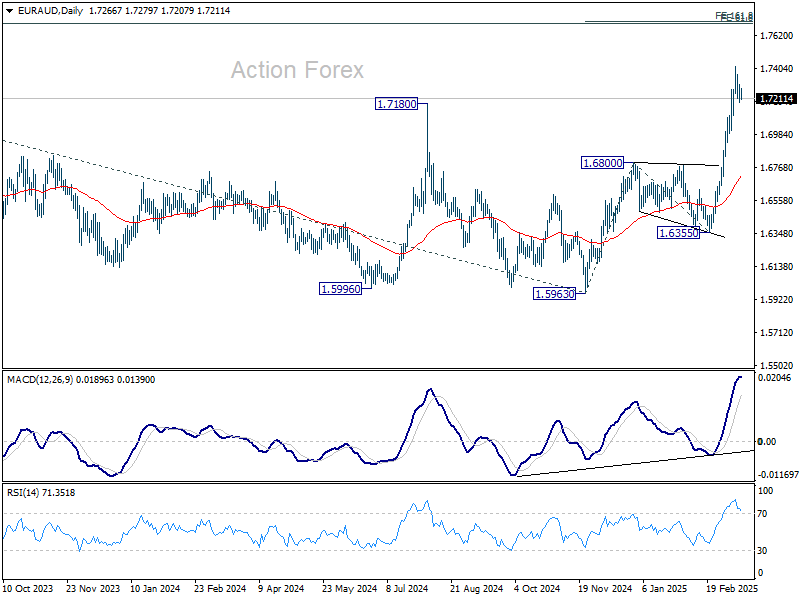
In the bigger picture, up trend from 1.4281 (2022 low) is resuming. Sustained trading above 1.7180 key resistance will pave the way to 61.8% projection of 1.4281 to 1.7062 from 1.5963 at 1.7682, which is also close to 61.8% retracement of 1.9799 (2020 high) to 1.4281 at 1.7691. For now, this will remain the favored case as long as 1.6355 support holds, even in case of deep pullback.
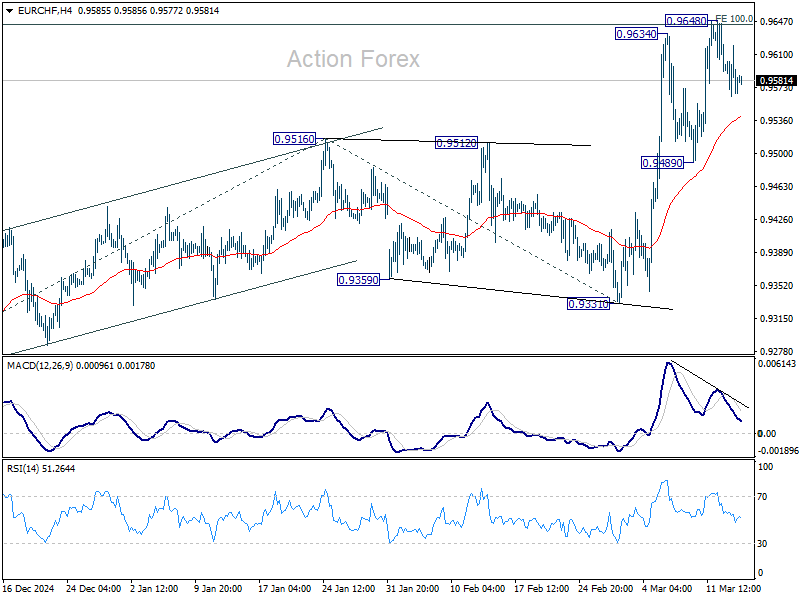
EUR/CHF Daily Outlook
Daily Pivots: (S1) 0.9549; (P) 0.9586; (R1) 0.9607; More....
Intraday bias in EUR/CHF remains neutral for consolidations below 0.9648. Further rally is expected as long as 0.9489 support holds. On the upside, firm break of 100% projection of 0.9204 to 0.9516 from 0.9331 at 0.9643 will pave the way to 161.8% projection at 0.9836 next.
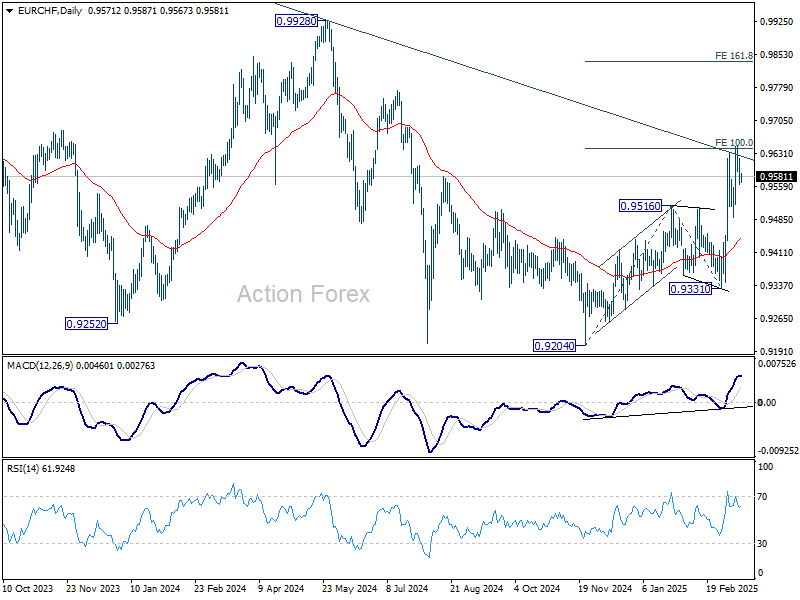
In the bigger picture, the strong break of 55 W EMA (now at 0.9482) is a medium term bullish sign. Sustained break trading above long-term falling channel resistance (at around 0.9620) would suggest that the downtrend from 1.2004 (2018 high) has bottomed at 0.9204. Stronger rally should then be see to 0.9928 key resistance at least.
EUR/USD Daily Outlook
Daily Pivots: (S1) 1.0818; (P) 1.0857; (R1) 1.0892; More...
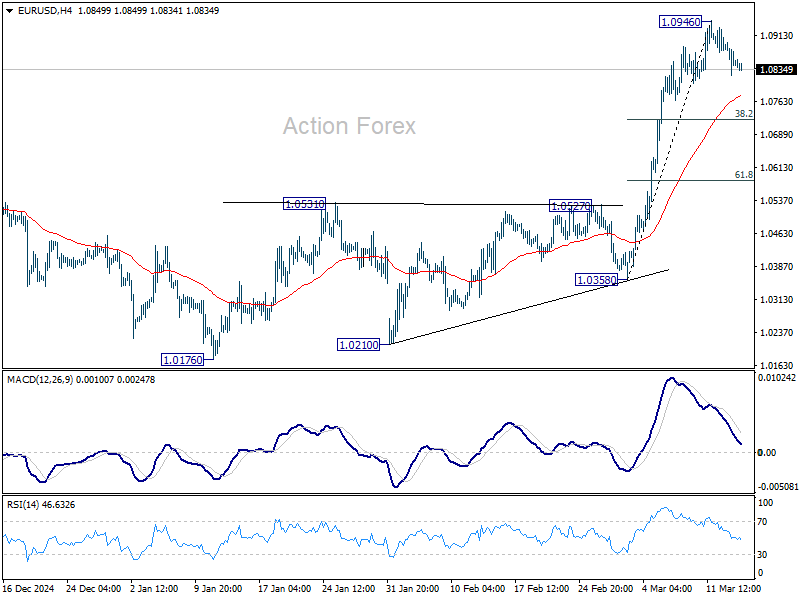
Intraday bias in EUR/USD remains neutral for consolidations below 1.0946. Deeper retreat might be seen towards 55 4H EMA (now at 1.0772). But strong support should be seen from 38.2% retracement of 1.0358 to 1.0946 at 1.0721 to contain downside. On the upside, break of 1.0946 will resume the rally from 1.0176 to retest 1.1274 key resistance next.
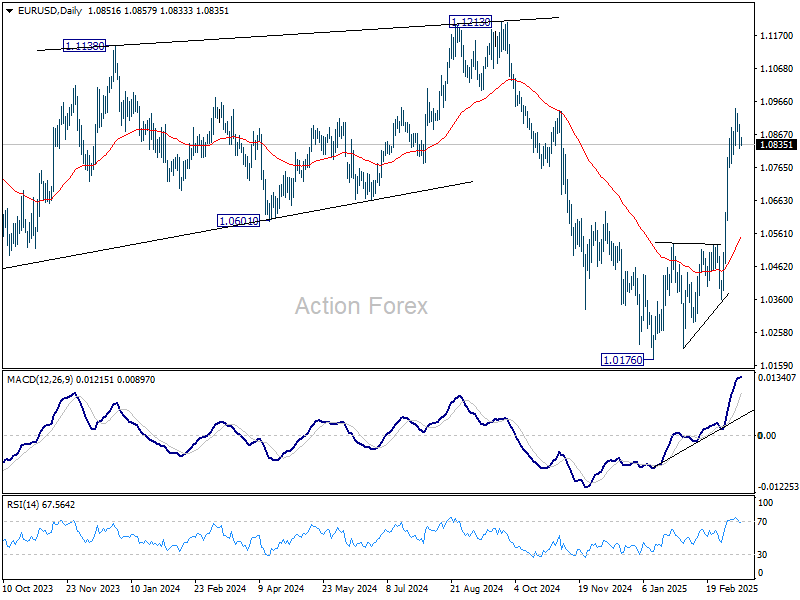
In the bigger picture, the strong break of 55 W EMA (now at 1.0675) suggests that fall from 1.1274 (2024 high) has completed as a three wave correction to 1.0176. Rise from 0.9534 is still intact, and might be ready to resume. Decisive break of 1.1274 will target 100% projection of 0.9534 to 1.1274 from 1.0176 at 1.1916. Also, that will send EUR/USD through a multi-decade channel resistance will carries larger bullish implication. This will now be the favored case as long as 1.0531 resistance turned support holds.
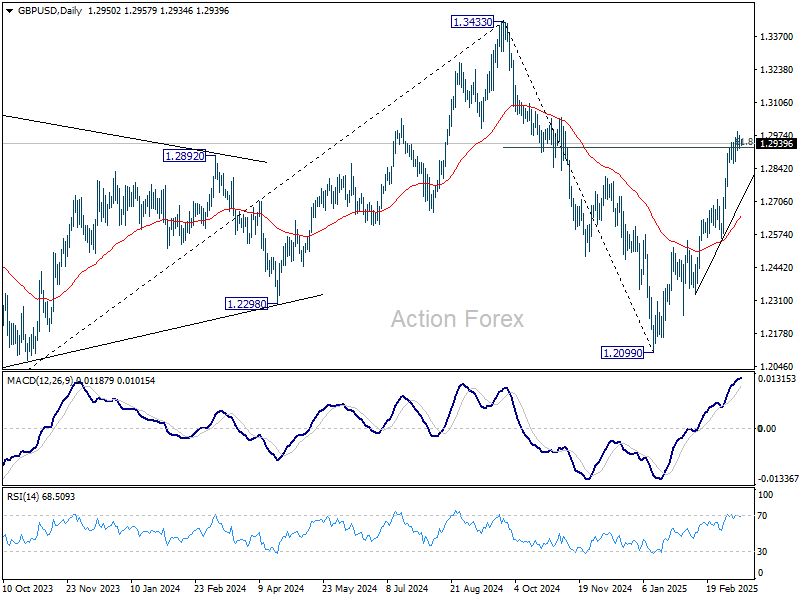
GBP/USD Daily Outlook
Daily Pivots: (S1) 1.2923; (P) 1.2949; (R1) 1.2978; More...
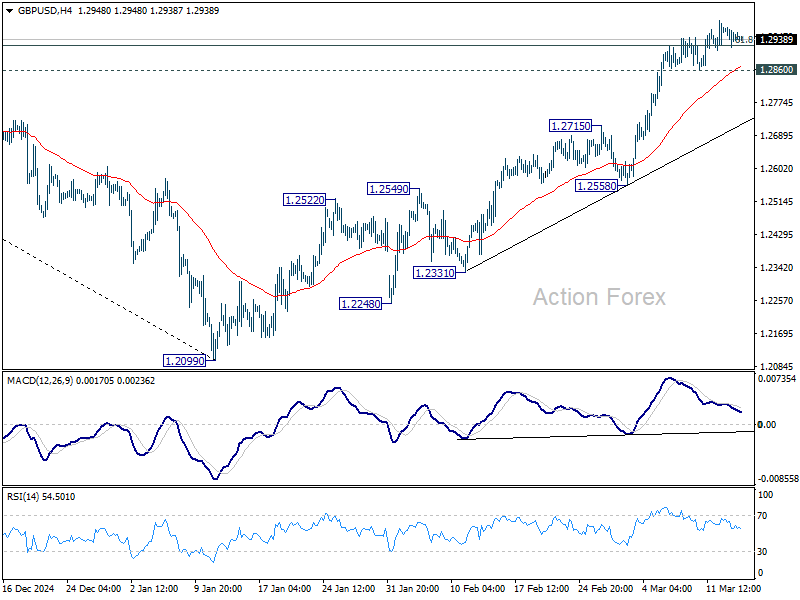
No change in GBP/USD's outlook, and further rally is mildly in favor with 1.2860 minor support intact. Sustained trading above 61.8% retracement of 1.3433 to 1.2099 at 1.2923 will resume the rise from 1.2099, and pave the way back to 1.3433 high. Nevertheless, break of 1.2860 support should indicate short term topping and turn bias back to the downside for deeper pullback.
In the bigger picture, fall from 1.3433 (2024 high) should have completed at 1.2099 as a corrective move. Up trend from 1.3051 (2022 low) is still in progress but it's too early to say that it's resuming. Corrective pattern from 1.3433 could extend with one more down leg. But after all, eventual upside breakout is expected at a later stage.