Sample Category Title
Forex Analysis: EURJPY And GER30
The EURJPY pair attempted to reach the 133.500 level this week but has dropped back to form a triangular pattern. This is forming inside a larger wedge pattern, marked out here with blue trend lines, and the recent high formed the third touch on the top line of this pattern. A break higher above the red trend line at 1.33250 would target the previous high, followed by the 133.479 level and the rising trend line at 133.594. Above this area, resistance levels come in at 133.820, 134.493 and 135.000.
The small blue supporting trend line comes in at 132.911, with a loss of this line sending prices towards the 50-period MA at 132.683 and the bigger supporting trend line at 132.520. A loss of this line would trigger new short positions, with the pattern becoming a rising bearish wedge. At this point, a large move lower could occur, with the 100-period MA at 132.286 and the 200-period MA at 132.022 taken out, and 131.815 tested, possibly offering a bounce for a retest of the wedge bottom. Targets in the short term come in at the 131.000 level and the 130.555 area, followed by 130.000.

GER30 Index
The GER30 index has been pushed lower, creating a false breakout on the daily chart above the red trend line. The chart shows the 12375.50 level has been used as support today, with yesterday’s low coming in at 12309.50. A loss of these supports would indicate a leg lower, targeting the 12212.00 level, followed by 12096.50 and 12000.00. Below 12000.00 the price enters a supportive area that can see buyers stepping in, with trend line support at 11825.00 and the previous low at 11681.20. Below the 11400.00 level, the market would turn very bearish and could free fall to 10850.00.
Resistance comes in around the 12475.00 level and the red trend line. A break above this area has to overcome the 100 and 200 DMAs at 12525.0 and then the black trend line at 12610.00, with the high from Tuesday at 12650.00. A break higher can put pressure on bearish stops and extend up to 12820.00, followed by 12900.00 and 13000.00. But at the moment, the picture remains neutral ahead of the ECB release today.

Currencies: EUR/USD Rally Slowing?
- Rates: Global core bonds ended slightly lower
Stronger US retail sales and for the European markets, some catching up with US Treasury losses on the Stanley Fisher rumour, defined another low volume session. Today, there are again few eco data or events on the calendar, but the technical picture of the US Note future is interesting, retaining our attention. - Currencies: EUR/USD rally slowing?
Yesterday, EUR/USD again failed to regain the 1.3832 year top. Is the EUR/USD rally finally running into resistance? USD/JPY is testing the 103.74 reaction top. Today, the calendar is thin. Will the dollar be better bid ahead of the Fed meeting next week?
The Sunrise Headlines
- US stock markets ended mixed to slightly higher as strong corporate earnings balanced the rise in US yields. Asian sentiment is mostly positive with China underperforming on rumours of an FBI probe into Huawei.
- The ECB won’t alter its forward guidance at today’s policy meeting. Such changes are expected in June or July. We expect Draghi to keep a positive tone despite the recent setback in some economic indicators.
- French President Macron said it was his “bet” that President Trump would withdraw the US from the Iran nuclear deal, a move he said would lead to a period of heightened tensions with an outcome that was hard to predict. (WSJ)
- BoC Governor Poloz said the economy was "finally positive" after a long adjustment, even if there was still softness in several areas of the country. The neutral rate is somewhere between 2.5% and 3.5%. (Reuters)
- China’s cabinet, is weighing proposals to reduce the levy on imported cars to 10 percent or 15%, according to people, who asked not to be identified as the information isn’t public. The current rate is 25%. (BB)
- South Korea's economy bounced back last quarter (1.1% Q/Q from -0.2% Q/Q), buoyed by booming exports of data memory chips and a boost from government spending, although private consumption was sluggish. (Reuters)
- Focus turns to the ECB meeting today. The Swedish Riksbank meets as well. Eco data include US weekly jobless claims, trade balance and durable goods orders. The US ends its supply operation with a $29bn 7-yr Note auction
Currencies: EUR/USD Rally Slowing?
Will Draghi comments slow EUR/USD decline?
The established trends in (US) yields and the dollar basically continued yesterday.US yields drifted higher and several maturities are testing high profile resistance levels. This momentum in US yields also supported the dollar, but the pace of the USD rebound remained gradual. Some euro softness ahead of the ECB meeting was probably also at play. EUR/USD closed the session at 1.2161, but a real test of the 1.2155 support didn’t occur yet. USD/JPY finished the day at 109.43.
Overnight, Asian equities show a mixed picture. Some tech-related stocks are supported by good results from Facebook and Samsung Electronics. Chinese equity markets again underperform. The USD maintains most of its recent gains. USD/JPY trades around 109.35. EUR/USD ‘rebounded’ to the 1.2175 area. Oil ($74.40 p/b) is holding up well after a slowdown in the rally over previous two days.
The US eco calendar is well filled today with durable goods orders, trade balance, jobless claims and inventory data. Growth in durable orders is expected to slow after a rebound in February. Good US data might support the positive momentum in US yields and the dollar, but the upcoming data (GDP tomorrow and early month data next week) are probably more important. The ECB is expected to maintain its assessment from March. Recent data were soft, but Draghi will probably confirm that growth remains solid and that inflation is improving. His message might be less soft than what recent data suggested. Question is whether any ‘less dovish tone’ will be enough to stop the EUR/USD slide, which is basically inspired by USD strength. The jury is still out, but we see a decent chance of EUR/USD breaking the 1.2155 range bottom if the upcoming US data are OK. The trade-weighted dollar already broke beyond the top of the ST range.
EUR/GBP developed a tentative intraday downtrend yesterday. We assume that some underlying euro strength was at play. Cable declined from the 1.40 area to close the day 1.3932, mostly due to USD strength. There was no high profile news on Brexit issues. CBI retail data will be published today. A cautious improvement is expected after a deterioration in previous months (-3 from -8). The impact of the CBI data on sterling is usually modest. We expect more technical trading with markets looking forward to the UK Q1 GDP release tomorrow.
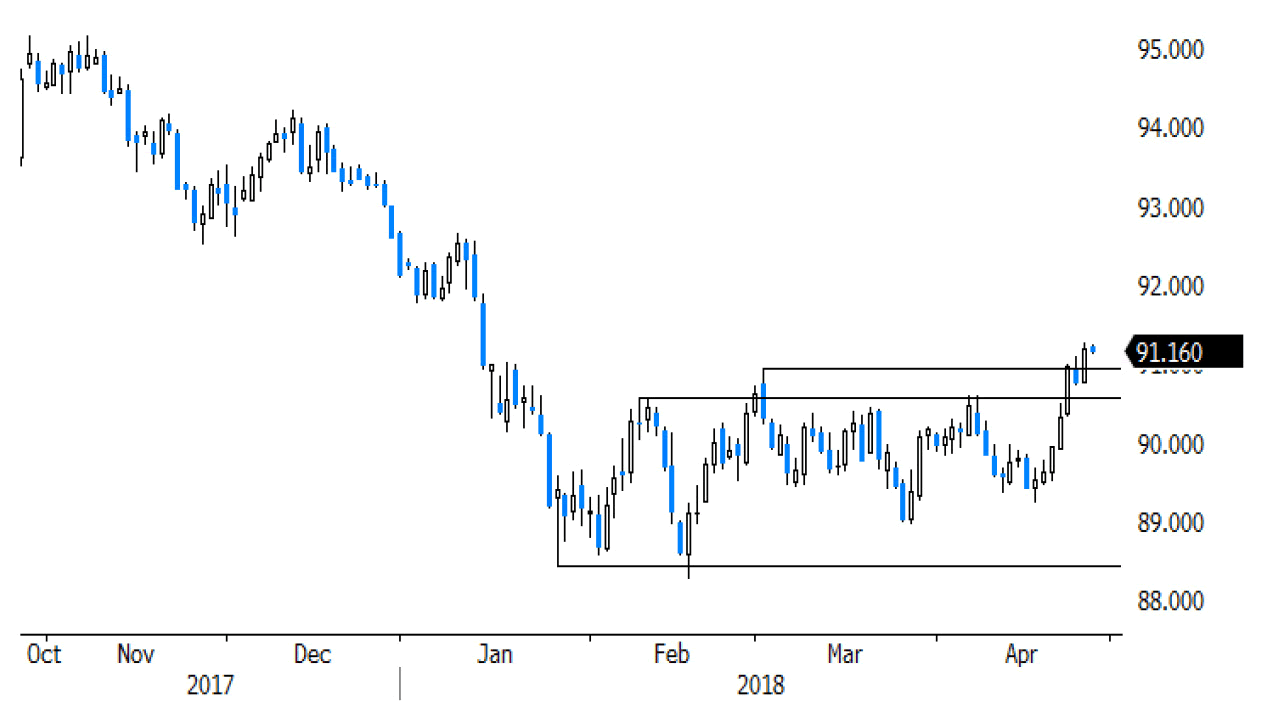
USD trade-weighted (DXY) tries to break out of recent consolidation pattern
USDJPY – Bulls Focus Targets At 110.00/25 But Consolidative / Corrective Action May Precede
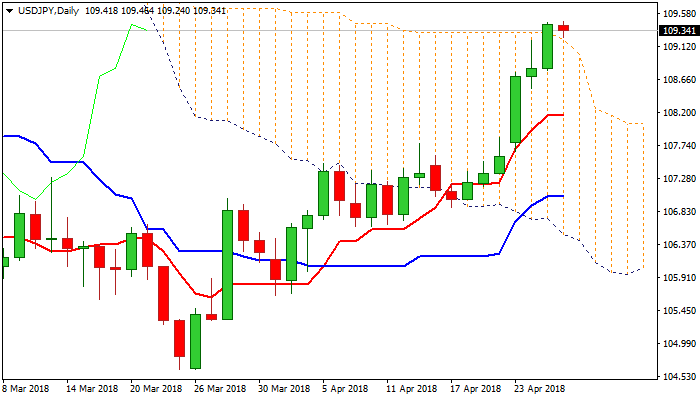
The pair trades within narrow consolidation on Thursday, holding under new high at 109.46, posted after another strong rally on Wednesday and retested today.
Eventual close above daily cloud top was bullish signal, but overbought daily RSI and slow stochastic warn of corrective easing.
Overall structure remains firmly bullish and see pullback as positioning for fresh upside, as targets at 110.00 (psychological) and 110.25 (200SMA) are in focus.
Strong supports at 109 zone (cloud top / 100SMA) should contain dips and keep bulls intact.
Repeated close above daily cloud top is needed to reconfirm strong bullish signal for further advance.
Alternatively, loss of 109 handle would risk deeper pullback and expose pivotal support at 108.47 (Fibo 38.2% of 106.88/109.46 upleg).
Res: 109.46; 109.78; 110.00; 110.25
Sup: 109.24; 109.00; 108.85; 108.47
GBPUSD – Bears Probe Through 1.3920 Base, Eye 100SMA support
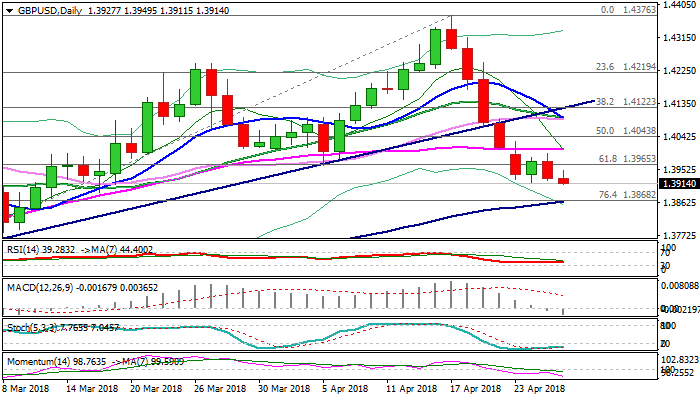
Cable stands at the back foot on Thursday and pressures temporary base at 1.3920, where recent strong fall from 1.4376 peak found footstep.
Narrow consolidation in past few sessions remained capped under pivotal 1.40 barrier (psychological resistance, reinforced by 55SMA), while today’s recovery attempts were capped by daily cloud top (1.3950), keeping overall bears intact and risking further weakness.
Weakening momentum studies and formation of double bear-cross (10/20 & 10/30SMA) maintains pressure for break through 1.3920 base and cloud base at 1.3901, to signal extension of steep downtrend towards next strong supports at 1.3868/64 (Fibo 76.4% of 1.3711/1.4376/rising 100SMA).
Res: 1.3950, 1.3965, 1.4000, 1.4043
Sup: 1.3901, 1.3868, 1.3854, 1.3780
Bitcoin Trading Below 9000
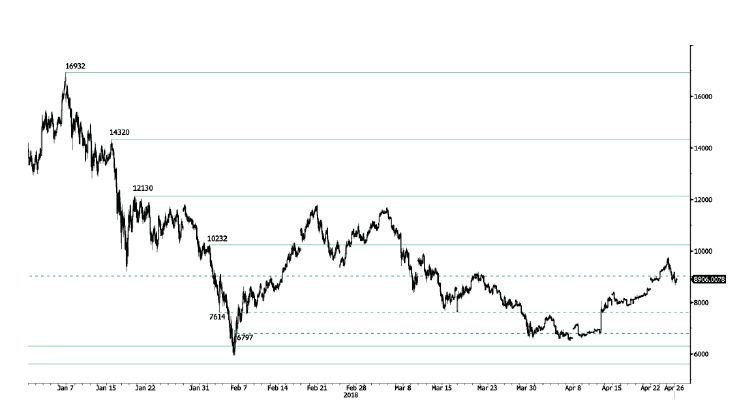
Bitcoin rise started in mid April slightly weakens, currently trading below 9000 and heading along the 8750 range. Bitcoin bearish pattern started in March 2018 strengthens. The pair is contained between hourly support and resistance given at 6306 (13/11/2017 low) and 10232 (01/02/2018 high). The technical structure suggests short-term decrease.
In the long-term, the digital currency has had an exponential growth but also presented important downturns. There is decent likelihood that the currency could stabilize between 7'000 - 12'000 in 2018. Bitcoin is trading slightly above its 200 DMA (8000 range)
CRUDE OIL Rising
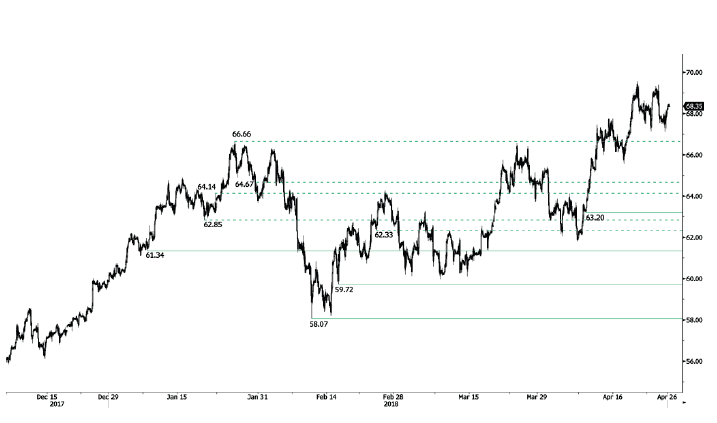
Crude oil is increasing, trading above 68 and heading along the 68.50 range. Crude Oil is trading at its December 2014 high. The bullish pattern started in November 2017 is maintained. Hourly support at 63.20 (10/04/2018 low) is distanced. The technical structure suggests short-term upward moves.
In the long-term, crude oil has recovered after its sharp decline last year. However, we consider that further weakness is very likely. For the time being, the pair lies in an upside trend since June 2017. Support lies at 42.20 (16/11/2016) while resistance is located at 77.83 (20/11/2014). Crude oil is trading largely above its 200 DMA.
SILVER Edging Higher
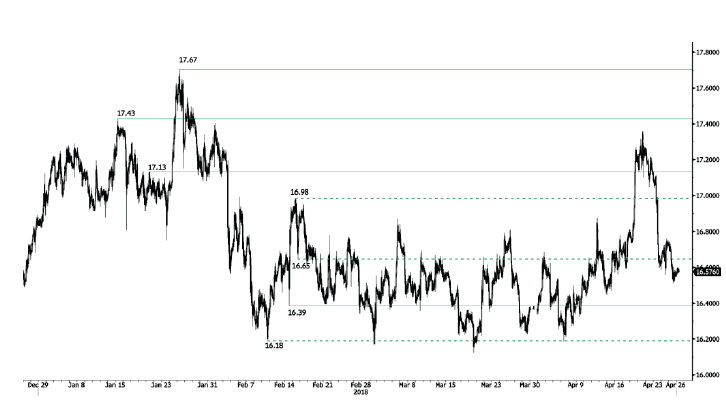
Silver is rising back following recent decline at 16.51 low, heading along the 16.65 range. Hourly support and resistance are given at 16.39 (14/02/2018 low) and 17.13 (19/01/2018 high). The technical structure suggests short-term increase.
In the long-term, the trend remains negative/ sideways. Further downside is very likely. The pair is trading below its 200 DMA. Resistance is located at 21.58 (10/07/2014 high). Strong support can be found at 11.75 (20/04/2009).
GOLD Trading Above 1325
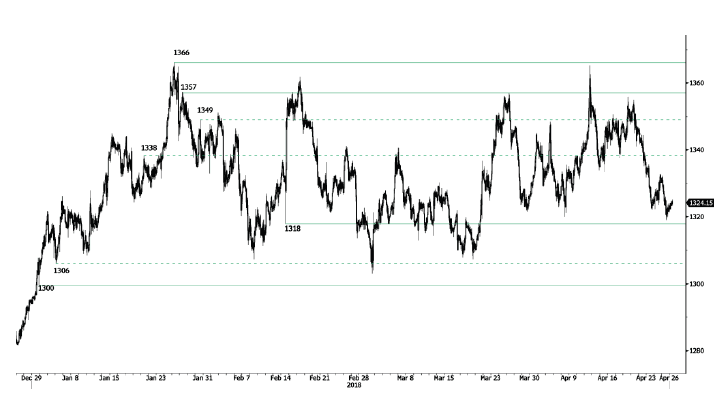
Gold is bouncing off from 1319 low, currently trading above 1325 and approaching the 1327 range. Hourly support and resistance are given at 1318 (14/02/2018 low) and 1357 (26/01/2018 high). The technical structure suggests shortterm upward moves.
In the long-term, the technical structure suggests that there is a growing upside momentum. A break of 1'392 (17/03/2014) is required to confirm it. A major support can be found at 1'045 (05/02/2010 low).
EUR/CHF Maintained Below 1.20
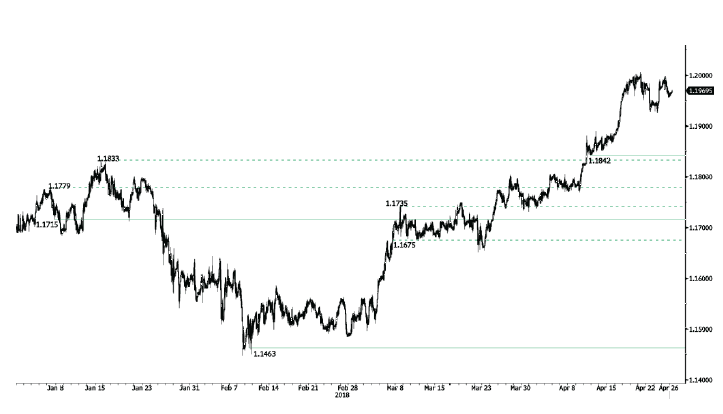
EUR/CHF is bouncing off from 1.1956 low, heading along the 1.1975 range. Strong resistance at 1.20 remains. Hourly support given at 1.1842 (11/04/2018 low) is distanced. The short-term technical structure suggests further short-term sideways trading moves.
In the longer term, the technical structure has reversed. Strong resistance at 1.20 (level before the unpeg) is now at reach. The ECB's slowing QE program is likely to cause buying pressures on the euro, which should weigh in favour of the EUR/CHF. Support and resistance can be found at 1.0624 (24/06/2016 low) and 1.2097 (18/12/2014 high).
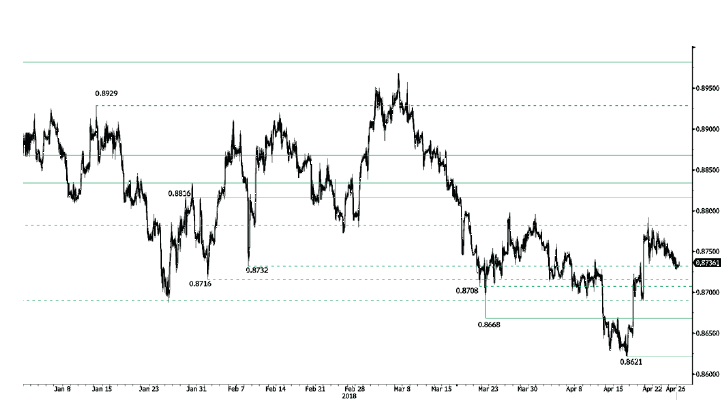
EUR/GBP Trading Below 0.875
EUR/GBP starts a recovery phase, heading along the 0.8740 range. EUR/GBP bearish pattern started in March is weakened. Hourly support and resistance are given at 0.8668 (22/03/2018 low) and 0.8816 (29/01/2018 high). The technical structure suggests short-term increase.
In the long-term, the pair has largely recovered from 2015 lows. The technical structure suggests further upside pressure. Strong resistance can be found at 0.9500 (psychological level) while support remains at 0.8304 (05/12/2016 low). The pair is trading below its 200 DMA.