Sample Category Title
Gold Technical Bearish Structure Formed
Tension in Syria may have eased slightly with Trump's suggestion of withdrawing US troops given that ISIS was largely contained. Macron's views by comparison were slightly different, raising concerns still that instability in Syria will remain. On the flipside, as Oil prices have been rising, the US dollar hegemony on Oil contracts is at threat with China, Russia and Iran now finding an alternative to the US dollar for Oil contracts. US Treasury yields continue to rise, and is it a direct result to maintain demand and confidence in the US dollar is yet to be confirmed, but rising yields may push risk-off allocations towards Bond yields instead of Gold.
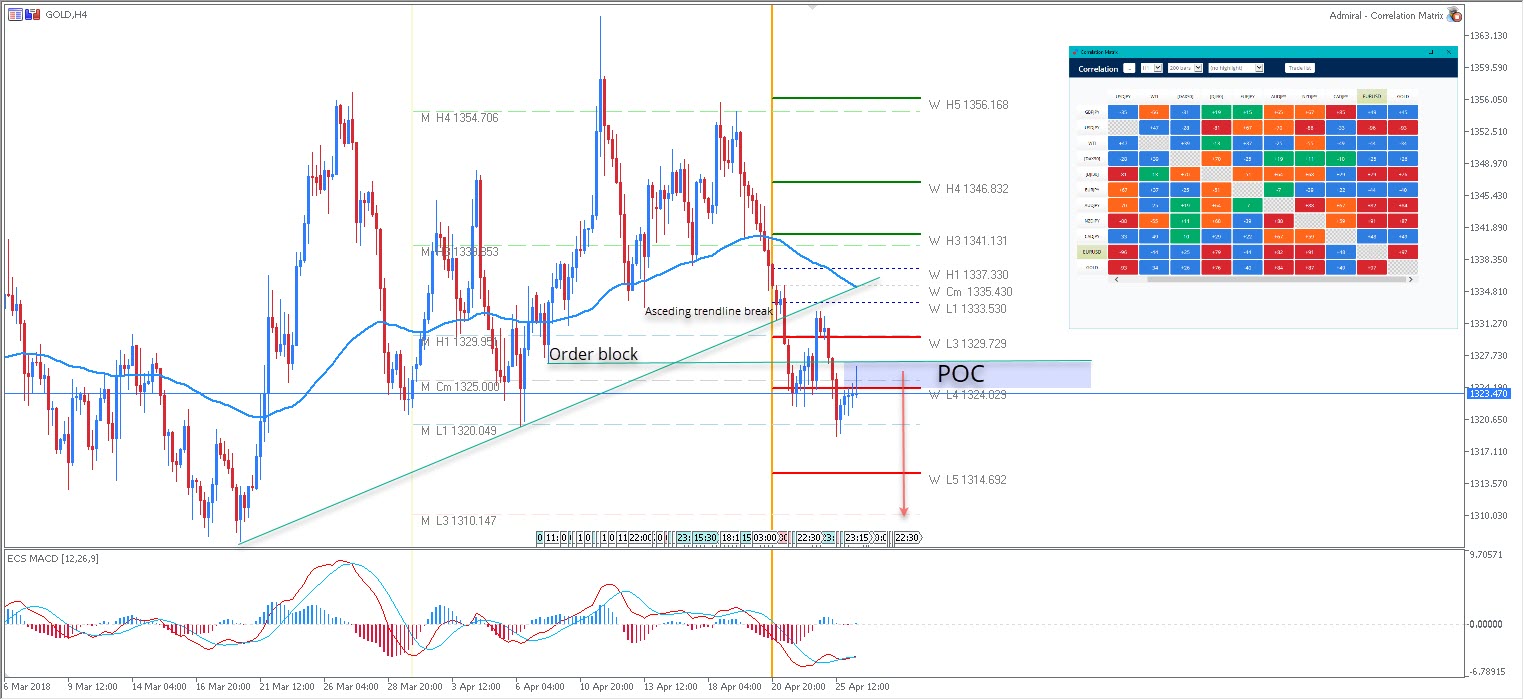
Looking at the correlation matrix, you can also see that there is a huge positive correlation between GOLD and EUR/USD. A drop in the EUR/USD also reflects on GOLD and vice versa. 1324-25 is the zone where we might see additional rejections towards M L1 -1320.049 and W L5 – 1314.69. This also implies a huge bearish structure that is a bit M-shaped so the Gold could be going for monthly L3 retest indeed -1310.14.
Source: Admiral Markets MT5 with MT5SE Add-on
W L3 - Weekly Camarilla Pivot (Weekly Interim Support)
W H3 - Weekly Camarilla Pivot (Weekly Interim Resistance)
W H4 - Weekly Camarilla Pivot (Strong Weekly Resistance)
M H4 - Monthly Camarilla Pivot (Very Strong Monthly Resistance)
M L3 – Monthly Camarilla Pivot (Monthly Support)
M L4 – Monthly H4 Camarilla (Very Strong Monthly Support)
POC - Point Of Confluence (The zone where we expect price to react aka entry zone)
ECB Is Coming
Let the ECB balancing act begin
It's universally expected the ECB will make no change in policy or communication today. The weaker incoming data has provided plenty of cover for ECB member to talk down “normalization” even introduce speculation that an increase to the current €30billion asset purchase program is actually on the table. The subdued inflation trajectory is unlikely to improve by June due to stronger Euro and slower growth momentum. However, real consideration of another QE extension we suspect is a smoke screen. First of all the current slowdown is global and generally considered transitory in nature. French and German flash PMI have already indicated a pick-up. Second is the fact the overall conditions in Europe have broadly improved.
The transition from economic recovery to expansion continue with GDP growth expected estimated around 2.2% for the Euro area. Hardly data that requires extremely policy action which include negative interest rate and extended asset purchases. As with the Fed in 2014 a significant factor tightening was the desire to get policy off the bottom just in case an economic situations demanded real action. Central banks need policy tool free and available and right now, the ECB is completely tied up. There was also fear that the Fed was not actually generating inflation, and driving the real economy but merely encouraging risk taking. As of these discussion are being had inside the ECB. In addition Riksbank decisions to keep policy unchanged and keep dovish bias given the broader macro backdrop serves to only highlight the disconnect between action and results.
Despite the ECB effort to create the appearance of two way action there is only one way the policy can go. Draghi will clearly dance at today Press conference to keep the market guessing and not providing a bullish signal for EUR buyers. Draghi will be less dovish then March 8th but downplay market expectations for inevitable policy tightening. We anticipate that July will bring details for deceleration of asset pushed form €30bn to €15 in October and zero by years end. Given out base scenarios, especial given our view that US 10 years have topped at 3.01%, we are positioning ourself for a EURUSD rally.
SNB takes CHF 6.8 billion loss in Q1 2018
The Swiss National Bank reported a substantial loss for the first quarter 2018 as capital markets experienced a stormy environment, while the Swiss franc started the year off the wheel. Despite pocketing CHF 3 billion in dividend and interest payments, the central bank took valuation losses of CHF 3.9 billion on its bond positions, CHF 3.3 billion on its equity portfolio and CHF 0.2 billion on its gold holdings. Finally, the appreciation of the Swiss franc produced a foreign exchange loss of CHF 2.8 billion, while the revenue from Swiss franc positions reached CHF 0.5 billion.
The surge in interest rates in the euro zone and in the US, together with turbulences in equity markets, have significantly hurt the SNB's portfolio during the first quarter. However, the second quarter will most likely be more favourable as the Swiss franc extended losses against all its G10 peers, falling 2.9% against the greenback, 2.15% against the pound and 1.8% against the single currency. The situation on the equity market is more balanced as European markets have recorded solid performance in April, while US ones have not moved much. Unfortunately, the bond prices are set to experience further downside as interest rates are rising on both side of the Atlantic.
EURUSD Analysis: Falls To 2018 Support
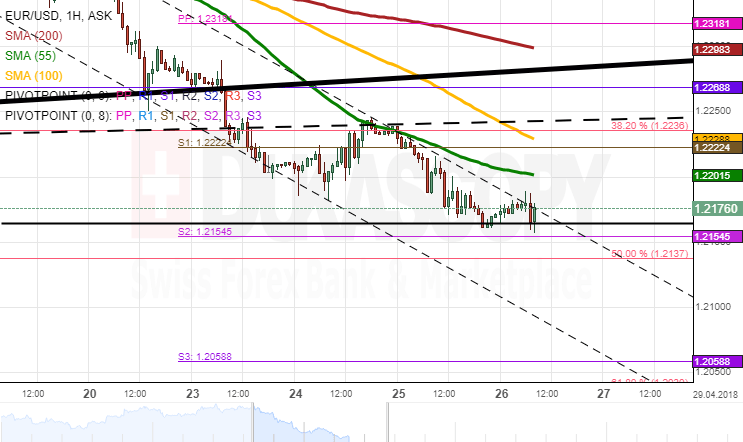
EUR/USD failed to pick up momentum on Wednesday and remained below the 55-hour SMA. The downside momentum was strong enough to breach the 100-day SMA at 1.22 and push the rate down to the monthly S1 and the weekly S2 at 1.2170.
Given that the pair has failed to move below this level since the very beginning of 2018, the first part of the session should mark a slight recovery up to the 55-hour SMA, the weekly S1 and the 38.20% Fibonacci retracement.
Traders are likely to maintain volatility at low levels during this time prior to the ECB Minimum Bid Rate and the press conference today at 1145GMT and 1230GMT, respectively. These releases could guide the market sentiment during the second part of the day. The pair, however, should remain in the 1.2150/1.2300 range.
GBPUSD Analysis: Remains Calm This Morning
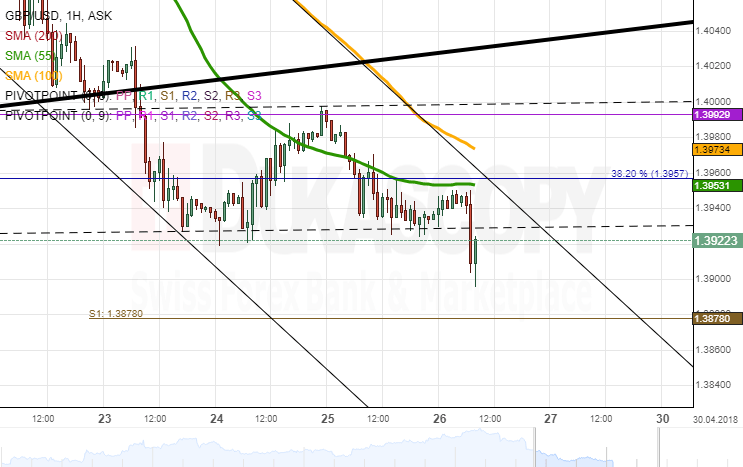
The Sterling was driven by downside potential during the first part of Wednesday. The rate stabilised mid-session and was subsequently trading in a narrow 1.3928/57 range.
It is expected that the pair increases its volatility soon and ends this slight movement sideways. Bulls might fail to break out northwards, as the 1.3960 level is reinforced by the 38.20% Fibonacci retracement and the 55– and 100-hour SMAs. This cluster could force the Pound lower towards the 1.39 mark, as likewise signalled by bearish technical indicators.
The nearest support is set by the distant weekly S1 at 1.3880 which might not actually be reached today if the US Core Durable Goods Orders do not provide any negative surprises. Meanwhile, the ultimate high for today should be 1.40.
USDJPY Analysis: Breaches Steep Junior Pattern
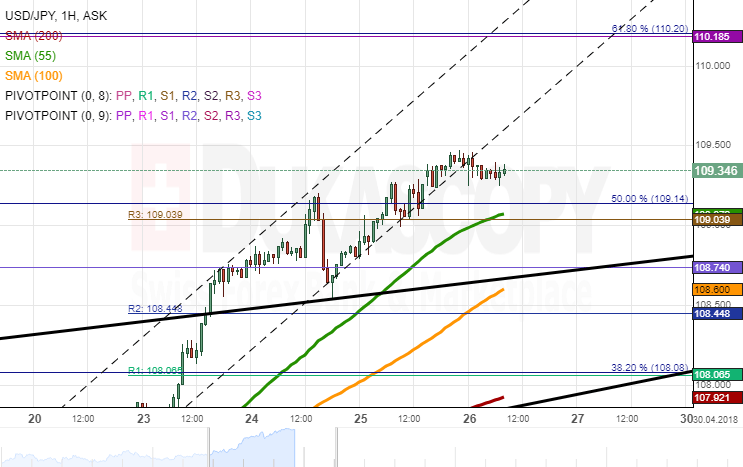
The US Dollar managed to resume its strong upside momentum on Thursday and shot up 63 pips during the day. The pair surpassed the weekly R3 and the 50.0% Fibonacci retracement and was trading at the 109.50 at the time of this analysis.
Given that the pair breached the short-term ascending channel early in the session, the pair might go for a minor correction south. The nearest support is the 55-hour SMA and the weekly R3 at 109.00.
It is likely that the Greenback edges even lower and tests the upper boundary of the breached five-week ascending wedge and the monthly R2 at 108.70.
In general, the bearish sentiment could prevail in the remaining part of the week, thus giving bulls some time to recuperate and continue its upward momentum.
ECB previews and levels to watch: EURUSD 1.2154, EURCAD 1.5608, EURCHF 1.2, EURAUD 1.6189
Euro recovers broadly as traders are awaiting ECB rate decision and press conference. No change in monetary policy is expected today. Main refinancing rate should stay at 0.00%, deposit facility rate at -0.40% and marginal lending facility rate at 0.25%. The EUR 30B per month asset purchase program will continue to run until end of September as planned.
ECB's press conference could be watched here if you're interested.
Here are some ECB preview reports:
- ECB Preview: Caution over Recent Slowdown Won't Affect QE Schedule
- ECB Meeting: Staying "Cautious" for Now?
- No Change to ECB Guidance Yet
- Potentially Dovish ECB Could Accelerate EUR/USD's Breakdown
- ECB Preview – Not On Draghi's Watch
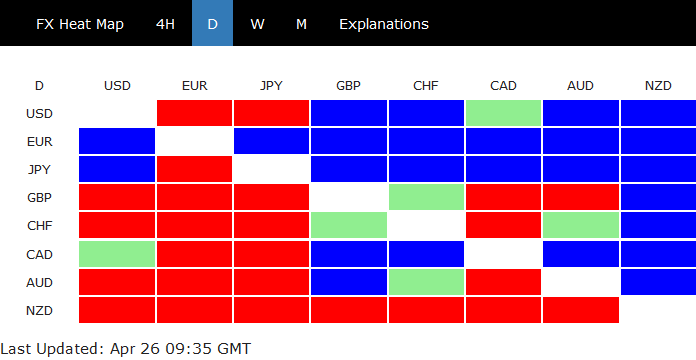
EUR's recovery is actually quite weak considering that it's limited below yesterday's highs, which are not far away.
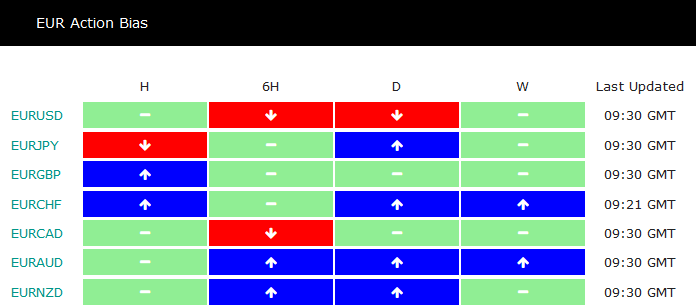
 EUR's own outlook is mixed too. EUR/USD, is near term bearish. But EUR/CHF, EUR/AUD and EUR/NZD are bullish. EUR/JPY and EUR/CAD and EUR/GBP are mixed from action bias table.
We'd prefer not to anticipate whether Euro traders will react positively, or negatively to ECB press conference. However, if the response is positive, 1.2 in EUR/CHF is the first one to look at, and 1.6189 the second.
If the response is negative, 1.2154 in EUR/USD is the first level to watch. And the second will be 1.5608 in EUR/CAD, yesterday's low.
Gold Analysis: Returns To 55-Hour SMA
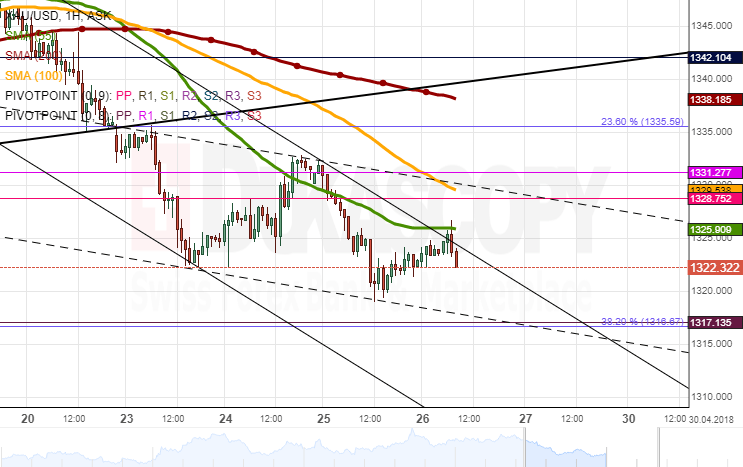
The first part of Wednesday's trading session was spent under the bearish pressure, as the yellow metal lost 0.88% against the US Dollar. This fall reversed at the 1,320.00 mark—which is also the April low—and regained some lost positions just to test the 55-hour SMA on Thursday morning.
It seems that the pair is ready to breach a one-week descending channel and is moving towards the confirmation of a newly-word channel down at 1,328.70. The 100-hour SMA and the monthly PP are likewise located at this mark.
It is likely that this area forces a bearish reversal and sends the pair for another decline. The nearest support is set by the 38.20% Fibonacci retracement, while Gold could push even lower down to the 1,310.00 territory.
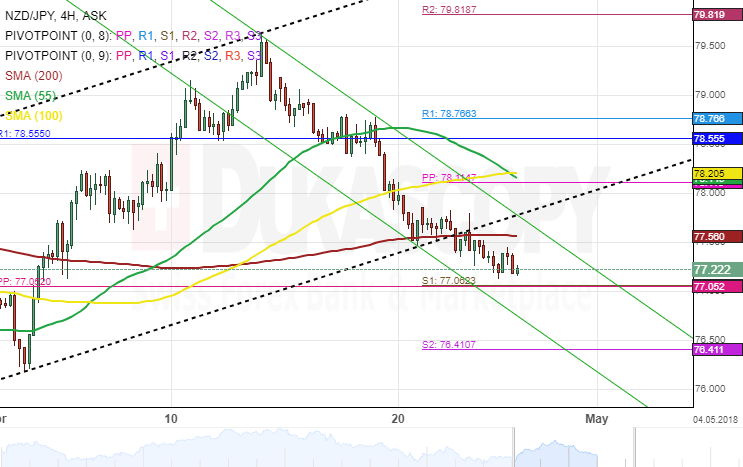
NZD/JPY 4H Chart: SMAs Provides Sell Signals
The New Zealand Dollar has been trading in an ascending channel against the Japanese Yen since late March. However, after the currency pair hit the upper boundary of a junior channel, the pair began to decline.
Given that a breakout had occurred through the bottom border of this pattern, it is expected that the NZD/JPY exchange rate could be set for a long-term decline.
Moreover, the simple moving averages have provided the sell signals. The pair has breached both the 55-, 100-, and the 200– hour SMAs.
Technical indicators suggest that bears are likely to grow stronger during the following trading session. Nevertheless, it is important to point that a support cluster set by the combination of the weekly and the monthly near the 77.21 regions might prevent the rate from falling.
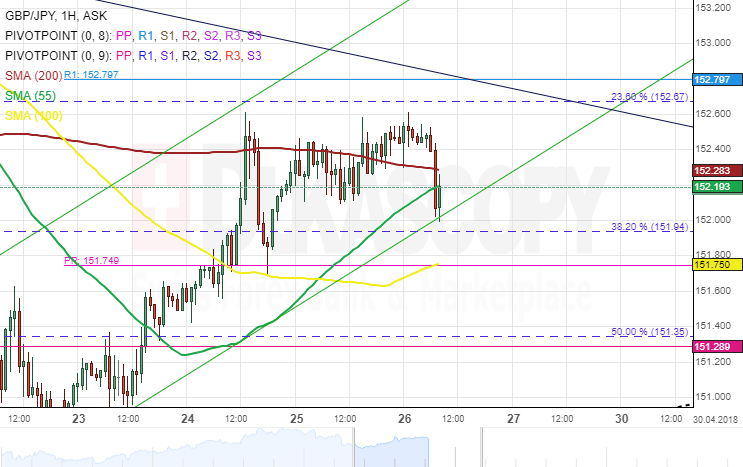
GBP/JPY 1H Chart: Bulls Likely To Grow Stronger
The Pound Sterling has been trading in several ascending patterns against the Japanese Yen. The most important of which is the newly drawn junior channel formed on April 22.
After hitting the 61.80% Fibonacci retracement level, the currency pair began to surge. This retracement can be measured by connecting the April 2 low at 148.83 and the April 13 high at 153.86.
Everything being equal, it is expected for the exchange rate to breach and move past the upper border of a medium-scale triangle.
Technical indicators suggest that bulls could continue their dominance over the GBP/JPY currency exchange rate during the following trading sessions
Forex Technical Analysis: EUR/USD, USD/JPY, GBP/USD
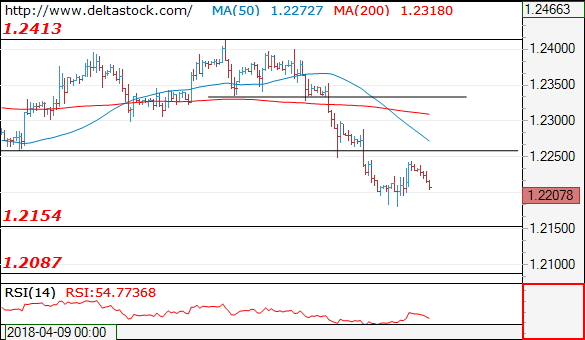
EUR/USD
Current level - 1.2176
I favor a break through 1.2160 to challenge 1.2090 major static support.
| Resistance | Support | ||
| intraday | intraweek | intraday | intraweek |
| 1.2250 | 1.2412 | 1.2160 | 1.2160 |
| 1.2335 | 1.2560 | 1.2090 | 1.2090 |
 USD/JPY
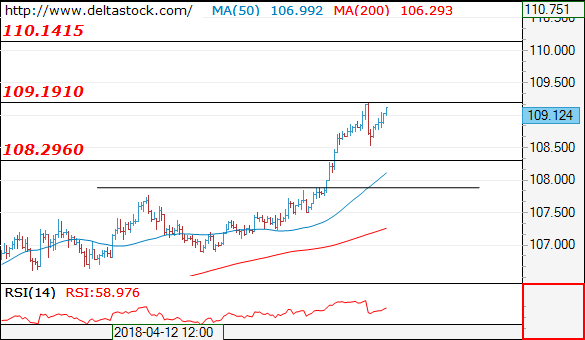
Current level - 106.33
The uptrend is intact, heading towards 110.20 area. Crucial on the downside is 108.50 and initial intraday support is projected at 109.20.
| Resistance | Support | ||
| intraday | intraweek | intraday | intraweek |
| 110.20 | 110.20 | 109.20 | 106.60 |
| 110.20 | 111.90 | 108.50 | 104.60 |
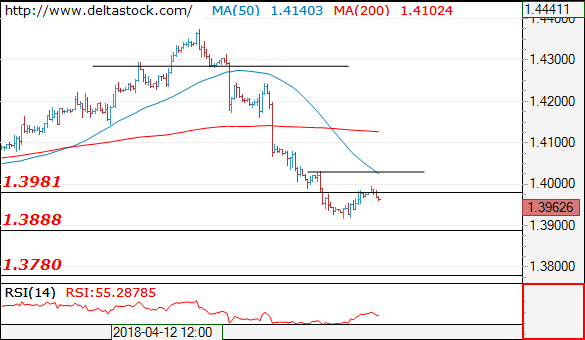
GBP/USD
Current level - 1.3938
My outlook is bearish, for a break through 1.3915, towards 1.3780. Key resistance lies at 1.3990.
| Resistance | Support | ||
| intraday | intraweek | intraday | intraweek |
| 1.3990 | 1.4280 | 1.3915 | 1.3780 |
| 1.4150 | 1.4280 | 1.3780 | 1.3710 |