Sample Category Title
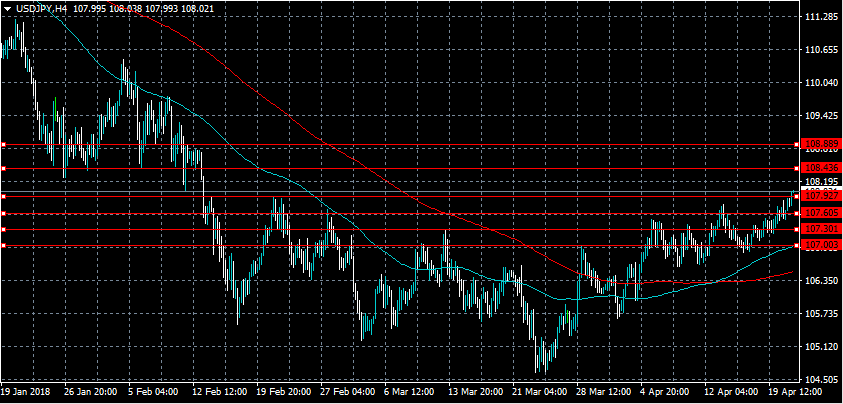
USDJPY Strongly Bullish Above 107.92 Level
The U.S dollar has continued to advance to the upside against the Japanese yen, as rising longer-term U.S Treasury Yields help to lift the U.S dollar index higher across the board. The USDJPY pair currently trades above the 108.00 level, after earlier breaking above the key 107.92 resistance level. Traders now await the release of key U.S Manufacturing data, while USDJPY buyers look for further intraday bullish advancement above the 107.92 level.
The USDJPY pair is strongly bullish while trading above the 107.92 level, further gains towards the 108.43 and 108.88 levels remains possible.
If price-action on the USDJPY pair declines below 107.92 level, sellers may test the 107.60 and 107.30 support regions.
EURUSD Further Bearish Below 1.2248 Level
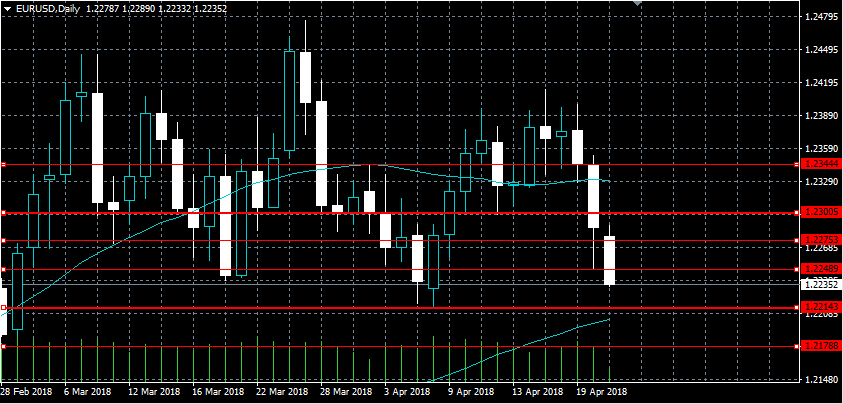
The euro has moved sharply lower against the greenback during the European trading session, as the U.S dollar index climbs to its highest trading level since, March 1st. The EURUSD pair currently trades around the 1.2230 level, with price-action continuing to edge lower towards the key 1.2214 support level. Moving into the U.S session, traders look towards U.S Manufacturing data and the key 91.00 level on the U.S dollar index.
The EURUSD pair is strongly bearish while trading below 1.2248 level, further losses towards the 1.2214 and 1.2175 levels seem likely.
Should price-action on the EURUSD pair move above the 1.2248 level, buyers may test the 1.2275 and 1.2300 resistance levels.
Forex Analysis: EURUSD And EURGBP
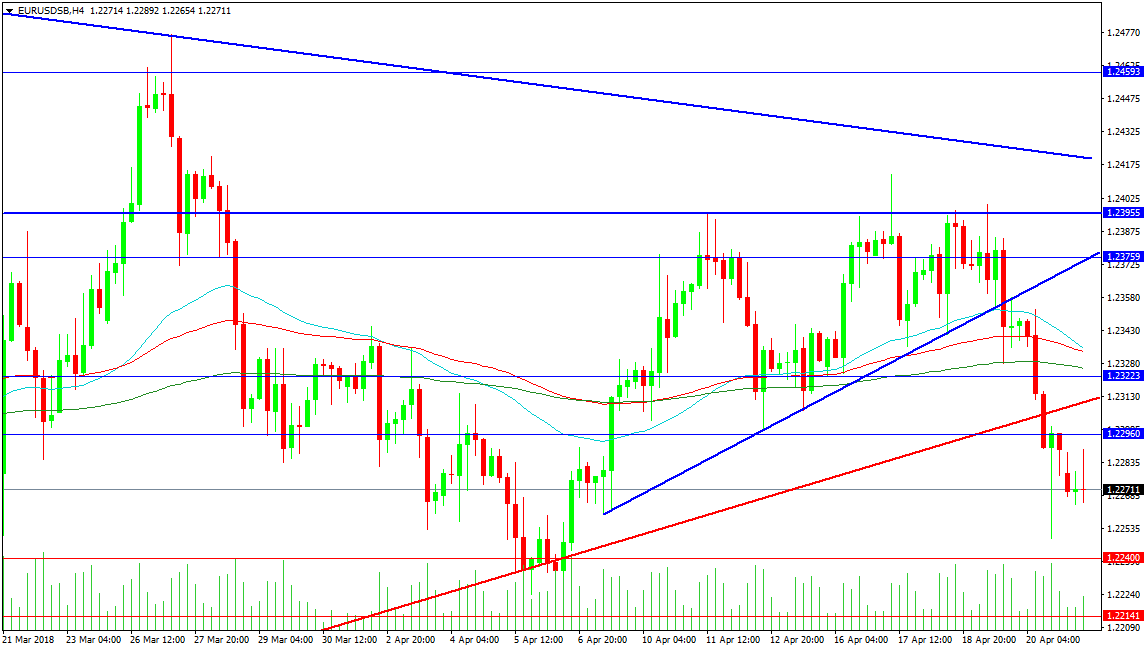
The EURUSD pair has fallen lower after losing trend line and moving average support. The price dropped to a low on Friday of 1.22490. Below this level, there is support at 1.22400 and the 1.22000 area. A loss of those levels would target 1.21640 and 1.21111 in extension. There is major trend line support at 1.20250.
The resistance levels above the current price level are found at 1.23000 initially, with the red trend line positioned at 1.23100. The 1.23223 level marks out the start of an area of resistance, about 20 pips in range, containing the 50, 100 and 200-period moving averages. Above this, the blue ascending trend line is found at 1.23750, with recent price action highs topping out around 1.23950. The high from last week comes in at 1.24133 with the descending blue trend line at 1.24200.
EURGBP
This pair has moved higher since the middle of last week due to declining UK economic data. Resistance has been tested at 0.87917 and price has moved down to support at 0.87574. A break out higher could target resistance at 0.88000, followed by 0.88084 and 0.88364. Resistance above this comes from important levels at 0.88436, 0.88595 and 0.88743.
Support is visible at the 200-period MA at 0.87500, followed by the 100-period MA at 0.87200, the 0.87162 level and the 50-period MA at 0.87121. The 0.86900 level has formed a notable area of support which price broke above and retested late last week. The 0.86671 level was used as resistance last week when price dipped and a break above that level forced price to surge higher. The low of last week at 0.86200 is critical support, with a drop under this level targeting 0.85000 in extension.
Gold Hits Near Two-Week Low, Looking Bearish In The Short-Term
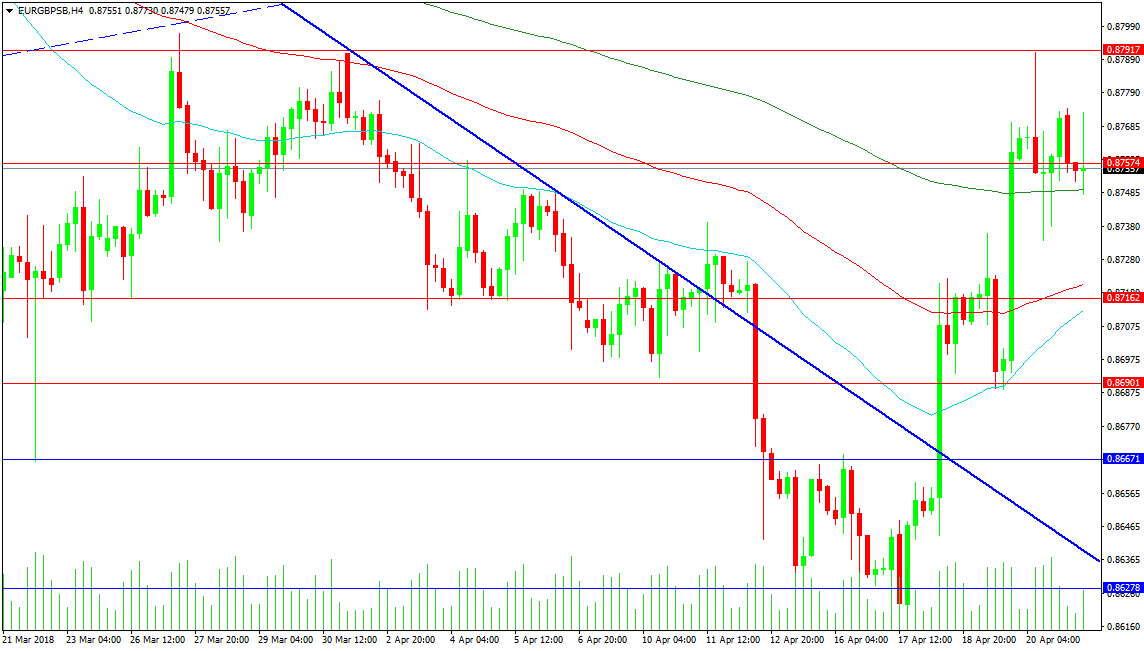
Gold plunged during today’s European session, following declines in the two previous days. The price reached a two-week low of 1330.70 after the pullback on the 1355 resistance level. It is worth mentioning that the price has been trading within a range since January 25 with the 1365 resistance level being the upper boundary and the 1307 support level the lower boundary.
From the technical point of view in the 4-hour chart, the RSI indicator is sloping to the downside and is approaching oversold levels, while the MACD oscillator is moving sharply lower below its trigger and zero lines, entering negative territory. The 20- and 40-simple moving averages are ready to record a bearish cross, signaling further downside pressures.
In the wake of negative pressures, and a drop below the lower Bollinger band the market could meet support at 1320, taken from the low on April 6. A successful close below this level could see a retest of the aforementioned trading range’s lower band at 1307.
However, if prices are able to break above the 20- and 40-SMAs near 1344 in the next few sessions, the risk would shift to the upside, specifically towards the 1355 resistance level. A jump above would send the precious metal to the next immediate resistance of 1361.40, taken from the peak on February 16.
WTI OIL May Extend Consolidation Before Larger Bulls Resume
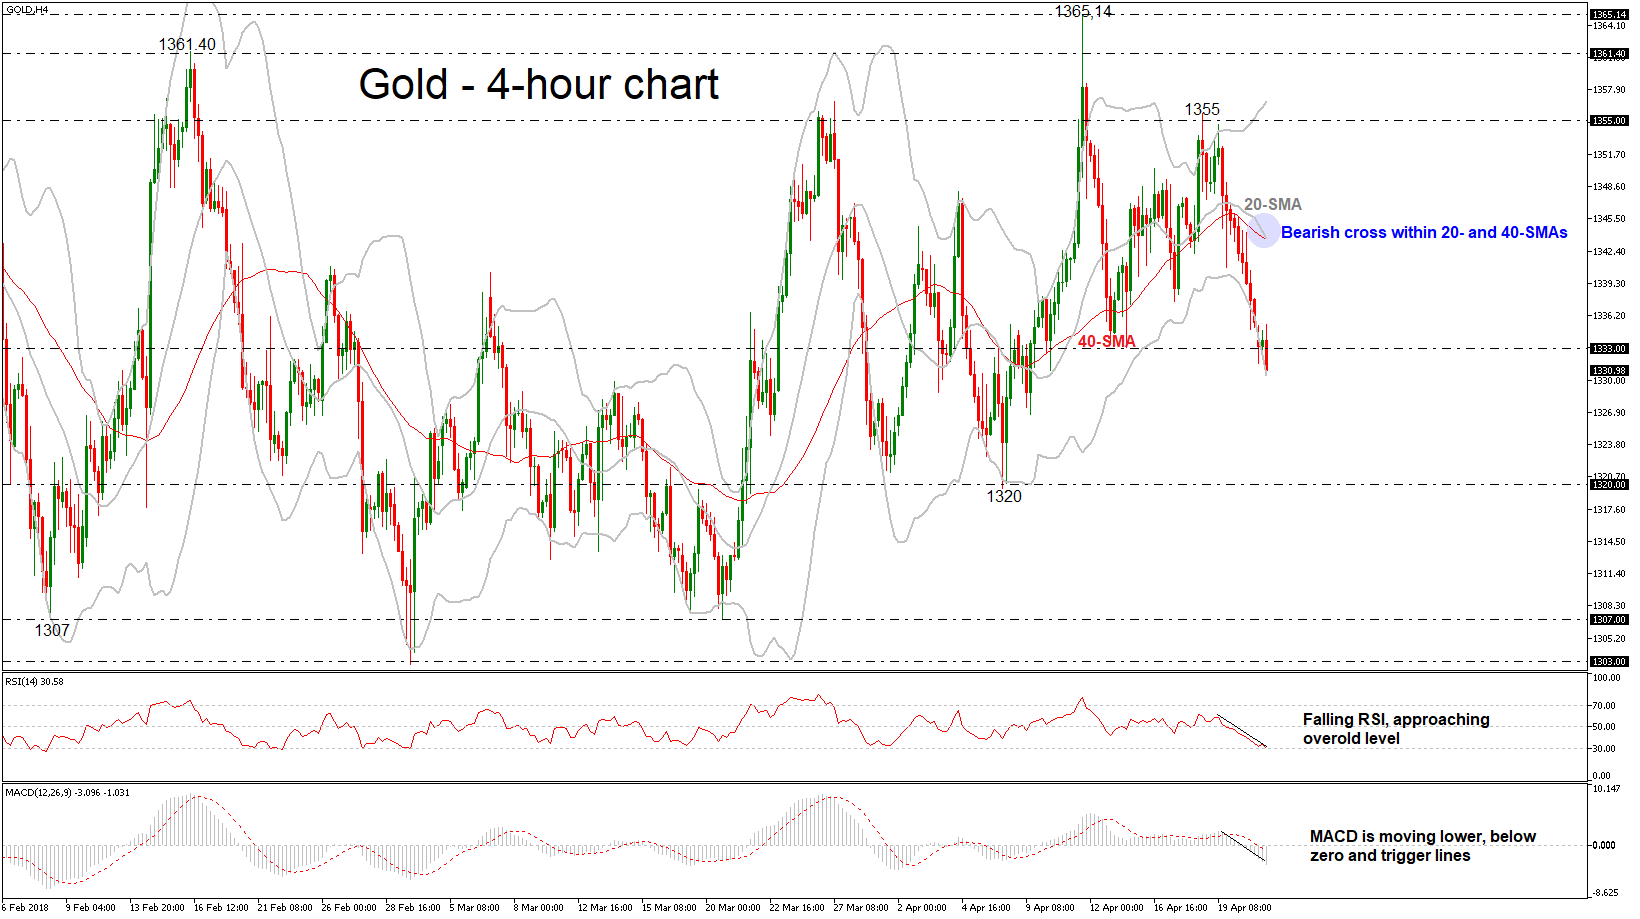
WTI oil stands at the back foot on Monday, following two-day pullback from new over three-year high at $69.54, but holds for now above Friday’s spike low at $67.48.
Easing from new high is seen as consolidative/corrective action on overbought techs, but is also supported by rising number of US rigs which signals increased output and US sanctions against key oil producers such as Russia and Iran.
However, dips were so far shallow and contained above initial support-rising 10SMA (currently at $67.26), keeping overall bullish structure intact.
Pullback could extend towards $67.00/$66.50 zone before bulls re-take control for eventual attack at psychological $70 barrier.
Alternatively, loss of $67.00/$66.50 pivots would risk deeper correction towards $65.55 (17 Apr trough / rising 20SMA) and put larger bulls on hold.
Res: 68.43, 68.64, 68.89, 69.54
Sup: 67.83, 67.26, 67.00, 66.50
French Services PMI Beats Forecast | Oil, ECB & Earnings Under Focus
- The French services PMI data came better than expected
- Crude and Brent's uptrend is strong
- European Central Bank's meeting is due this week
OIL
President Trump brought a brand new surprise for investors when he unleashed the beast through his Twitter for energy traders. Oil is the commodity where you want to keep a close eye this week because we expect him to continue to send messages by using his favourite media and the markets would show its reaction. His message for the oil cartel (OPEC) was clear- it is artificially keeping the price higher for its benefit and he isn't happy with it.
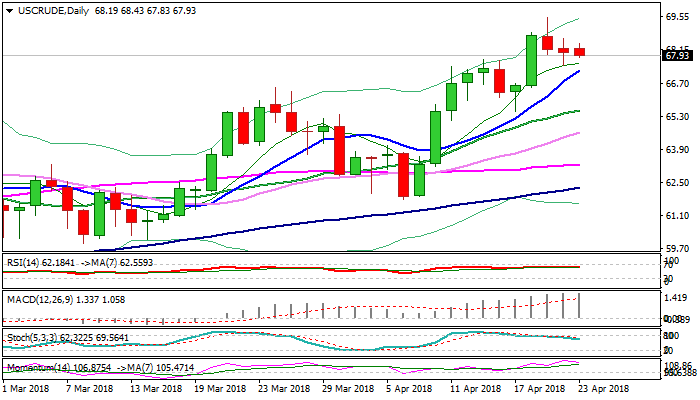
Technically speaking,the daily time frame shows that the uptrend is really strong when it comes to crude and Brent. A break of $70 for crude and 74.75 for Brent, would trigger another rally as traders would target the level of $80 which OPEC has talked about.
Equities
In the equity marketd, traders are going to look at the European markets very closely not only because the European Central Bank's meeting is due this week but also for the reason there is an evidence that the bull rally is running out of fuel. Both; the DAX index and the EuroStoxx, didn't impress investors with their performance last week while the FTSE 100 index closed week high mainly due to the weakness in the currency.
We are close enough to a famous month- May and the famous saying (which many investors do pay attention) does control some of the market sentiment; “Sell in May and Go Away”. When you look at the overall performance of the European markets, one can see that the indices are struggling to convince investors that there is still a lot of room left for the bull rally to continue its current trend. We think that we are very close to the consolidation period or the start of a market correction, and it doesn't matter whether we are speaking of European or the US markets.
The reason is pretty simple; the economic activity over in Europe hasn't shown us any clear evidence that we are going to see any major improvement in the economic data and the European Central Bank would have to normalise their monetary policy given the recovery in the eurozone. However, the recent eurozone's ZEW number released supports the above argument as the data touched its lowest level in nearly five years.
In the light of this, investors would remain sensitive to the upcoming economic data due today, especially the ECB meeting. The French services PMI data came better than expected and traders are encouraged to take more risk on the back of this number. While the manufacturing numbers in Germany may support the argument that the economic engine of the Eurozone of the Eurozone isn't out of steam.
Canadian Dollar Under Pressure, Investors Eye BoC Governor Testimony
The Canadian dollar is steady in the Monday session, after posting losing sessions for three straight days. Currently, USD/CAD is trading at 1.2796, up 0.23% on the day. The Canadian dollar remains under pressure and has dropped to a 2-week low. On the release front, Canada releases Wholesale Sales, which is expected to improve to 0.3%. As well, BoC Governor Stephen Poloz testifies before the House of Commons Standing Committee on Finance. In the US, Existing Homes is expected to inch up to 5.55 million. On Tuesday, the US publishes CB Consumer Confidence.
Negotiating teams from Canada, the US and Mexico met on the weekend as they continue to try and hammer out a new NAFTA deal. The sides continue to show cautious optimism, but all agree that significant work remains. A final agreement is unlikely before May, and with elections in Mexico in early July, Mexican politicians will not want to have to deal with such a critical agreement in the middle of an election campaign. The parties may choose to announce a draft agreement in May and present the finalized deal later in the year.
The Bank of Canada maintained the benchmark rate of 1.25% last month but hinted that more rate hikes are on the way. Inflation has crept closer to the BoC target of 2 percent, and the employment market remains tight. Still, the protectionist stance of the US administration remains a major headache for policymakers. President Trump has taken on China and the tit-for tat tariff battle between the US and China have raised fears of a trade war which would be disastrous for Canada. As well, the Canadian government is in tough in negotiations over a new NAFTA agreement, with the US threatening to walk away if it isn’t given major concessions. Ideally, the bank would prefer to hold off on a rate hike until the NAFTA issue is resolved. At the same time, the Federal Reserve is expected to raise rates at least twice more in 2018, and if the BoC does not increase rates as well, the Canadian dollar could fall sharply against a US currency that would be more attractive to investors.
Euro Dips As Manufacturing PMIs Soften
EUR/USD ended the week with losses, and the downward trend continues in the Monday session. Currently, the pair is trading at 1.2249, down 0.31% on the day. On the release front, German and eurozone manufacturing PMIs dropped in March, but still pointed to expansion. In the US, Existing Homes is expected to inch up to 5.55 million. On Tuesday, Germany releases Ifo Business Climate and the US publishes CB Consumer Confidence.
The closely-watched manufacturing PMIs lost ground in March. German Manufacturing PMI dropped from 58.4 to 58.1, but beat the estimate of 57.6 points. Eurozone Manufacturing PMI dropped from 56.6 to 56.1, short of the forecast of 56.6 points. The readings remain well above the 50-point level, which separates expansion and contraction. At the same time, there is some concern as manufacturing activity (and general growth) in the eurozone was stronger earlier the year. If second-quarter numbers soften compared to Q1, the euro could respond with losses.
ECB policymakers will have to make some critical decisions later this year, as the bank’s stimulus program is scheduled to wind up in September. A key factor in future monetary policy moves will be inflation levels, which continue to remain well short of the ECB’s target of around 2 percent. Eurozone inflation moved higher in March. Final CPI came in at 1.3%, up from 1.1% a month earlier. Still, the reading fell short of the estimate of 1.4%. As long as inflation remains low, there will be little pressure on the ECB to alter policy. If the economy heats up and inflation moves closer to target, interest rate hikes will have to be considered but remain very unlikely before 2019.
EUR/USD Analysis: Shows Slight Downward Potential
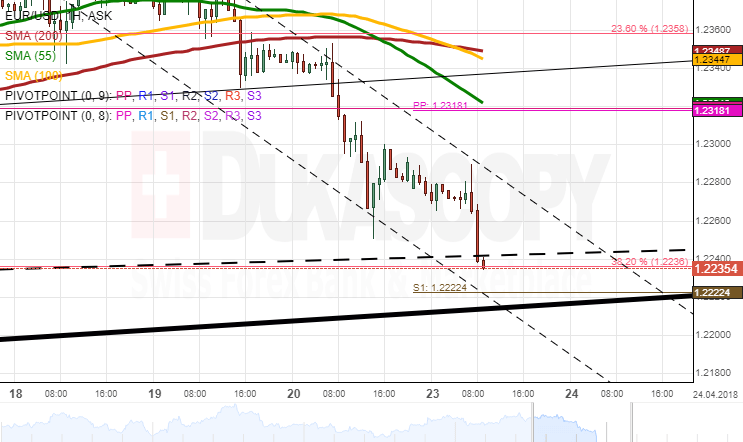
Strong downside potential drove EUR/USD considerably lower on Friday. After failing to surpass the 200-hour SMA, the pair fell 76 pips down to 1.2280. This level coincides with the weekly S2.
Even though technical indicators are located in the oversold territory, some downwards potential might still occur today. The nearest support is provided by a trend-line and the 38.20% Fibonacci retracement, while the weekly S2 and the senior channel are located at 1.2220. It is, however, unlikely that the latter is reached within the following trading session.
Meanwhile, gains are likely to be limited by the 55-hour SMA near 1.2330. This area is likewise reinforced by the monthly PP and the weekly S1.
Even if a fall occurs within the following hours, bulls are expected to prevail during the second part of the day.
GBP/USD Analysis: Falls Down To Senior Channel
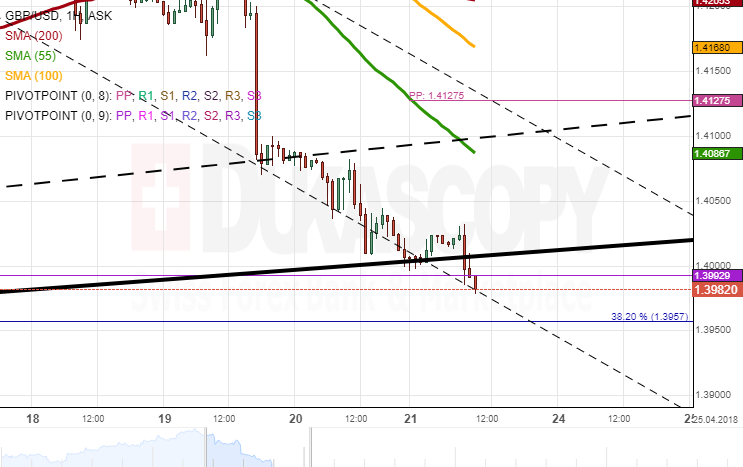
Despite the massive plunge on Thursday, the Sterling failed to accelerate against the US Dollar during the following day. As a result, the pair lost 87 pips and reached the combined support of the senior channel, the weekly S1 and the monthly PP.
The rate lingered near the channel line on Monday morning, thus showing that bulls have managed to regain enough strength to resist a further fall. Technical indicators are slowly recovering from their lows which likewise adds some ground to a possible upward momentum today. No resistance are limiting the pair until the psychological 1.41 mark where the 55-hour SMA is located.
In case of a strong up-move, the Pound could hinder near this moving average for a brief period of time prior to taking on the course towards the 100– and 200-hour SMA circa 1.42.