Sample Category Title
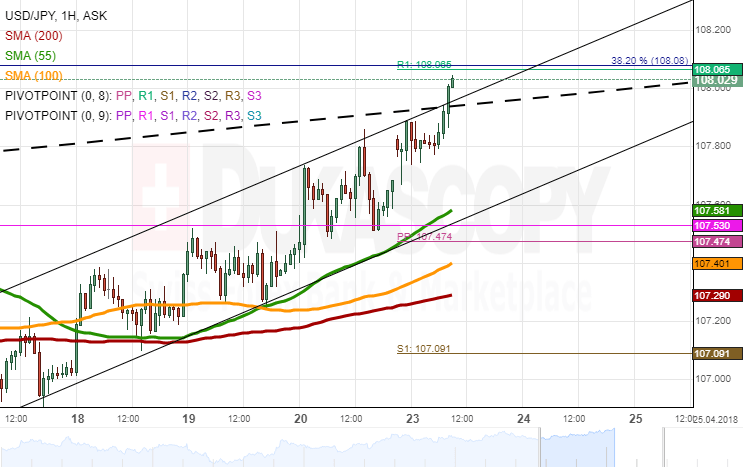
USDJPY Analysis: Opens Near Trend-Line
The US Dollar continued its fourth day of appreciation against the Yen on Friday. Despite showing high volatility, the pair nevertheless closed the session with a slight 32-pip gain.
The Greenback opened considerably higher—at the 107.80 level today, and remained near this mark during the following hours. Thus, the given currency was located near a trend-line this morning.
Technical indicators still remain bullish; however, a convergence between them and the price movement could point to a soon change in sentiment. Thus, even if an up-move occurs today, gains should be capped near the 38.20% Fibonacci retracement and the weekly R2 near 108.10.
Apart from the 55-hour SMA and a channel line near 107.50, a decline might be stopped solely by the 100– and 200-hour SMAs at 107.30.
Gold Analysis: More Likely To Guided By Bulls
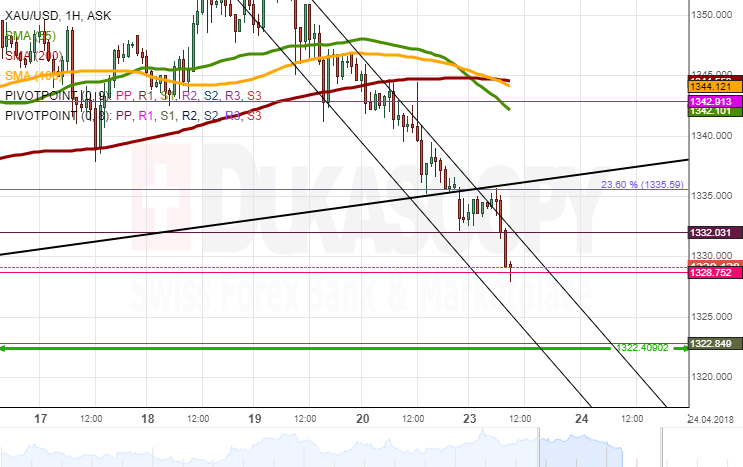
Bears were the main driving force of the XAU/USD exchange rate for the second consecutive session on Friday as a result of which the pair closed the day slightly above the bottom boundary of a medium-term and the 23.60% Fibonacci retracement.
This level was surpassed during the Asian session today, thus leaving the pair near the 1,334.00 level. It is likely that bulls try to recover some of the lost positions within this session.
The nearest considerable resistance is the 55-, 100– and 200-hour moving averages located near 1,344.00. A move above this level is unlikely today. This scenario is likewise supported by bullish technical indicators.
Meanwhile, downside potential could be realised until the 1,328.00 level.
EUR/DKK 4H Chart: About To Decline
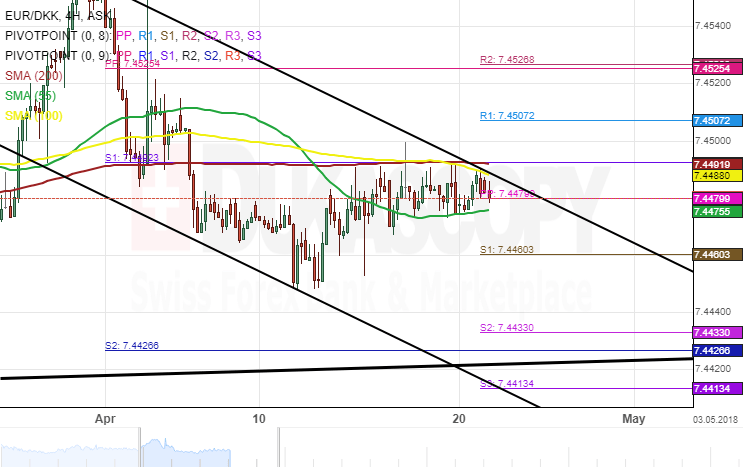
The common European currency has met with the resistance of a medium term pattern against the Danish Krona. Moreover, the resistance line is strengthened by the 100 and 200-period simple moving averages and the monthly S1.
Meanwhile, take into account that the currency exchange rate is also facing the support of the weekly PP and the 55-period SMA.
These two facts combined indicate that in the near future the pair is set to break out from this stalemate.
However, due to the existence of a medium term channel down pattern, the breaking out to the downside is more favorable.
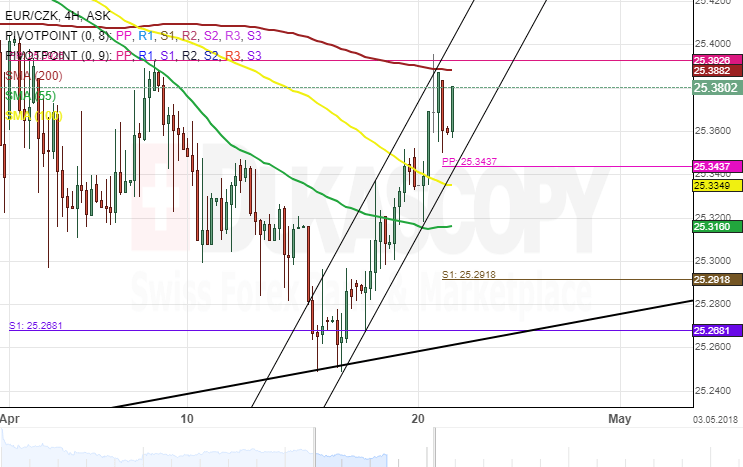
EUR/CZK 4H Chart: Pair Stands At Resistance
The common European currency has recently met with the support of a medium scale ascending pattern against the Czech Krona. This event has resulted in the formation of a junior ascending pattern.
On Monday the currency rate was standing just below the resistance of the pattern. In addition, the resistance was strengthened by the 200-period SMA and the monthly pivot point just below the 25.40 mark.
Due to these levels of significance it is expected that the currency pair will break the resistance or fails at an attempt to surge higher and decline. Either way there should be additional momentum.
GBP/JPY Cont-Breakout Pattern Only Above 152.36
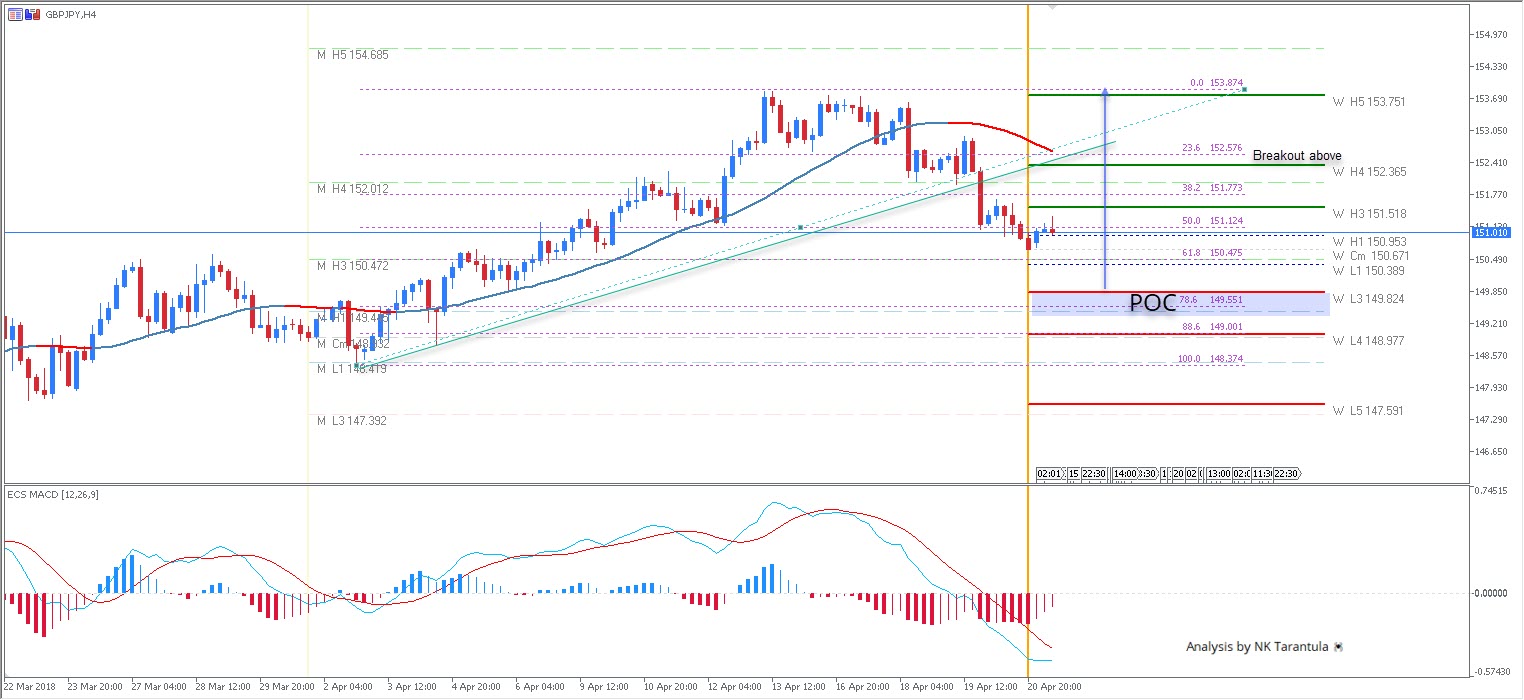
The GBP/JPY has been in a steady uptrend on H4 timeframe, and after touching 153.87 it started a retracement. Don’t be confused, as the pair is still in uptrend and we might see a rejection from POC if the price gets in the zone 149.60-85. However, pay attention to 151.50 too. If the pair makes a 4h close above 151.52 we should see a bounce towards 152.36. Above 152.36 there is a possibility of a cont-breakout pattern towards 153.75 retest. Only below W L4 – 148.97 the pair might start a downtrend.
W L3 - Weekly Camarilla Pivot (Weekly Interim Support)
W H3 - Weekly Camarilla Pivot (Weekly Interim Resistance)
W H4 - Weekly Camarilla Pivot (Strong Weekly Resistance)
M H4 - Monthly Camarilla Pivot (Very Strong Monthly Resistance)
M L3 – Monthly Camarilla Pivot (Monthly Support)
M L4 – Monthly H4 Camarilla (Very Strong Monthly Support)
POC - Point Of Confluence (The zone where we expect price to react aka entry zone)
AUDUSD – Extended Bears Crack Strong Support Zone Between 0.7650 And 0.7626
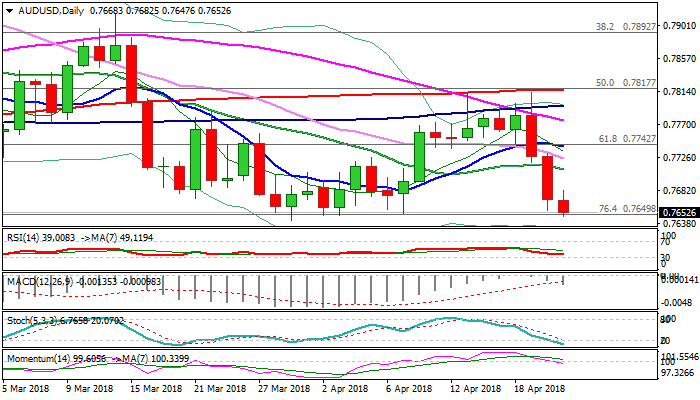
The Aussie dollar remains under pressure on Monday and cracks 0.7640/50 base, which marks the upper boundary of key support zone, consisting of Fibo 38.2% of 0.6825/0.8135 recovery (0.7635) and longer-term bull-trendline, drawn of Jan 2016 low at 0.6826 (0.7626).
Bearish setup of daily techs and stronger US dollar, keep the Aussie under strong pressure, with firm break through pivotal 0.7650/26 zone expected to spark fresh extension of bear-leg from 0.8135 (2018 high) for test of 0.7500 (09 Dec) trough.
Oversold daily slow stochastic suggests that bears may show stronger hesitation at key 0.7650/26 support zone, awaiting release of Australian inflation data (due early Tue) for fresh signals.
Descending 20SMA (0.7710) is expected to cap extended upticks.
Res: 0.7682, 0.7710, 0.7724, 0.7740
Sup: 0.7635, 0.7626, 0.7600, 0.7535
Currency Markets Confuse
Currency markets confuse
Risk appetite seem to be recovering, as shown by EUR/CHF testing 1.2000. Yet demand for emerging market currencies remains weak. Brent crude is nearing US$75/barrel on the back of supply concerns, declining US inventories and OPECs announcement that the supply glut is now gone. The correlation of FX and interest rate spreads has weakened, yet with US 10-year treasuries nearing 3%, markets are starting to find them attractive. Trump tax cuts will widen US deficits.
If all this sounds confusing: yes, it is. Markets have been too quick to embrace flavours-of-the-month. Fashionable thinking makes us sceptical. Take India: despite solid structural fundamentals, a cyclical upturn in oil price has triggered fear of capital flight. The US Treasury has placed the rupee on the watch list of currencies, which has freaked out traders. However, India is far from a currency manipulator, due to persistent current account deficits. With global yields low, volatility low and growth solid – this is what we will trade on. If you must trade now, higher oil should support NOK, CAD, ZAR, BRL and AUD.
Germany inflates!
The German economy is showing signs of recovery: March producer prices rose 1.9% annually and 0.1% monthly, following a 6-month decline. This indicates an increase in consumer demand, which along with an improving trade balance in February, set the scene for growth in 2018. GDP forecasts are being hiked to 2.2% in 2018 (initial estimates at 2%), which supports optimism for the Euro region. April economic data are softer, with GfK consumer confidence and ZEW current conditions given at 10.90 and 87.90 (2 years averages at 10.30 and 75), so we suspect the economy will continue its acceleration, though at a slower pace than in 2017. The EUR/USD currently trades at 1.2324, moving sideways in April, but will slide a bit until the end of the month, heading to 1.2310 in the short-term
NZD in the doldrums
Expect further downside in NZD/USD, as the interest rate differential continues to move negatively, making NZD shorts costly. Speculators are still net long Kiwi (non-commercial position: net long 40% of total open interest) and will unwind position as the currency nosedives. The next key support can be found at 0.7188 (low from 29 March), then 0.7154 (low from 21 March). On the upside, resistance lies around 0.74 (high from mid-April). All in all, a return towards 0.70, or even below, seems reasonable.
The New Zealand dollar saw heavy selling on Friday amidst weak inflation data. The Kiwi fell 0.53% against the greenback and hit $0.7230. Headline inflation eased to 1.1% annually in Q1, down from 1.6% in the previous quarter. After increasing 0.5% in the Q4 last year, tradable inflation contracted 0.40% annually, while non-tradable inflation eased to 2.3%. The relative strength of the Kiwi during that period explains most of the reduction in price pressures. However, the sector factor model, used by the Reserve Bank of New Zealand, shows a brighter picture, holding steady at 1.5%.
US inflation vs Euro
This Thursday the European Central Bank will update monetary policy: we expect that interest rates will not change. The ECB will say it needs to wait again in its slow move to normalise money without pushing EUR/USD significantly higher. As Janet Yellen, former Chair of the US Federal Reserve Bank, managed to do in the USA: end ultra-loose policy without driving a USD stampede. ECB President Mario Draghi’s will focus on details for ending quantitative easing yet avoid discussion on interest rates.
With US 10-year treasuries making a run at 3.0%, rising bond yields are giving the greenback a solid boost. Markets are focused on inflation, thanks to higher oil prices. A steeper US yield curves will keep USD strong against oil-importing EM currencies such as INR and TRY. March weakness in European economies was temporary: April purchasing managers’ data came in above expectations: PMI composite rose to 55.2 versus 54.8 expected, while manufacturing was slightly below at 56.0 vs. 56.1 expected. June and July should bolster the case for a Euro interest hike.
It will also be a busy for corporate earnings, with over a third of the S&P 500 set to report.
EURUSD – Extended Bears Pressure Daily Cloud Base
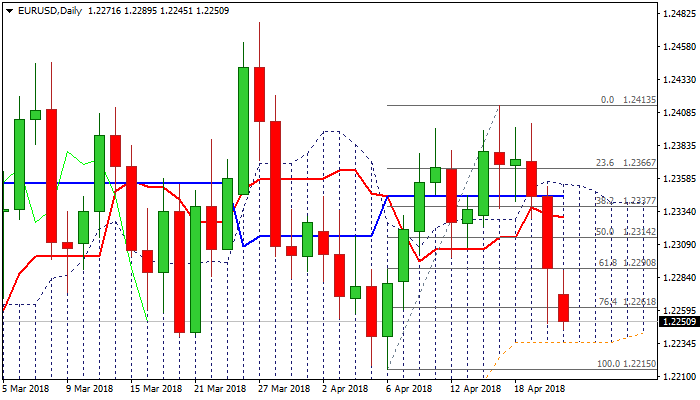
The Euro maintains negative tone on Monday, pressured by strong fall last Thu/Fri, which retraced over 76.4% of 1.2215/1.2413 upleg. Fall on Friday spiked to 1.2249, but failed to close below pivotal support at 1.2290 (Fibo 61.8% of 1.2215/1.2413). Fresh weakness today looks for attack at strong support at 1.2235 (base of thick daily cloud, reinforced by 20-d lower Bollinger band). Daily techs are in bearish setup and two long red candles of Thu/Fri continues to weigh, keeping the downside firmly in focus. Break through cloud base would expose next strong supports at 1.2215 (06 Apr trough) and 1.2204 (rising 100SMA). Today's close below 1.2290 Fibo level is needed to generate further bearish signal and confirm negative sentiment, as break through 1.2215/04 would expose key short-term supports at 1.2172 (Fibo 38.2% of 1.1553/1.1.2555 rally and 1.2154 (01 Mar low of multi-month consolidation range).
Res: 1.2290, 1.2320, 1.2345, 1.2354
Sup: 1.2245, 1.2215, 1.2204, 1.2172
USD breaking Friday’s highs as rally resumes
Looking at EUR/USD's after release of France, Germany and Eurozone PMIs, one might think that Euro responds negatively to the release. But actually, the PMI data are just mixed, and we couldn't say they're bad at all.
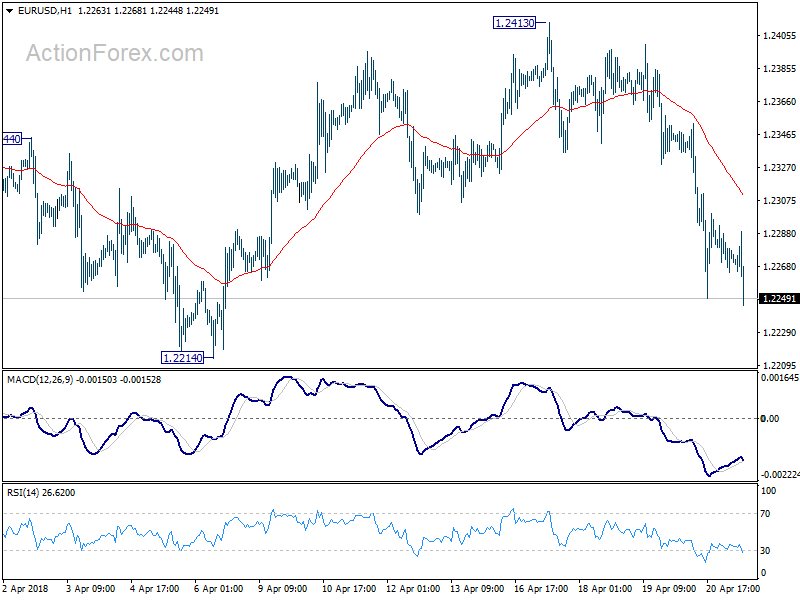
But looking at the D heat map, while EUR is broadly soft, it's actually USD's strength that is overwhelming.
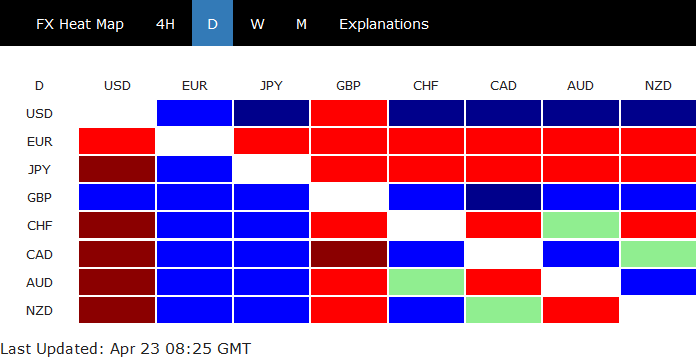
USD has taken out Friday's high against all but Sterling. We'll likely see more upside in USD before US session.
Bitcoin Trading Above 8900
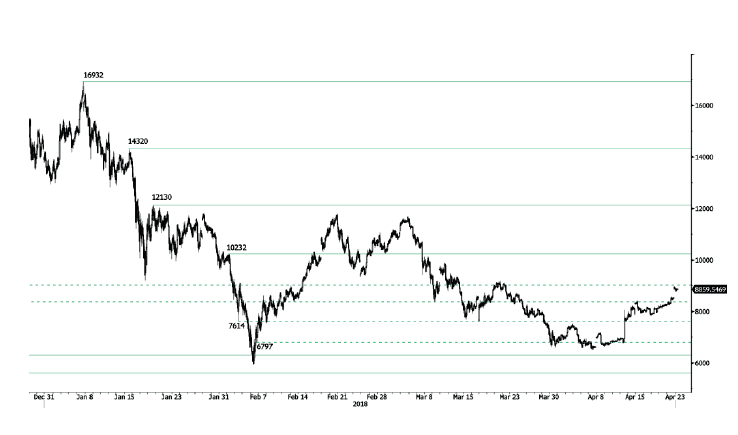
Bitcoin rise started in mid April continues, currently trading above 8900 and heading along the 8955 range. Bitcoin bearish pattern started in March 2018 is maintained as long as the 9000 range is not reached. The pair is contained between hourly support and resistance given at 6306 (13/11/2017 low) and 10232 (01/02/2018 high). The technical structure suggests further short-term increase.
In the long-term, the digital currency has had an exponential growth but also presented important downturns. There is decent likelihood that the currency could stabilize between 7'000 - 12'000 in 2018. Bitcoin is trading slightly above its 200 DMA (8000 range)