Sample Category Title
USD/JPY Mid-Day Outlook
Daily Pivots: (S1) 107.36; (P) 107.61; (R1) 107.86; More...
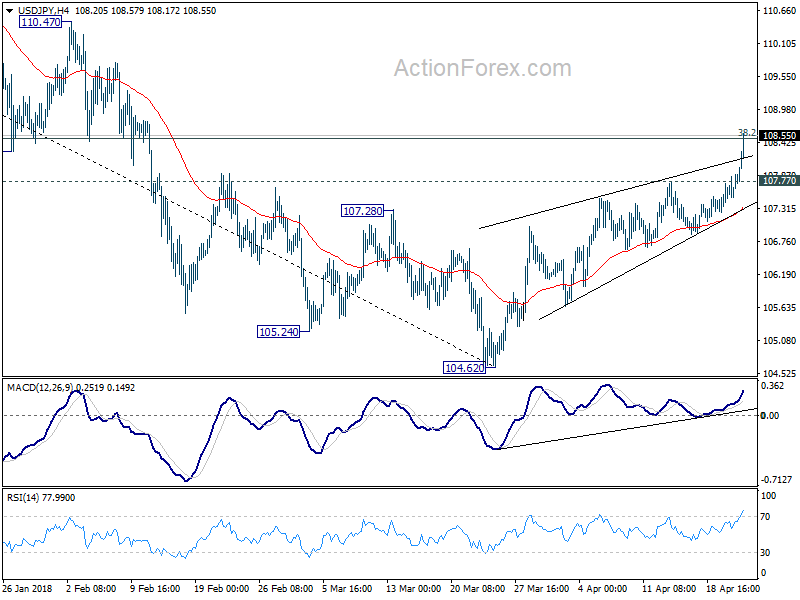
USD/JPY's rally continues to as high as 108.56 so far with upside acceleration seen in 4 hour MACD. Current developments suggests that medium term trend is possibly reversing. Intraday bias stays on the upside for 61.8% retracement of 114.73 to 104.62 at 108.48 9 110.86 next. On the downside, below 107.77 minor support will turn intraday bias neutral first.
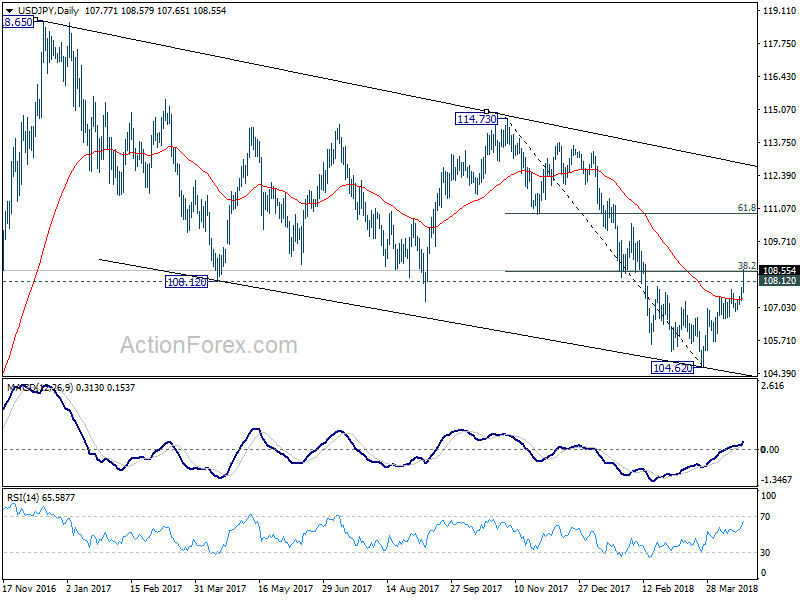
In the bigger picture, break of 108.12 support turned resistance now suggests that corrective fall from 118.65 (2016 high) has completed with three waves down to 104.62. And, rise from 98.97 (2016 low) could be resuming. Focus is back on 114.73 resistance and break there will pave the way to 118.65 and above. This will now be the preferred case as long as USD/JPY stays above 55 day EMA (now at 107.41).
U.S. Existing Home Sales Rise for the Second Month in a row
Existing home sales rose by 1.1% m/m to 5.6 million units (annualized) in March, exceeding market expectations for a modest gain of 0.2% m/m. On a year-over-year basis, home sales remain 1.2% below their year-ago level.
The increase was broad-based, as sales of both single-family homes (+0.6%) and condos/co-ops (+5.1) rose on the month.
Activity was mixed across the country. Sales declined modestly in the South and West, giving up some of the large increases seen in the prior month. Meanwhile, activity finally improved in the Northeast (+6.25%) and Midwest (5.7%) in March, after previously falling for three consecutive months. Still, in both regions sales remain below their year-ago level, particularly in the Northeast, where they are 9% below their March 2017 level.
Prices continued to rise quite fast, accelerating in March with the start of the busy spring buying season. The median price of an existing home was up 5.8% year-on-year, up from 5.5% pace seen in February.
Rising prices reflect the continued tight supply conditions prevailing in the housing market. While the inventory of homes available for sale rose 5.7% in March, it is 7.2% lower than a year ago. Given the tight inventory, houses were selling briskly. Properties stayed on the market on average for 30 days, down from 37 days in February and 34 days a year ago.
First time buyers accounted for 30% of sales in March, down from 32% a year ago.
Key Implications
It is encouraging to see sales and inventory rise for a second consecutive month as we head into the busy spring buying season; however, one can't help but wonder what activity may have been if not for restrained supply. With a risk of sounding like a broken record, the underlying story in the U.S. housing market remains broadly unchanged – one of a tug-of-war between solid demand and insufficient supply, particularly in the entry-level segment.
Deteriorating affordability on the back of rising mortgage rates and prices, and low supply of entry level houses is particularly problematic for first-time homebuyers. Unfortunately, given the quickly rising costs for construction material and labor, homebuilders are unlikely to ramp up construction sufficiently in the near-term to provide a meaningful reprieve for the first-time buyers.
Inclement weather and new tax regulations, have taken a toll on resale activity in the Northeast. However, it appears that the market is finding its footing after a three-month long hiatus. Still, even as the weather improves, the impact of the tax changes will continue to weigh on price growth and resale activity in the region
GBPUSD: Weakens Further On Bear Pressure
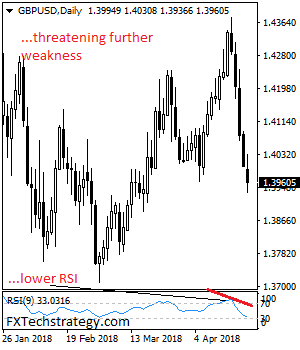
GBPUSD: The pair saw further weakness following its past week losses. Support lies at the 1.3950 level where a break will turn attention to the 1.3900 level. Further down, support lies at the 1.3850 level. Below here will set the stage for more weakness towards the 1.3800 level. Conversely, resistance stands at the 1.4000 levels with a turn above here allowing more strength to build up towards the 1.4050 level. Further out, resistance resides at the 1.4100 level followed by the 1.4150 level. On the whole, GBPUSD remains biased to downside on further weakness.
US PMIs: Economy picked up pace again
Data released from the US are generally positive.
Manufacturing PMI rose to 56.5 in April, up from 55.6 and beat expectation of 55.2. Services PMI rose to 54.4, up from 54.0 and beat expectation of 54.1. Composite PMI rose to 54.8, up from 54.2.
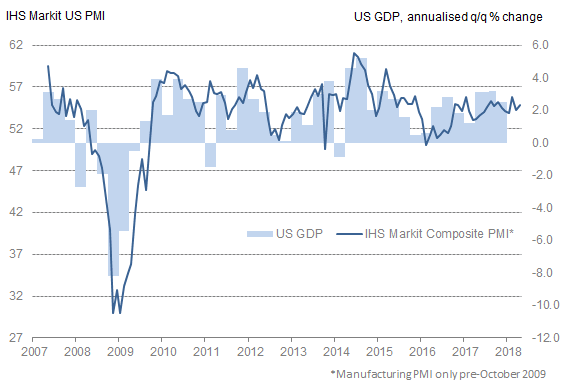
Comments from Chris Williamson, Chief Business Economist at IHS Markit:
"The US economy picked up pace again at the start of the second quarter. The April PMI surveys registered the second-strongest monthly expansion since last October. Manufacturing is leading the upturn, with factories reporting the strongest output gains for 15 months, and the vast service sector is enjoying a steady, robust expansion.
"After a relatively disappointing start to the year, the second quarter should prove a lot more encouraging. The current data point to an annualized GDP growth rate of 2.5%, with scope for some substantial upside surprises in coming months.
"First, growth in new orders accelerated to show the largest surge in demand for goods and services for just over three years. Second, companies' expectations of growth over the coming year jumped to a three-year high. Third, hiring remains robust as firms struggle to cope with demand. The surveys point to non-farm payroll growth of approximately 200,000 in April.
"The details of the survey therefore suggest that output growth is on course to accelerate as we move into the summer. Prices are meanwhile being pulled upwards by the strength of the upturn, however, sending hawkish signals for policy makers."
Also from the US, existing home sale rose to 5.60m annualized rate in March, above expectation of 5.55m.
SPOT GOLD Extends Sharp Fall on Monday and Pressures Strong Supports at $1319/18
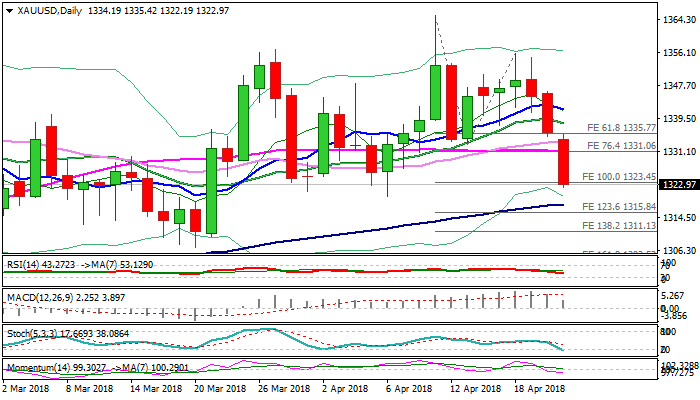
Strong bearish acceleration on Monday extends steep fall of last Thu/Fri, marking so far near 1% loss for the day.
Fresh bears broke through thin daily cloud and pressure strong supports at $1319/18 (06 Apr low/rising 100SMA).
Stronger dollar on rising US bond yields and eased geopolitical tension that slashed safe-haven demand, keep the yellow metal under strong pressure.
Daily techs turned to bearish mode and favor further downside, as gold price rides on the third wave of five-wave sequence from $1365 high and cracked its FE 100% at $1323.
The wave could travel to its FE123.6% at $1315, on break below $1319/18 pivots and could extend to $1311 (FE 138.2%).
Bears may show hesitation at $1319/18 zone on oversold conditions, but strong bearish sentiment suggests limited upside action.
Daily cloud is widening after last week’s twist, currently spanned between $1329 and $1334 and should cap corrective upticks.
Res: 1323; 1329; 1331; 1334
Sup: 1318; 1315; 1311; 1307
Sunset Market Commentary
Markets:
Global core bonds lost more ground during the first half of today’s trading session. The Bund has some catching up to do while better than expected PMI’s inflicted more pain. The US Note future slid away as the US 10-yr yield was lured to the psychological 3% barrier (2.99%). A break didn’t occur, causing technical return action higher in core bonds. European stock markets traded mixed while commodities lost ground after European noon as the US eased sanctions against Rusal. The latter probably helped putting an intraday bottom below core bonds. Changes on the US yield curve vary between +1.4 bps (5-yr) and +0.2 bps (30-yr). German yields add 1 bp (2-yr) to 3.5 bps (10-yr). 10-yr yield spreads vs Germany narrow 1 to 2 bps with Greece slightly outperforming (-4 bps).
The gradual rise of the dollar that started in the second half of last week, continued. There were again plenty of market comments on the US 10-yr yield nearing the key 3.0% barrier. This rhetoric also supported the dollar. The first estimate of the EMU PMI was slightly better than expected (55.2 vs 54.8). EUR/USD tried a shy attempt to go higher upon the release of the French and German PMI’s. However, USD strength prevailed. EUR/USD soon resumed the recent downtrend. The rise of USD/JPY also reaccelerated. The pair regained the 108 barrier. At the start of the US trading session, prices of several commodities declined on headlines that the US may relieve sanctions against a big Russian commodity producer. Lower commodity prices are often a positive for the dollar, but for now additional USD gains remain modest. Even so, the US currency remains well bid, holding within reach of the ST top against the euro and the yen. EUR/USD is nearing the 1.2215 area. USD/JPY hovers in the 108.35 area.
EUR/GBP traded in a sideways range in the 0.8740/80 area today. The pair held up rather well despite euro (EUR/USD) softness, suggesting some underlying sterling weakness was still at work. Cable drifted also below the 1.40 area, partly due to USD strength. There were no important eco data. However, the financial press elaborated on an upcoming debate in Parliament on whether or not the UK should stay in the EU customs union. The issue will probably also be discussed in a high level meeting of PM May’s Cabinet on Wednesday. This might again lead to tensions within May’s Conservative Party which is highly divided on the issue. So, Brexit noise might become a potential negative for the UK currency. Later this week, the first estimate of UK Q1 GDP is expected to be weak (0.3% Q/Q), further questioning the needed of a May BoE rate hike.
News Headlines:
The Eurozone composite PMI stabilized unexpectedly at 55.2 in April, beating 54.8 consensus. The services PMI slightly increased in April, from 54.9 to 55 (vs 54.6 forecast) while de manufacturing PMI recorded a fourth straight drop from 56.6 to 56 (vs 56.1 expected). PMI’s are somewhat off the highs reached end 2017/early 2018, but remain at very lofty levels from an absolute point of view, indicating decent momentum as Q2 2018 began.
Aluminum prices dropped 10% in afternoon trading in London after the US Treasury said that it was extending the time limit for winding up business with sanctioned Russian producer Rusal and hinted at easing restrictions on the company that have upended metals trading globally. (FT)
The Belgian debt agency successfully tapped 4 OLO’s today: OLO 82 (€0.89bn 0.5% 2024), OLO 80 (€1.39bn 0.8% Jun2028), OLO 78 (€0.78bn 1.6% Jun2047) and OLO 83 (€0.35bn 2.25% Jun2057). The combined amount sold was the maximum of the targeted €2.9-3.4bn with a total auction bid cover of 1.89. The Belgian debt agency now completed more than half (56.33%) of this year’s official €31bn funding need.
USD/CAD Mid-Day Outlook
Daily Pivots: (S1) 1.2673; (P) 1.2718; (R1) 1.2806; More....
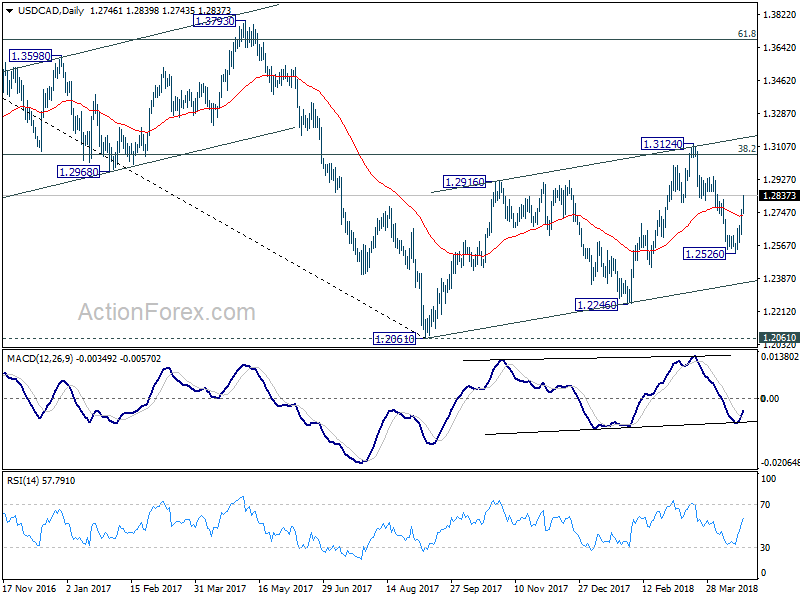
USD/CAD's rally continues to as high as 1.2839 so far. Firm break of 1.2814 support turned resistance invalidates our bearish view. Pull back from 1.3124 should be completed at 1.2526 already. And rise from 1.2061 low is not completed. Intraday bias stays on the upside for 1.3124 resistance next. On the downside, below 1.2749 minor support will turn intraday bias neutral first.
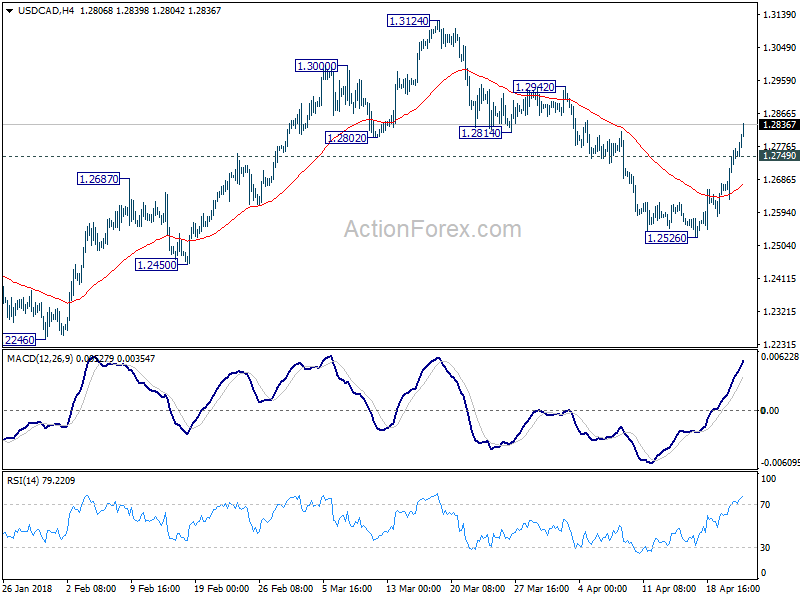
In the bigger picture, current development suggests that rebound from 1.2061 has not completed yet. Focus is back on 38.2% retracement of 1.4689 to 1.2061 at 1.3065. Sustained trading above there will confirm medium term bullish reversal. That is, down trend from 1.4689 has completed at 1.2061 already. In that case, next target will be 61.8% retracement at 1.3685.
Yield Outlook: The Risk of a Severe Spike in Yields in 2018 is Small
The global bond sell-off that characterised the first six weeks of Q1 18 reversed in March and April and 10Y German yields are more or less back to the level at the beginning of the year, even after German yields rose again last week. The picture is somewhat different in the US. The combination of continued rate hikes from the Fed and higher inflation expectations has recently pushed 10Y US treasury yields back towards the 3.0% level. Hence, the 10Y spread between US and Germany/EUR has continued to widen. In addition, the spread in the short-end has widened further as the Fed continues to hike and as 3M USD Libor specifically has been pushed higher due to tighter USD liquidity.
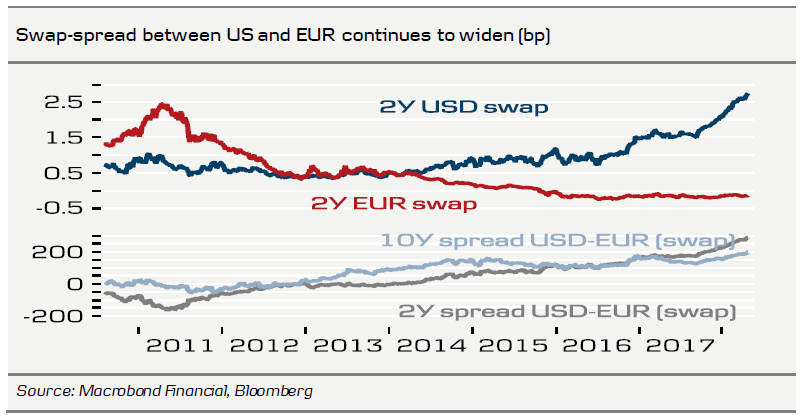
We have become more certain that yields will not rise significantly in the euro zone in 2018
In the latest issue of Yield Outlook – Higher 10Y yields very much a 2019 story, 15 M arch, we argued that, in particular, Nordic/European 10Y rates and yields would not rise significantly in 2018 and that higher 10Y yields would be very much a 2019 story. Over the past month, we have become more confident in this view for two reasons.
1. Business cycle has peaked
It seems that the global business cycle is losing momentum. Last week, we published Research – Global business cycle moving lower, 19 April, which looks at the global business cycle.
We argue that there are clear signs that the global business cycle peaked in early 2018. Furthermore, our business cycle MacroScope models point to a further deceleration over coming quarters. Declining PMI levels across regions tend to cause some anxiety about the strength of the recovery and would normally put a cap on bond yields. We rarely see yields moving higher at the same time as business cycle indicators such as the PMIs move lower.
2. ECB will not hike before late 2019
Second, we doubt that we will see a change in rhetoric from the ECB in 2018. Last week, we changed our forecast for the ECB (see ECB Preview – Not on Draghi's watch, 20 April) and we now forecast that the ECB will not hike before December 2019, when Mario Draghi and other 'dovish' members have left the ECB. Earlier we had p encilled in a first rate hike in Q2 19. If we are correct that the European business cycle is weakening, it should further diminish the risk of a change in rhetoric from the ECB. Indeed, over the weekend, Draghi said that 'economic indicators…suggest that the growth cy cle has p eaked'.
Regarding central bank rhetoric, note also that Bank of England Governor Mark Carney struck a dovish tone in an interview last week, stating that a few rate hikes may be warranted over the next few years, thus essentially questioning whether a May hike is a done deal after all.
We also expect a soft stance from the Riksbank this week, as we expect the Riksbank to postpone the first rate hike to 2019 (see Reading the Markets Sweden, 20 April.
Commodity prices are the risk factor for global fixed income markets
In our view, the main risk factor for global fixed income markets over the next two quarters is the global commodity market. The sanctions against Russia could still push some metal prices higher even after aluminium and nickel prices jumped recently.
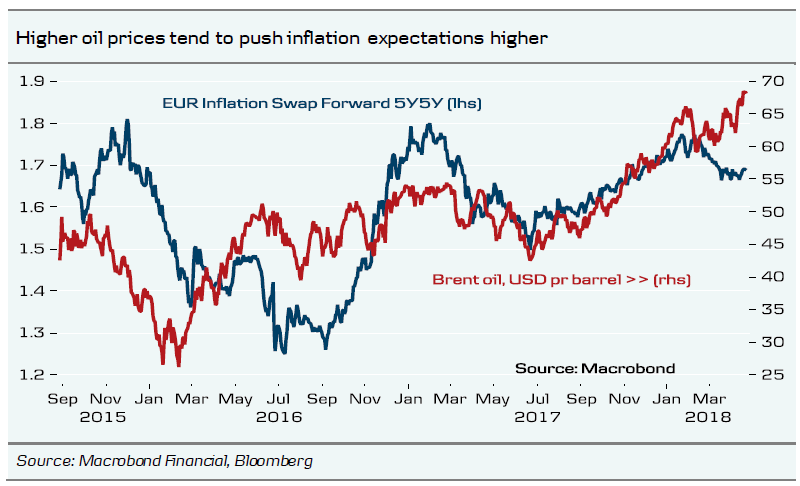
In the oil market, it is noteworthy that the supply and demand balance has improved in 2018 (lower stocks). However, oil prices, in particular, could be pushed higher if Donald Trump 's administration decides to take a tougher stance on Iran. However, it would be a supply-driven oil price, which the ECB should be less eager to react on but still there is a close correlation between inflation expectations and oil prices. Hence, higher oil prices, everything being equal, tend to push nominal rates and yields higher.
Fed set to raise above the 2.75% long-run dot
We continue to see a further widening of the two-year spread between USD and EUR rates. We expect the Fed to hike three times this year and next. Importantly, we still expect the Fed to raise the Fed funds rate above the longer run dot of 2.75% (the Fed's estimate of the natural rate of interest when the economy is normalised) in coming years.
Hence, we continue to disagree with markets, as the markets believe the Fed will hike less than twice in 2019. We believe the Fed will continue to hit the brakes, as fiscal policy has become more expansionary and the output gap has nearly closed.
ECB trying to convince the market we will see no taper tantrum
It is notable that the ECB is eager to communicate to the market that we should not see a 'tap er tantrum' in the eurozone bond market this year (surge in US yields in 2013 after the Federal reserve announced lower monthly bond p urchases). The ECB argues that the 'free float' of German bonds, in p articular, is very limited and close to 10%, as a large p art is own by the ECB itself and other central banks. This is very different from the US treasury market in 2013. That the ECB has a large stock means that the impact of the ECB ending the QE programme should be small, as, in particular, the reinvestment flow of coupons and matured bonds will be sizeable over the near future. For more on this subject, see among this speech from ECB member Benoît Coeuré from 23 February.
Our fixed income view – higher yields mainly a 2019 story
We have lowered our 12M forecast for German 10Y yields slightly from 1.20% to 1.1% due to the change in the ECB deposit rate forecast. We also continue to see a subdued inflation picture in the eurozone and a weaker European business cycle in 2018. We also expect the ECB ending the QE programme this year to have only a small effect on the bond markets. Hence, we continue to see most of the expected rise in yields being in 2019.
We continue to expect a steeper 2Y10Y German yield curve. The ECB still maintains a relatively tight grip on the short end of the curve, especially with the first ECB rate hikes expected late in 2019. However, this is not the case for the 10Y segment of the curve, which we still expect to be pushed by higher US yields in 2019. We have 1.1% (previously 1.2%) and 3.3% (unchanged) 12M forecasts for the 10Y German Bund yield and the 10Y US Treasury yield, respectively.
The boost to fiscal policy in the US and the possible pricing of more rate hikes in the US are the main reasons we still see upside for US 10Y yields. In our view, the latter will have a tendency also to push long yields in the eurozone higher.
EUR/USD Mid-Day Outlook
Daily Pivots: (S1) 1.2239; (P) 1.2296 (R1) 1.2342; More....
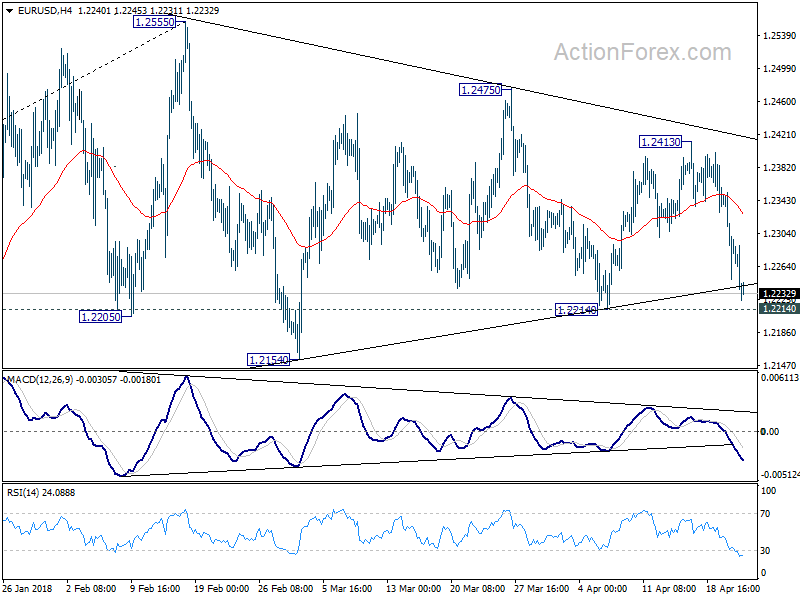
No change in EUR/USD's outlook as focus remains on 1.2214 support. Decisive break there will revive the case of medium term reversal. In that case, deeper fall would be seen to 1.2154 first. Firm break there will confirm and target 38.2% retracement of 1.0339 to 1.2555 at 1.1708 next. On the upside, break of 1.2413 will turn focus back to 1.2555 high instead.
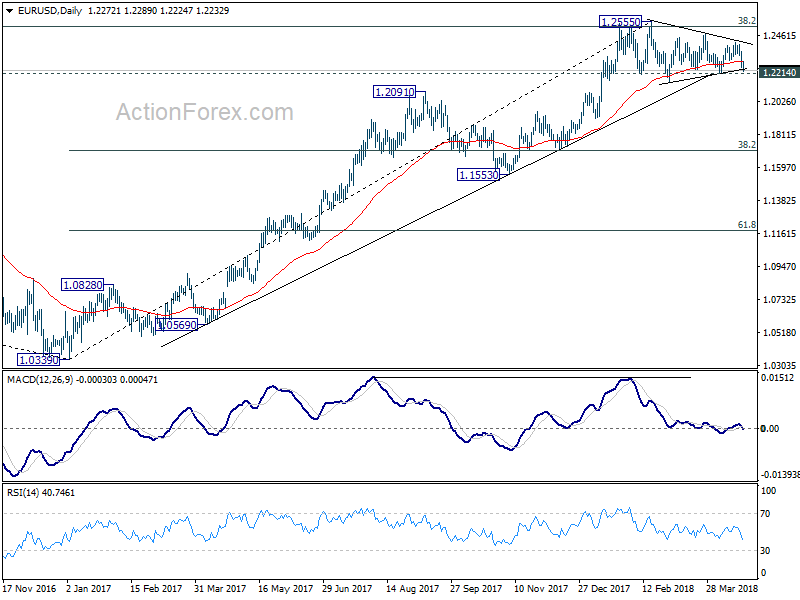
In the bigger picture, key fibonacci level at 38.2% retracement of 1.6039 (2008 high) to 1.0339 (2017 low) at 1.2516 remains intact despite attempts to break. Hence, rise from 1.0339 medium term bottom is still seen as a corrective move for the moment. Rejection from 1.2516 will maintain long term bearish outlook and keep the case for retesting 1.0039 alive. Firm break of 1.1553 support will add more medium term bearishness. However, sustained break of 1.2516 will carry larger bullish implication and target 61.8% retracement of 1.6039 to 1.0339 at 1.3862 in medium term.
GBP/USD Mid-Day Outlook
Daily Pivots: (S1) 1.3968; (P) 1.4029; (R1) 1.4060; More...
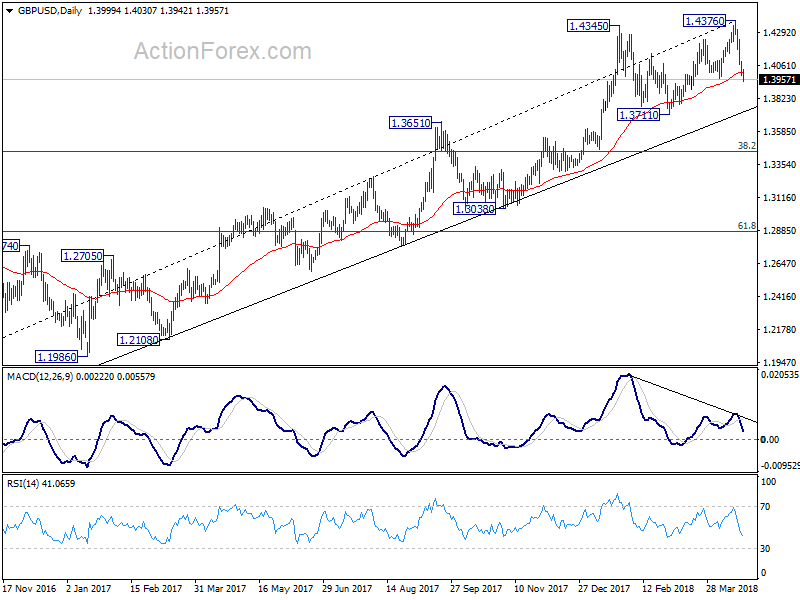
GBP/USD's decline from 1.4376 extends to as low as 1.3942 so far today. Break of 1.3965 support should now pave the way to 1.3711 key support level. On the upside, above 1.4030 minor resistance will turn intraday bias neutral and bring consolidations. But for now, near term risk will stay on the downside as long as 4 hour 55 EMA (now at 1.4142 holds).
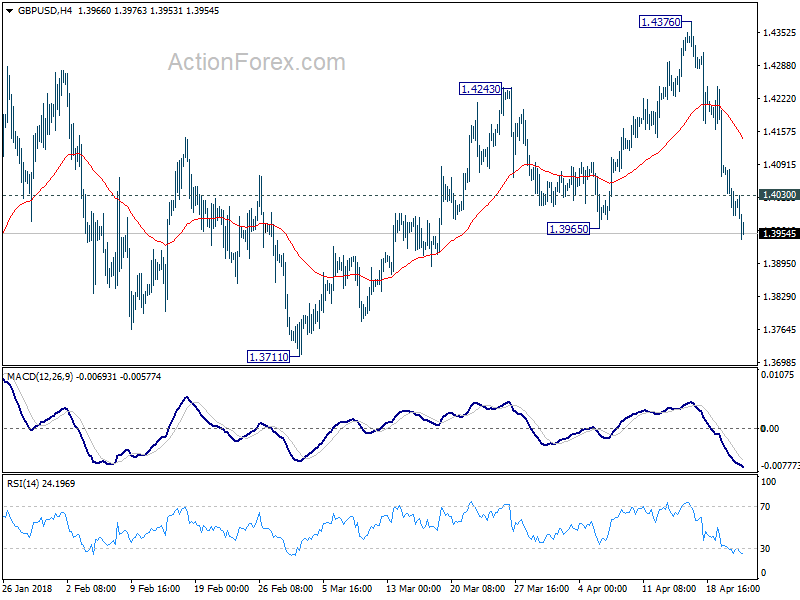
In the bigger picture, bearish divergence condition in daily MACD is raising the chance of medium term reversal. Also, note that GBP/USD has just failed to sustain above 55 month EMA (now at 1.4257). Focus is back on 1.3711 support. Firm break there will confirm medium term reversal and target 38.2% retracement of 1.1936 (2016 low) to 1.4376 at 1.3448 first. Break will target 61.8% retracement at 1.2874 and below. For now, sustained break of 55 month EMA is needed to confirm medium term upside momentum. Otherwise, we won't turn bullish even in case of strong rebound.