Sample Category Title
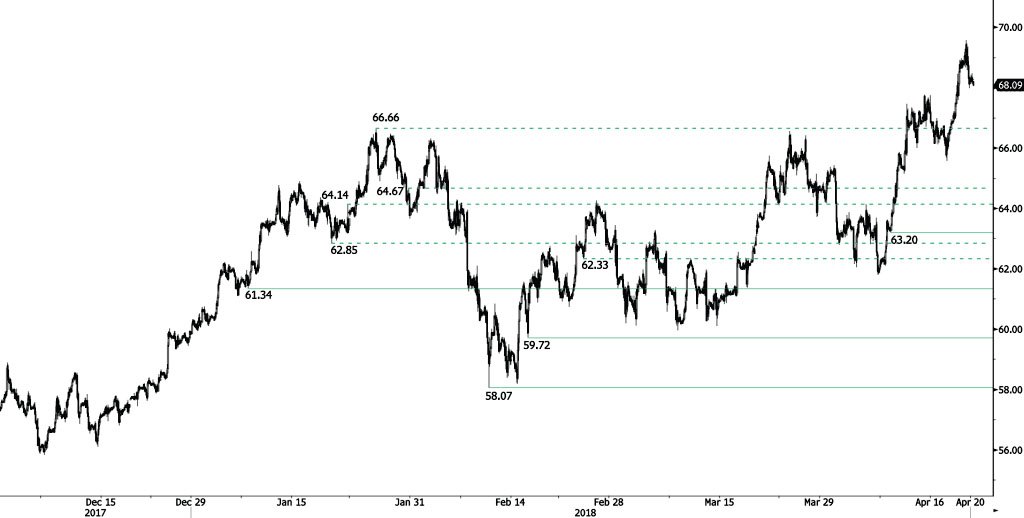
CRUDE OIL Weakening.
Crude oil bounce from 65.56 stops, decreasing and approaching the 68 range. Crude Oil is trading at its December 2014 high. The bullish pattern started in November 2017 is maintained. Hourly support at 63.20 (10/04/2018 low) is distanced. The technical structure suggests short-term downward moves.
In the long-term, crude oil has recovered after its sharp decline last year. However, we consider that further weakness is very likely. For the time being, the pair lies in an upside trend since June 2017. Support lies at 42.20 (16/11/2016) while resistance is located at 77.83 (20/11/2014). Crude oil is trading largely above its 200 DMA.
SILVER Profit Taking
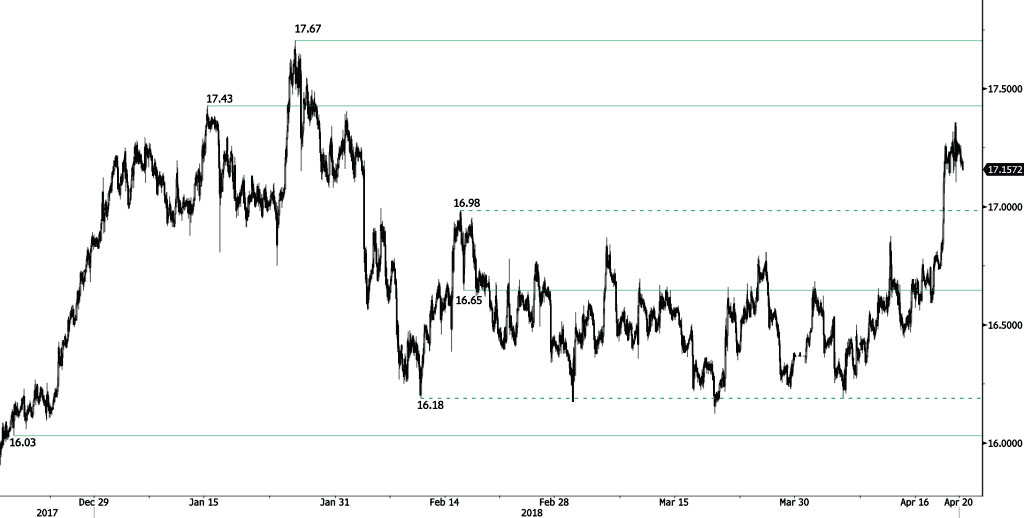
Silver rising pattern started in mid April weakens, falling from 17.36 high and heading along the 17.10 range. Hourly support and resistance are given at 16.03 (18/12/2017 low) and 17.67 (25/01/2018 high). The short-term technical structure suggests short-term decrease.
In the long-term, the trend remains negative/ sideways. Further downside is very likely. The pair is trading above its 200 DMA. Resistance is located at 21.58 (10/07/2014 high). Strong support can be found at 11.75 (20/04/2009).
GOLD Slight Decrease
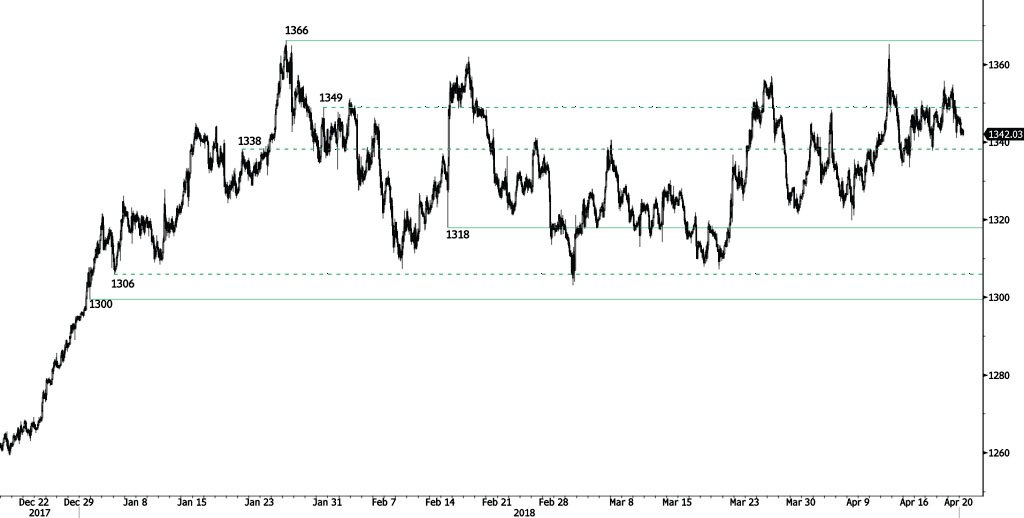
Gold recovery stops, decreasing from 1355 high and heading along the 1340 range. Hourly support and resistance are given at 1318 (14/02/2018 low) and 1366 (25/01/2018 high). The technical structure suggests short-term downward moves.
In the long-term, the technical structure suggests that there is a growing upside momentum. A break of 1'392 (17/03/2014) is required to confirm it. A major support can be found at 1'045 (05/02/2010 low).
EUR/CHF Slight Recovery After Reaching 1.20
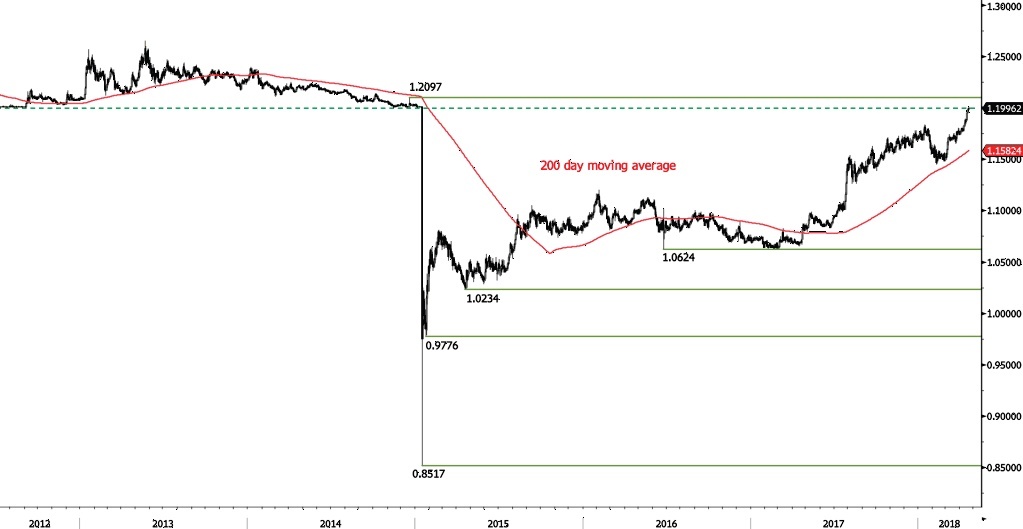
EUR/CHF bullish momentum pauses below the 1.20, slightly recovering and heading along the 1.20 range. Strong resistance above 1.205 remains. Hourly support given at 1.1842 (11/04/2018 low) is distanced. The short-term technical structure suggests short-term sideways trading moves.
In the longer term, the technical structure has reversed. Strong resistance at 1.20 (level before the unpeg) is now at reach. The ECB's slowing QE program is likely to cause buying pressures on the euro, which should weigh in favour of the EUR/CHF. Support and resistance can be found at 1.0624 (24/06/2016 low) and 1.2097 (18/12/2014 high).
EUR/GBP Continued Rise
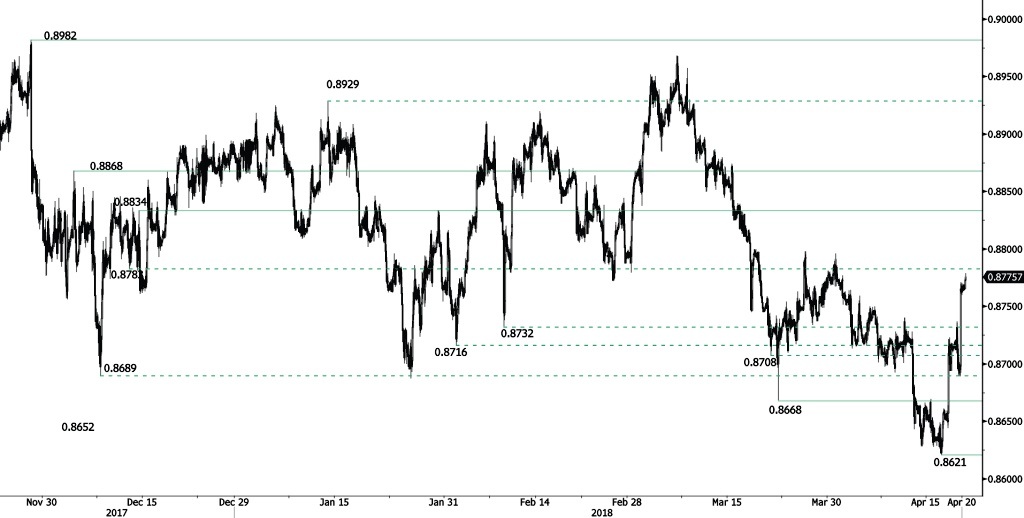
EUR/GBP bullish momentum started from 0.8644 continues, trading at 0.8783 and heading along the 0.8785 range. EUR/GBP bearish pattern started in March is somewhat weakened. Hourly support and resistance are given at 0.8621 (17/04/2018 low) and 0.8834 (14/12/2018 high). The technical structure suggests further short-term increase.
In the long-term, the pair has largely recovered from 2015 lows. The technical structure suggests further upside pressure. Strong resistance can be found at 0.9500 (psychological level) while support remains at 0.8304 (05/12/2016 low). The pair is trading below its 200 DMA.
GBP accelerating down as BoE Carney helped traders made up their mind
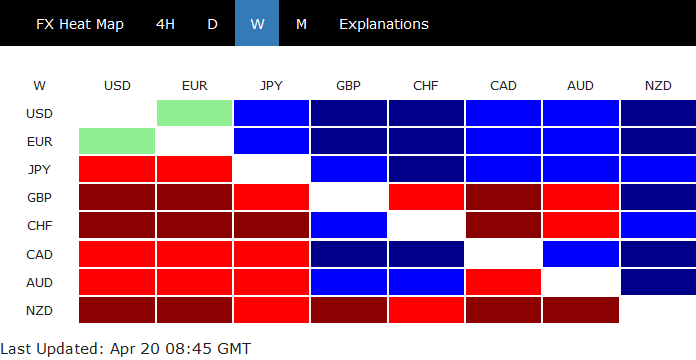
GBP had been rather resilient after triple misses of wage growth, CPI and retails sales. But selling finally picked up after comments from BoE governor Mark Carney yesterday. And GBP is now trading as the second weakest one for the week, just next to NZD.
 The key takeaway from Carney's comment is that he tried to tone down the chance of a May hike. He said "we have had some mixed data ... We'll sit down calmly and look at it all in the round." He added that "there will be some differences of view but it is a view we will take in early May, conscious that there are other meetings over the course of this year."
Carney noted that Brexit uncertainty had prevented a "surge in investment" And, "unfortunately that means in the short term that the speed limit (of the British economy) is not increasing. Productivity is not increasing, which will limit the rate at which people's wages can pick up."
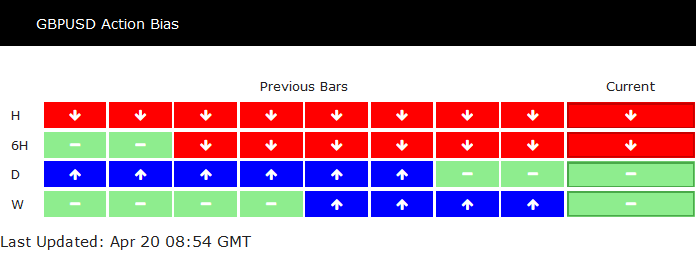
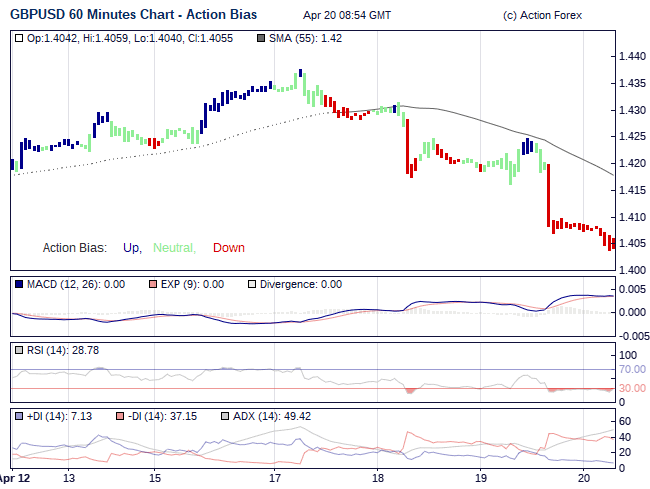
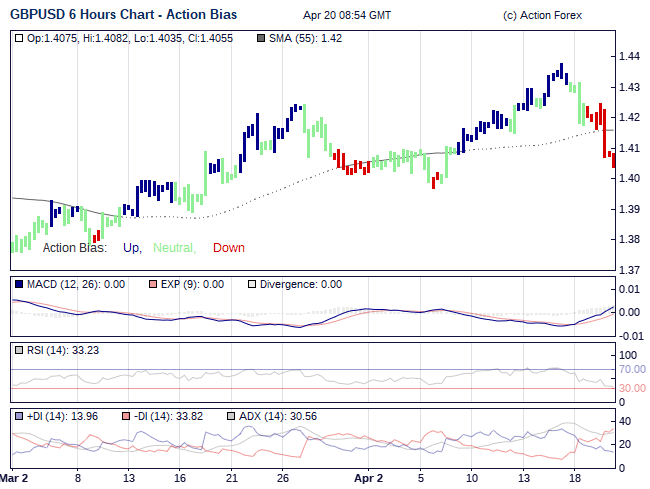
Near term action bias in GBP is starting to turn bearish.
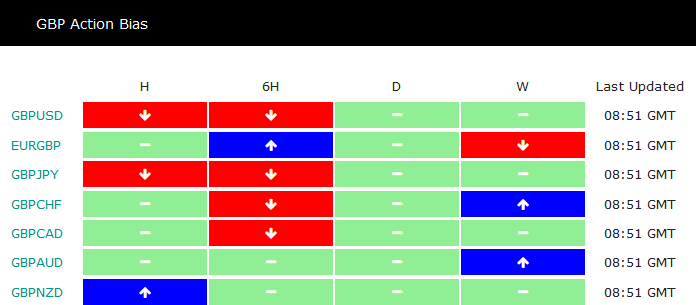 In particular, GBP/USD is in strong downside action bias in both H and 6H charts.
AUD/USD Approaching 0.77
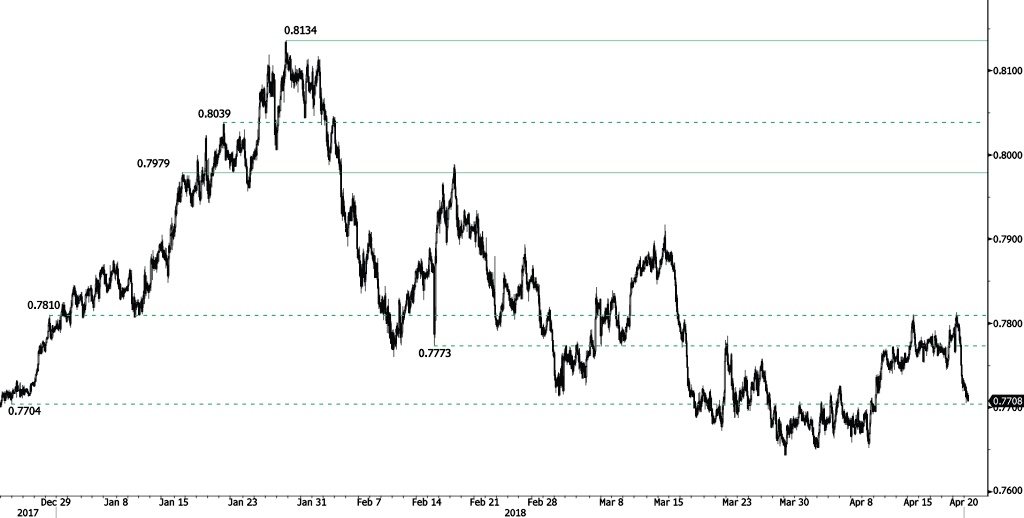
AUD/USD short-term momentum stops, the pair is heading lower, along the 0.7705 range. The pair is trading at December low. Hourly support and resistance are given at 0.7638 (15/12/2017 low) and 0.7979 (15/01/2018 high). The technical structure suggests short-term downward moves.
In the long-term, the upward trend slows down after failing to reach key resistance at 0.8164 (14/05/2015 low). Key support stands at 0.6009 (31/10/2008 low). A break of the key resistance at 0.8164 (14/05/2015 high) is needed to invalidate our long-term bearish view.
USD/CAD Trading Sideways
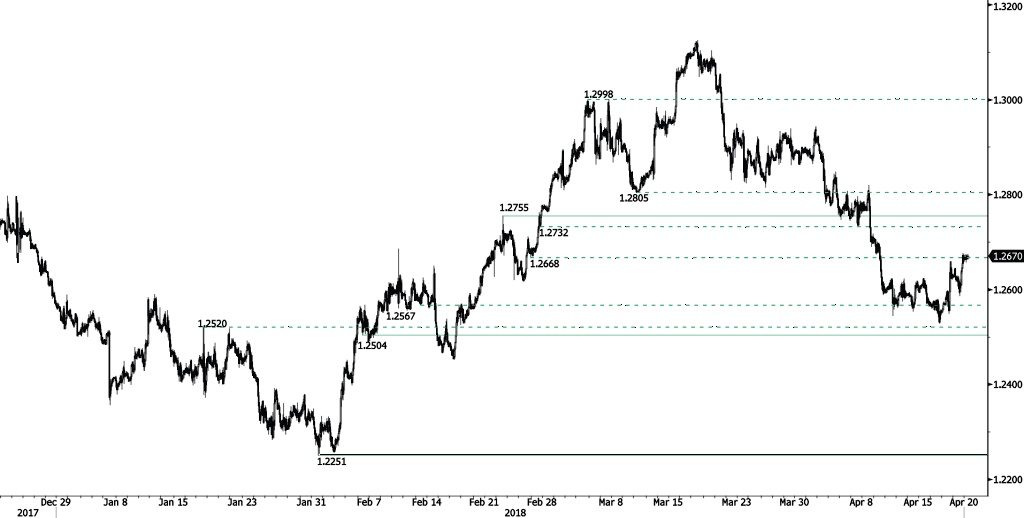
USD/CAD recovery phase from 1.2528 low pauses, starting a bearish consolidation at the 1.2665 range. Hourly support and resistance are given at 1.2504 (06/02/2018 low) and 1.2755 (22/02/2018 high). The short-term technical structure suggests short-term sideways trading moves.
In the longer term, the pair is trading between resistance point at 1.3805 (05/05/2017 high) and support at 1.2128 (18/06/2015 low). Strong resistance is given at 1.4690 (22/01/2016 high). The pair is likely to head lower. The pair is trading above its 200 DMA
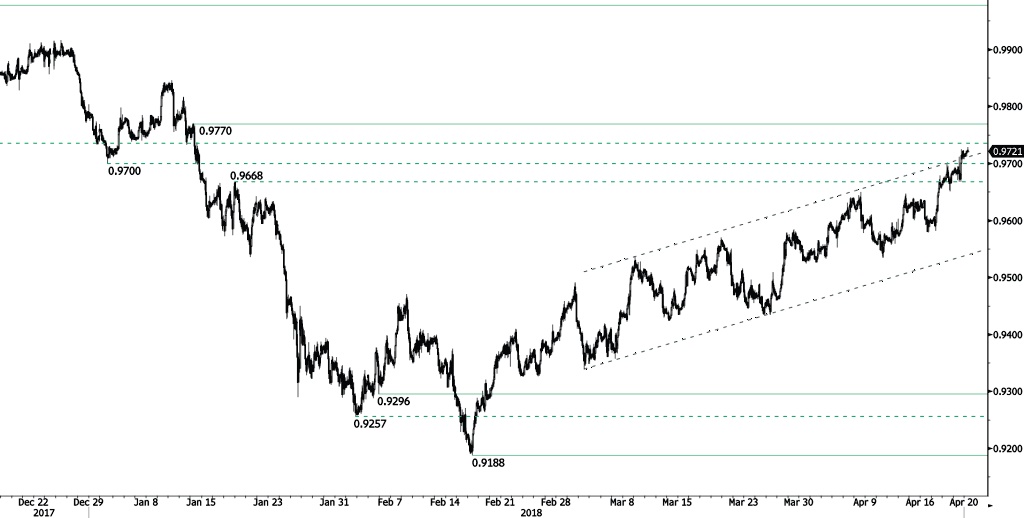
USD/CHF Exiting Upward Channel By The Top
USD/CHF rise continues, heading along the 0.9730 range. The bullish pattern started from 0.9188 (16/02/2018 low) continues. The pair is contained between hourly support and resistance given at 0.9296 (05/02/2018 low) and 0.9770 (12/01/2018 high). The technical structure suggests short-term sideways trading moves.
In the long-term, the pair is still trading in range since 2011 despite some turmoil when the SNB unpegged the CHF. Key support lies at 0.9072 (07/05/2015 low) while resistance at 1.0344 (15/12/2016 high) is distanced. The technical structure favours a long term bullish bias since the unpeg in January 2015.
USD/JPY Slight Increase
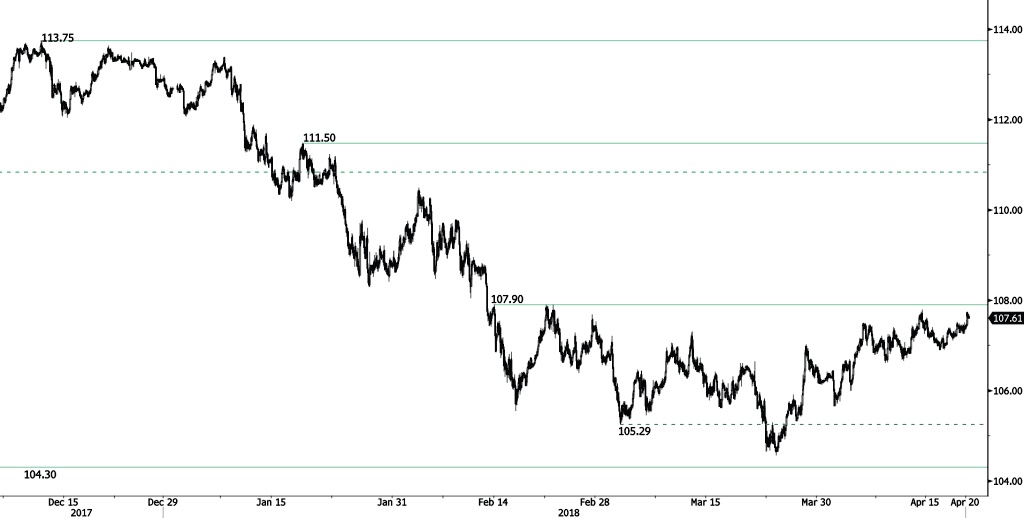
USD/JPY bounce from 106.90 low continues, approaching the 107.75 range. The bearish pattern started in January 2018 is somewhat weakening. The short-term technical structure suggests continued short-term upward moves.
We favor a long-term bearish bias. Support remains at 101.20 (09/11/2016 low). A gradual rise toward the major resistance at 125.86 (05/06/2015 high) seems unlikely. Expected to decline further support at 101.20 (09/11/2016 low). The pair trades below its 200 DMA.