Sample Category Title
GBPUSD Analysis: Plunges To Trend-Line
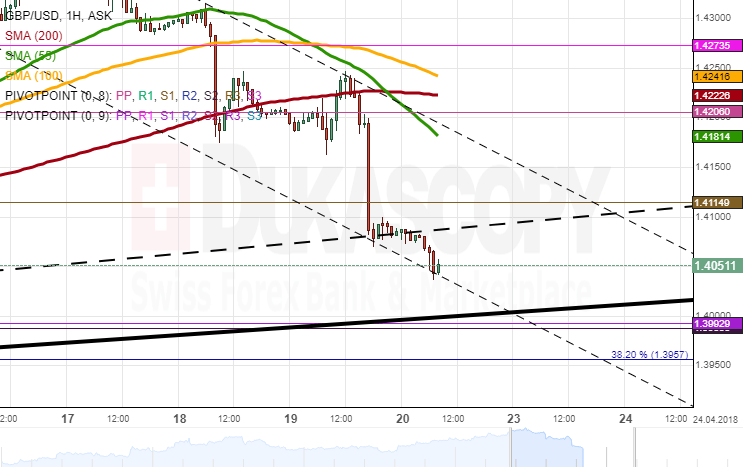
Following a 121-pip fall mid-Thursday, the Sterling entered a minor period of consolidation slightly below the 200-hour SMA. Any attempts to breach this moving average was disrupted by a massive hourly plunge which pushed the rate 0.76% or 107 pips lower down to a two-month trend-line.
By Friday morning, the pair had not still recovered from this fall, and it was trading in a narrow range near the 1.4080 mark.
It is more likely that this session marks a bullish reversal, as the market sentiment is expected to turn bullish after this two-day decline. The upside target should be the combined resistance of the 55– and 200-hour SMAs and the weekly PP at 1.42.
In case bulls fail to accelerate, the Pound might still edge slightly lower down to the senior channel, the monthly PP and the weekly S1 at 1.40.
USDJPY Analysis: Reaches two-month high
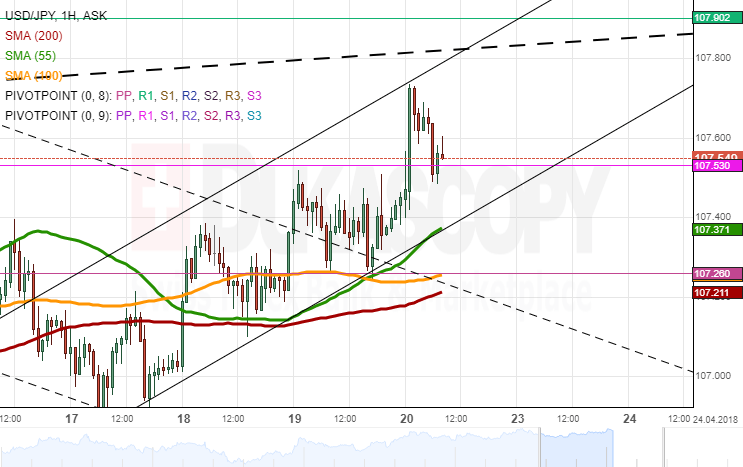
The trading session on Thursday did not introduce significant changes to the pair's position, as it remained fluctuating between the 55– and 100-hour SMAs and the weekly PP.
This lack of movement was turned around in the Asian session when the Greenback surged 27 pips and re-tested its two-month high of 107.70. Technical indicators suggest that the same bullish sentiment could prevail in this session, as well.
Apart from the aforementioned trend-line, the nearest resistance is set by the weekly R1 and the 38.20% Fibonacci retracement at 108.00, while a more distant northern barrier is the weekly R2 at 108.42.
Prior to the expected surge, the pair might still return for a re-test of the 55-, 100– and 200-hour SMAs. The 107.40 is unlikely to be breached.
Gold Analysis: Moves Below Long-Term Average
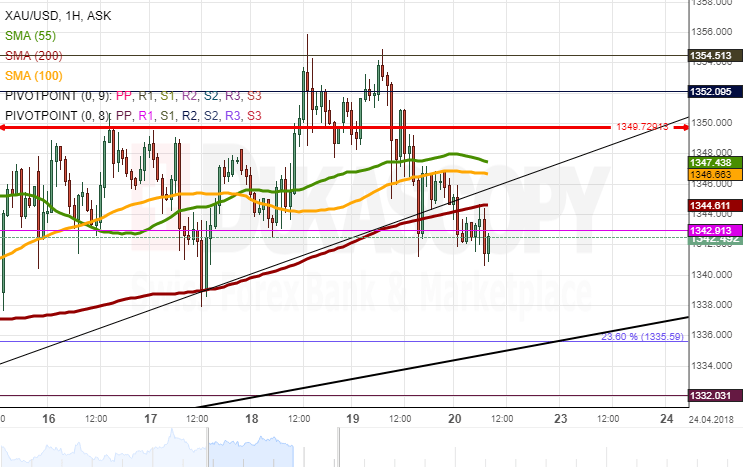
Contrary to expectations, the yellow metal was driven by bearish forces on Thursday. This fall, however, was not significant due to the nearby-located 200-hour SMA and a channel line.
This support cluster was surpassed early today, thus giving bears the opportunity to push the pair down to its distant support set by the 23.60% Fibonacci retracement at 1,335.40.
Technical indicators remain bullish for this session. Being restricted by the 55-, 100– and 200-hour SMAs, Gold might be reluctant to pick up momentum during the following hours, at least.
In case of an upside breakout, the pair should not surpass the monthly R1 at 1,355.00.
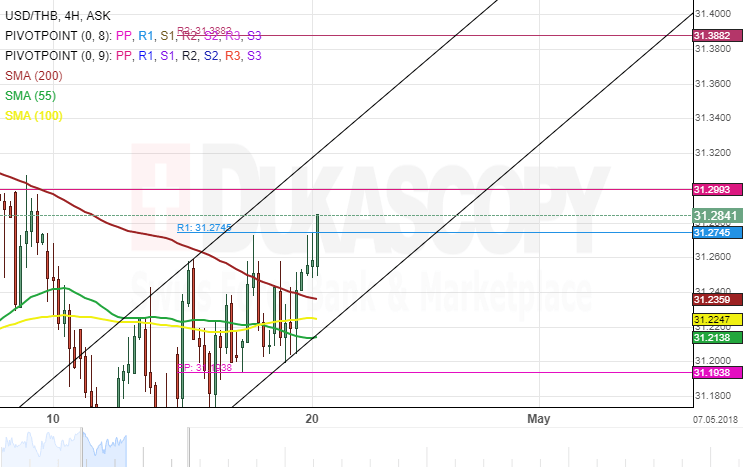
USD/THB 4H Chart: Breaks Long Term SMAs
There is something about the USD/THB pair that you can observe only by changing the time frames of the charts while having set up them to show the 200-period simple moving average.
Namely, the most important is the fact that the currency exchange rate has passed the 200-day SMA, which has kept the pair lower since the start of 2017. In addition, the four hour time frame 200-period simple moving average has recently been broken.
As a result of these moves in a combination with the passing of the weekly R1, the rate began a surge. The surge is set to be paused by a monthly pivot point at 31.30. However, above that there is almost nothing until 31.40.
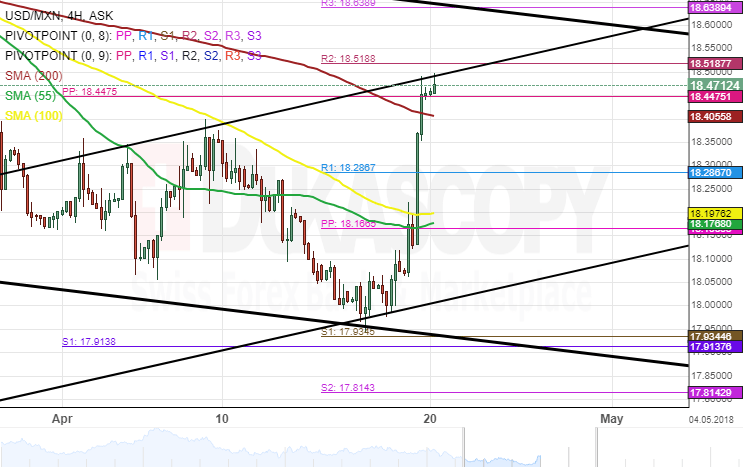
USD/MXN 4H Chart: Jumps To 18.50 Mark
The US Dollar recently gained massively against the Mexican Peso. That occurred mainly due to the political turmoil around the Mexican Presidential election, which caused a sudden fall in the value of the Peso.
However, the surge was stopped by a resistance line of a speculated ascending channel pattern at the 18.50 mark. Although, the psychological significance of this level might also have played a role.
Due to that reason a descent should be expected. However, the pair is set to face the support of the 200-period SMA and the monthly PP, respectively, at 18.41 and 18.45.
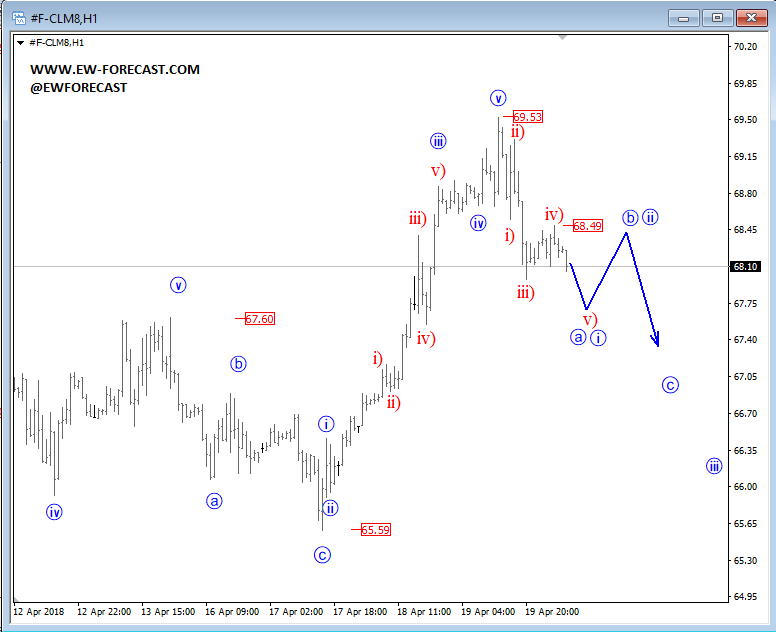
Elliott Wave Analysis: BTCUSD And Oil Update
Crude oil has completed five-wave rise, so if we get five-subwaves down within wave a/i, then we can expect at least a deeper three-wave drop within wave c/iii towards 65 level, but after small pullback within wave b/ii.
Crude oil, 1h
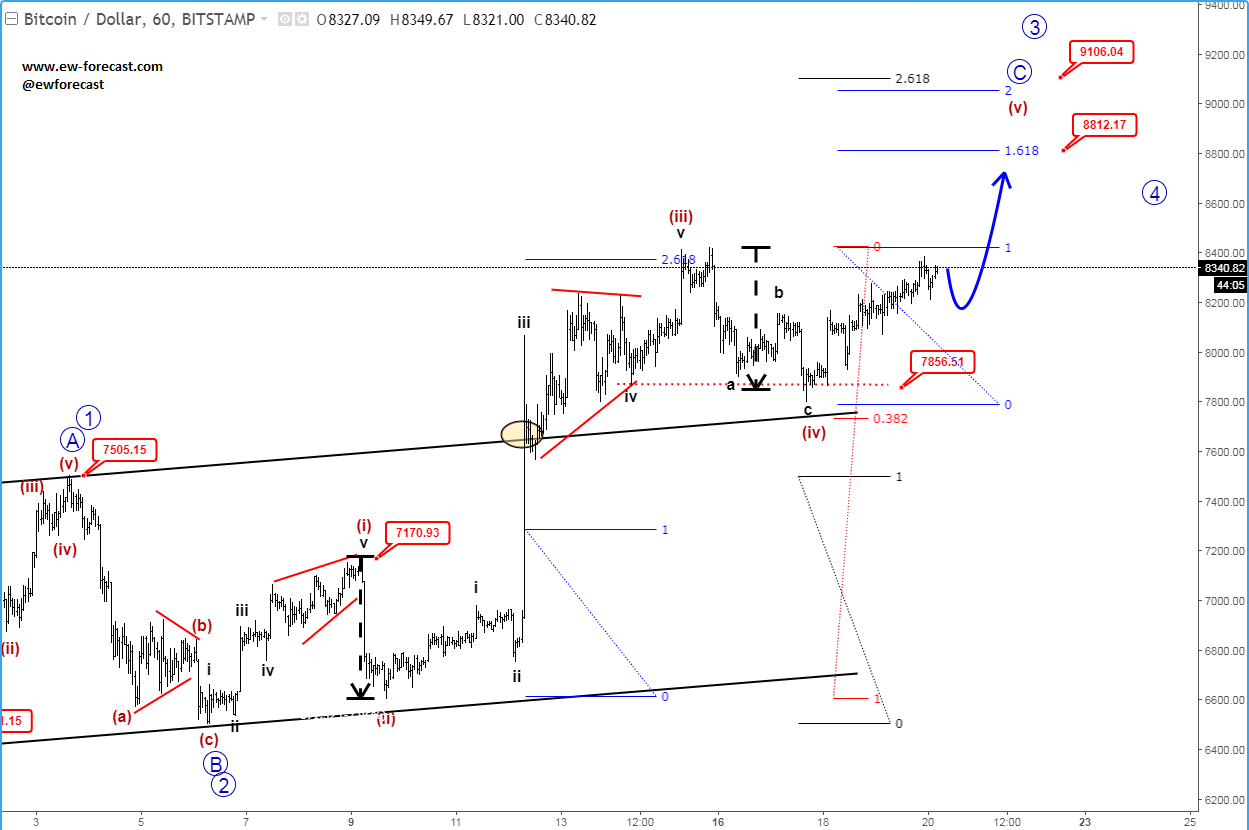
BTC is slow in the last days, but we still think it's a part of wave (iv) correction, because it bounced from ideal support around 38,2% Fibo. retracement. and base channel resistance line, which now act as a support. So there's room for more upside towards 8800-9100 within wave (v).
btcusd, 1h
GBPJPY Re-Challenges Rising Trend Line, Broader Trend Is Bullish
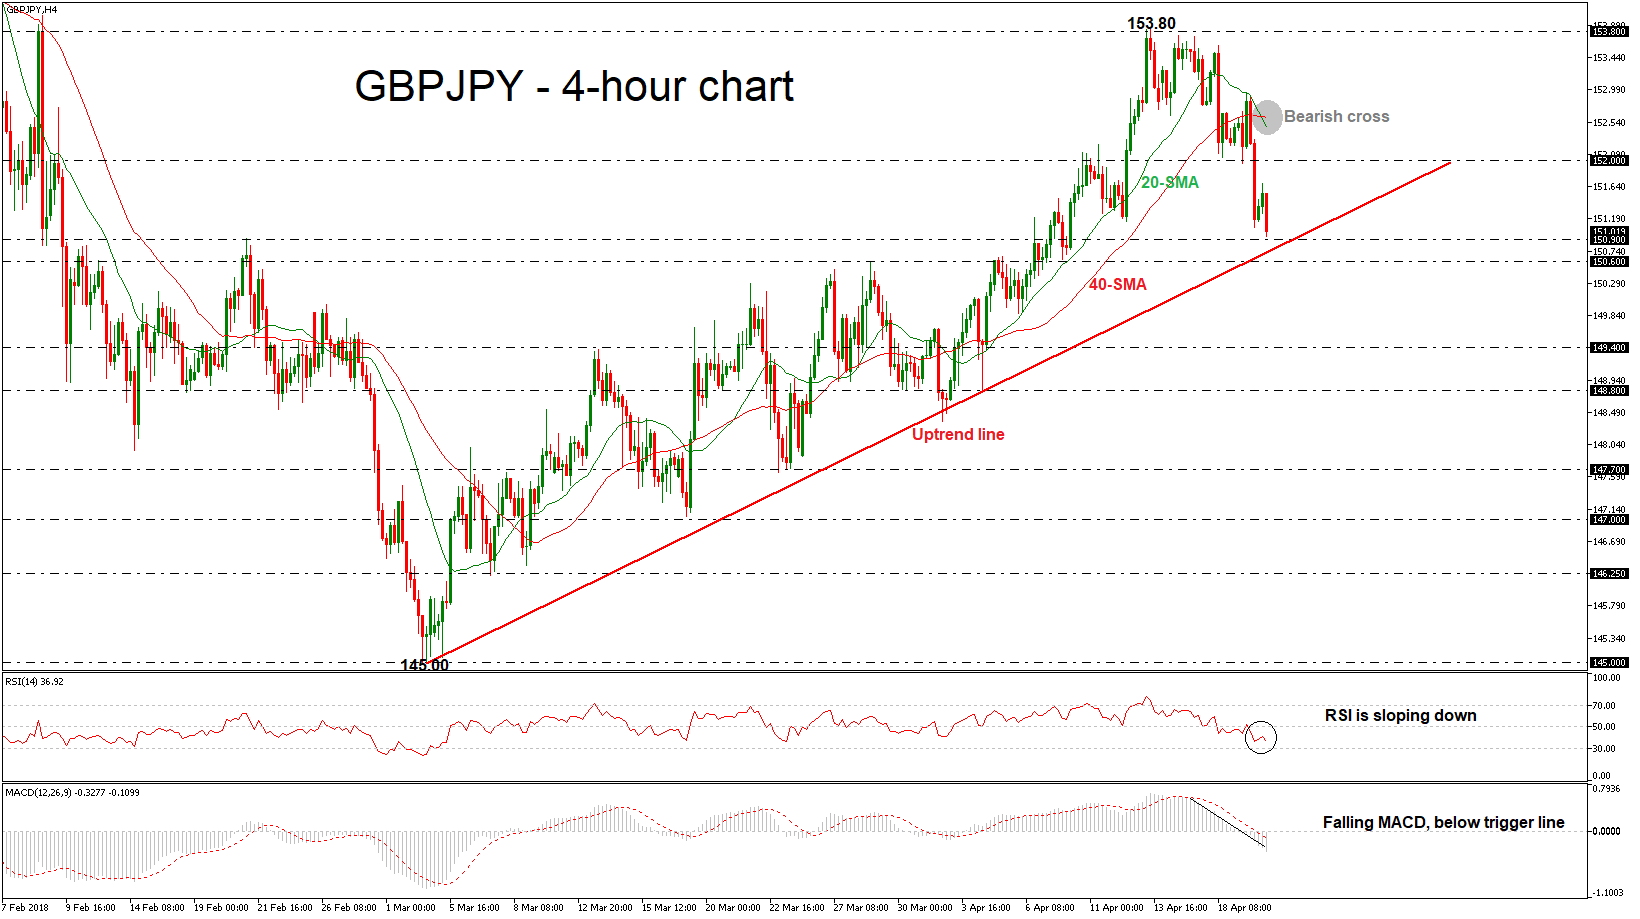
GBPJPY is posting an aggressive bearish session over the last few hours after two bullish candles in a row, in the 4-hour chart. In a longer-timeframe, the price edged sharply lower following the pullback on the 153.80 resistance level. The short-term technical indicators are bearish and point to more weakness in the market.
Looking at the 4-hour chart, prices are looking capped by the 20 and 40-period moving averages which are negatively aligned after a bearish crossover that took place during Asia’s session. The RSI indicator is moving south, approaching the negative threshold of 30, while the MACD oscillator is falling below the trigger and zero lines.
Should price continue the bearish bias, the next significant area to have in mind is the 150.60 – 150.90 support zone. These levels are standing near the short-term ascending trend line, which has been holding since March 2. In case of a dive below the diagonal line, this would increase bearish pressures and positive bias could shift to negative until the 149.40 support.
On the flip side, a possible scenario is a rebound from the rising trend line and the resumption of an upward movement once again. A strong resistance level to watch is the 152.00 handle, while above that, the next major resistance is near the bearish cross within the moving averages around 152.60.
Google Stock Jumps Above 40-Day SMA, Endorses Bullish Scenario Again
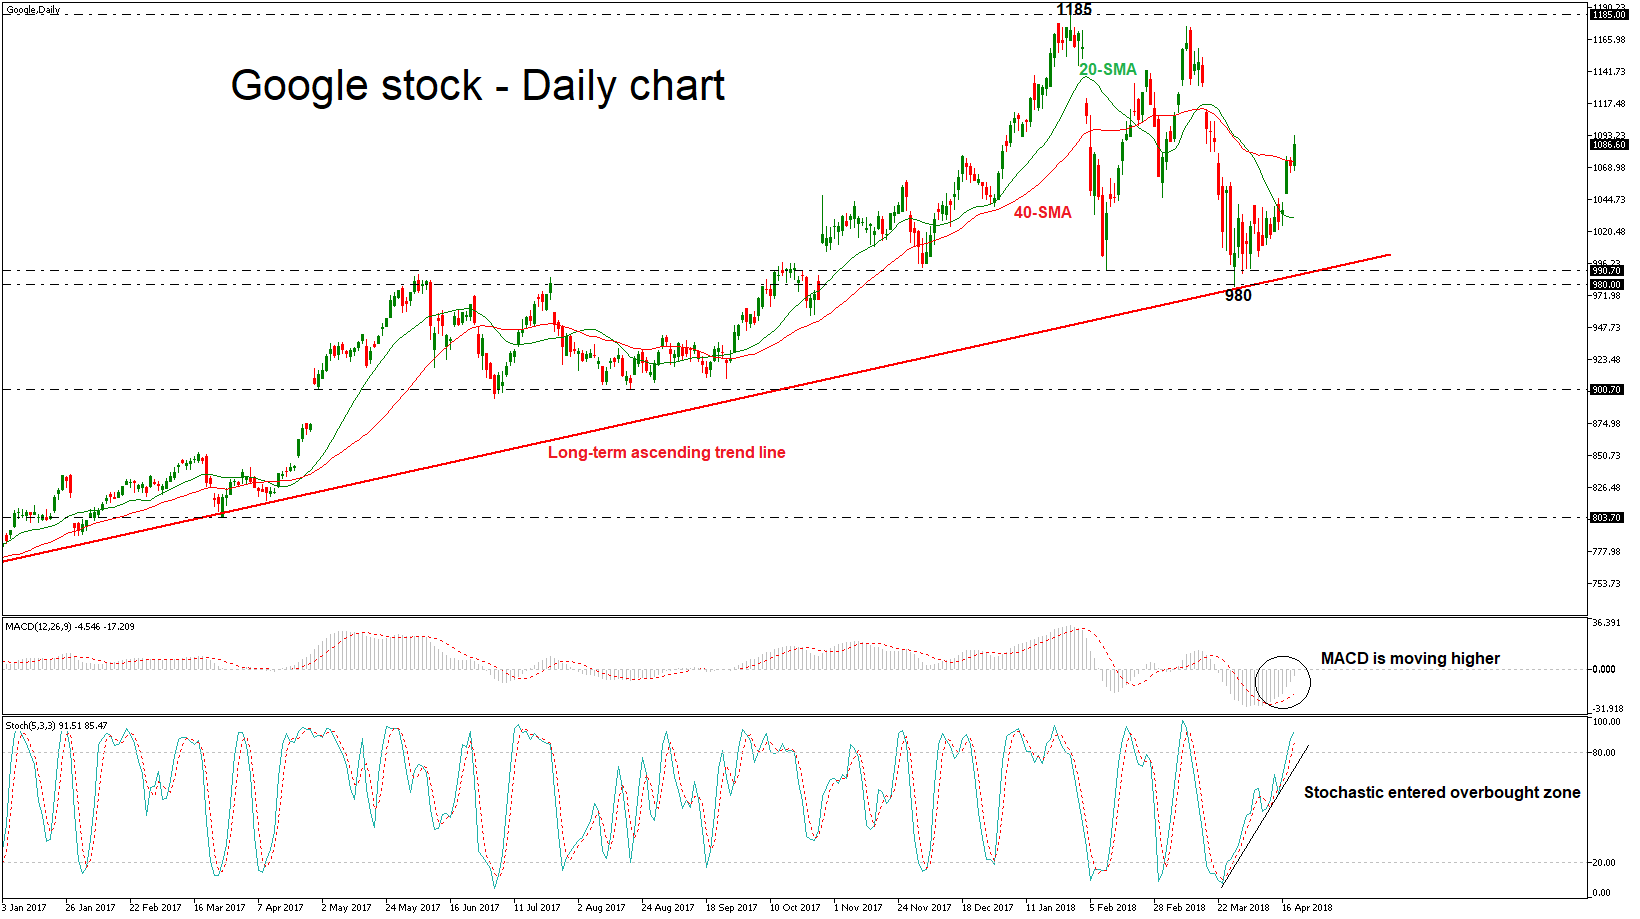
Google stock price edged higher over yesterday’s session, jumping above the 40-day simple moving average (SMA). The price rebounded on the 980.00 support level, which overlaps with the long-term ascending trend line, which has been standing since June 2015.The short-term momentum indicators are confirming the recent bullish bias.
In the daily timeframe, from the technical point of view, the stochastic oscillator records an aggressive bullish movement and entered the overbought zone, while the MACD oscillator is moving towards the positive area.
To the upside, in case of a continuation of the advance the next significant level to have in mind is the 1185 resistance, which last touched on January 29. A successful surpass above this area could take the stock closer to the 1200 key level.
Conversely, there are obstacles such as the 40-day SMA at 1073 and the 20-day SMA near 1130, where the price needs to go through them before it moves towards the 990.70-980 areas, taken from the lows on April 2 and March 28 respectively.
Good progress on NAFTA talks but no timeline yet
Canadian Foreign Minister Chrystia Freeland U.S. Trade Representative Robert Lighthizer and Mexican Economy Minister Ildefonso Guajardo started intensive NAFTA talks in Washington yesterday.
Freeland sounded upbeat as she said there were "good progress" made on the "rules of origin in our conversations with the U.S., with Mexico, and in our trilateral conversation." But she declined to comment on whether there would be a deal within the next three weeks, as the US is pushing for.
Freeland just noted that "our commitment is to get a really good win-win-win outcome as quickly as possible and...we'll work as long as it takes to get a great deal".
The talks will continue today.
Bitcoin Strengthening
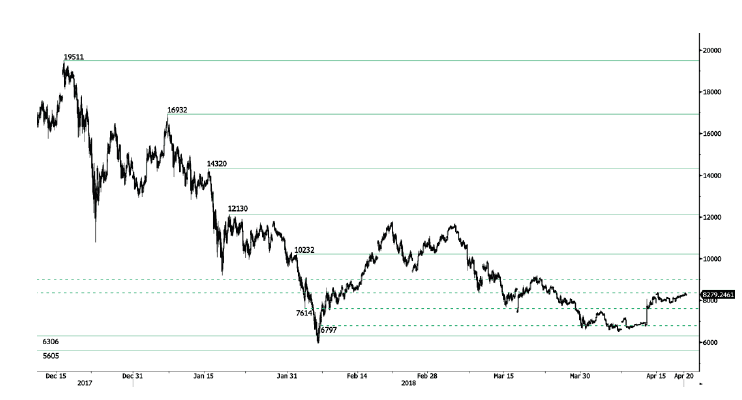
Bitcoin rise started in mid April starts back, currently trading above 8300 and heading along the 8400 range. Bitcoin bearish pattern started in March 2018 is maintained as long as the 9000 range is not reached. The pair is contained between hourly support and resistance given at 6306 (13/11/2017 low) and 10232 (01/02/2018 high). The technical structure suggests shortterm increase.
In the long-term, the digital currency has had an exponential growth but also presented important downturns. There is decent likelihood that the currency could stabilize between 7'000 - 12'000 in 2018. Bitcoin is trading slightly above its 200 DMA (8000 range).