Sample Category Title
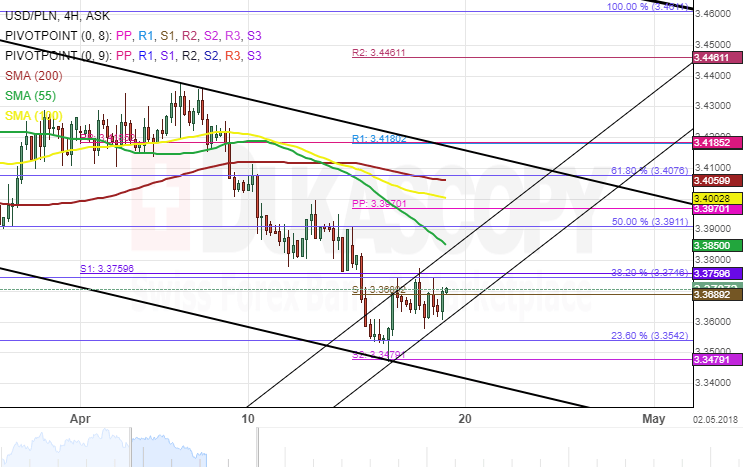
USD/PLN 4H Chart: Occuring Rebound
The US Dollar recently reached the lower trend line of a long term descending channel against the Polish currency. As a result the pair has already formed a short term ascending channel pattern.
However, the channel has met with fierce resistance in the form of the monthly S1 at the 3.3760 mark and the 38.20% Fibonacci retracement level, which is located just below it at the 3.3750 mark.
Due to that reason this isn't a set up where one can simply enter. Instead a retail trader should look for the moment, when the mentioned resistance is finally passed. When that occurs, most likely a break out to the upside will occur.
Dollar Supported By Higher Yields
Thursday April 19: Five things the markets are talking about
Euro equities are struggling for traction after two consecutives session of gains while Far East bourses rallied to new monthly highs on investor optimism over global growth. Most commodities prices have gained as metals including aluminum and nickel extended their rally.
Sovereign yields are somewhat steady after three day’s of backing up. The market is talking about the possibility of an inverted U.S yield curve in the coming quarters.
In FX, the yen saw some selling pressure as President Trump and Japanese PM Abe agreed to work closely on bi-lateral trade.
On the geo-political front, there have been some tentative signs of dissipating this week. The U.S has indicated it has laid the ground works for direct talks with N. Korea and even Russia’s Putin is believed to be seeking to “dial down” tensions with America.
1. Stocks mixed session overnight
In Japan, the Nikkei reached a new seven-week high on relief over U.S/Japan summit outcome. Steelmakers – one of the worst performers since Trump announced steel and aluminum tariffs – led the gains. The Nikkei ended up +0.15%, while the broader Topix rallied +0.03%.
Down under, Aussie stocks rallied for a fifth straight session overnight as a rally in commodity prices drove up resources stocks. The S&P/ASX 200 index rose +0.3%. In Korea, the Kospi rallied +0.25%.
In Hong Kong, stocks ended higher on Thursday, led by energy shares, after oil prices hit new four-year highs (see below). The Hang Seng index closed +1.4% higher, while the China Enterprises Index closed up +2.1%.
In China, robust energy and commodity prices supported stocks. The blue-chip CSI300 index ended +1.2% higher, while the Shanghai Composite Index gained +0.9%.
In Europe, regional bourses trade mixed following mixed earnings, rising crude oil prices and weaker U.K retail sales data (see below). The FTSE 100 continues to outperform supported mostly by a weaker pound sterling (£1.4197).
U.S stocks are set to open in the ‘red’ (-0.2%).
Indices: Stoxx600 -0.1% at 381.5, FTSE +0.2% at 7329, DAX -0.2% at 12566, CAC-40 +0.1% at 5382, IBEX-35 -0.1% at 9850, FTSE MIB -0.1% at 23739, SMI -0.1% at 8826, S&P 500 Futures -0.2%
2. Oil at fresh highs on Saudi seeking price hike, gold higher
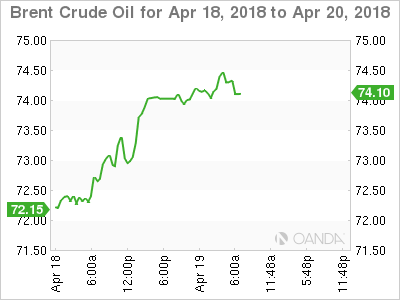
Crude oil prices trade atop of their four year highs as U.S inventories declined, moving closer to five-year averages, and after rumblings that Saudi Arabia is seeking to push oil prices higher.
Brent futures are at +$74.35 per barrel, up +87c from Wednesday’s close, while U.S West Texas Intermediate (WTI) crude futures have rallied +71c to +$69.18 a barrel.
Note: Brent crude oil futures have rallied as high as +$74.44 a barrel, the strongest since Nov., 2014, the day that OPEC decided to pump as much as it could to defend market share, sending the price to a low of $27 just over a year later.
OPEC and its partners will meet in Jeddah, Saudi Arabia, tomorrow and then again on June 22 to review its oil production policy.
Reuters reported yesterday that the Saudi’s would be happy to see crude rise to +$80 or even +$100 a barrel, which may suggest that Riyadh will seek no changes to the supply-cutting deal.
Also supporting prices are current U.S inventory reports. The EIA yesterday reported commercial crude stocks falling by -1.1m barrels in the week to April 13, to +427.57m barrels, close to the five-year average level of around +420m barrels.
The U.S is also expected to will re-introduce sanctions against Iran, OPEC’s third-largest producer, which could result in further supply reductions.
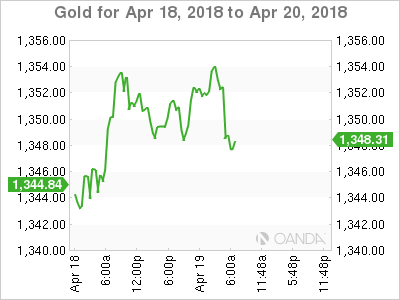
Gold prices have rallied for a fifth consecutive session, supported by a rally in base metals that has fuelled concerns of inflationary pressures. Ongoing U.S.-China trade tension is also lending further support. Spot gold has risen +0.3% to +$1,353.22 per ounce, while U.S gold futures have rallied +0.2% to +$1,356.30 per ounce.
3. Yields push up to multi week highs
In yesterday’s U.S Beige Book economic report, the U.S Fed said “continued growth in U.S economy is evidenced by robust business borrowing, higher consumer spending, and tight labor markets.”
On the back of this, U.S government bond prices weakened, pushing the 10-year yield up +5 bps to +2.867%, its biggest one-day climb in two-months.
Elsewhere this morning, spreads between the bonds of E.U periphery and German Bunds are trading a tad narrower ahead of the U.S open and the most tightening posted by Italian spreads.
Italian BTP’s continue to benefit from the positive economic environment and benign realized volatility. The 10-year Italian BTP/German Bund spread has tightened -1.4 bps to +118 bps, while Spanish/German and Portuguese/German 10-year bond spreads are both tighter by about -1 bps, at +68 bps and +107 bps respectively.
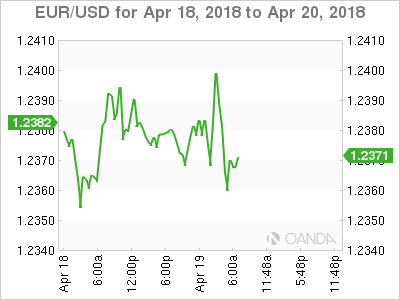
4. Dollar supported by higher yields
The USD is a tad firmer against its G10 currency pairs as U.S sovereign yields back up to new one-month highs.
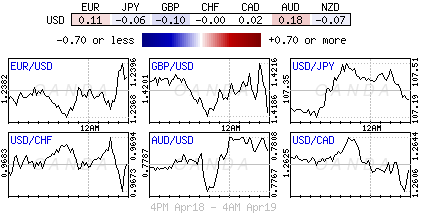
GBP/USD (£1.4197) is lower by -0.3% outright after another disappointing round of data. Retail sales data missed across the board (see below). The pound began the session trying to recoup some of yesterday’s losses, which was supported by softer wage and inflation headline prints. Fixed income traders are beginning to price out the odds of a second BoE hike this year – a hike is priced in for next month.
Both the Euro and JPY outright continue to trade in their contained ranges. EUR/USD is trading at €1.2365 ahead of the U.S open, while USD/JPY trades atop of ¥107.42.
Down-under, AUD (A$0.7793) did see some volatility in their session after Aussie employment rose less than forecast in March, suggesting that the Reserve Bank of Australia (RBA) will need to keep interest rates on hold.
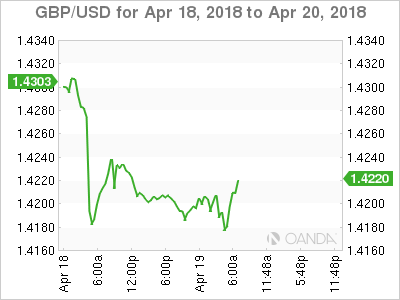
5. Sales miss hits U.K growth
U.K data this morning showed that retail sales slumped last month during a spell of bad weather, adding to signs that the economy got off to a slow start in the Q1.
Retail sales fell -1.2% in March compared with February, with large declines in categories including food, clothing and household goods.
Digging deeper, gas sales were hit particularly hard as poor weather affected travel.
In total, Q1 reading of retail sales fell -0.5% compared with Q4, 2017. The poor performance is expected to shave -0.03% off GDP for Q1.
Note: The U.K economy is expected to lag its Euro partners in 2018 as uncertainty over the terms of its future relationship with the E.U weighs on activity and investment.
Today’s softer headline print will further diminish market expectations of a second Bank of England (BoE) hike in 2018 – they are still seen hiking next month.
Forex Analysis: Gold And NZDUSD
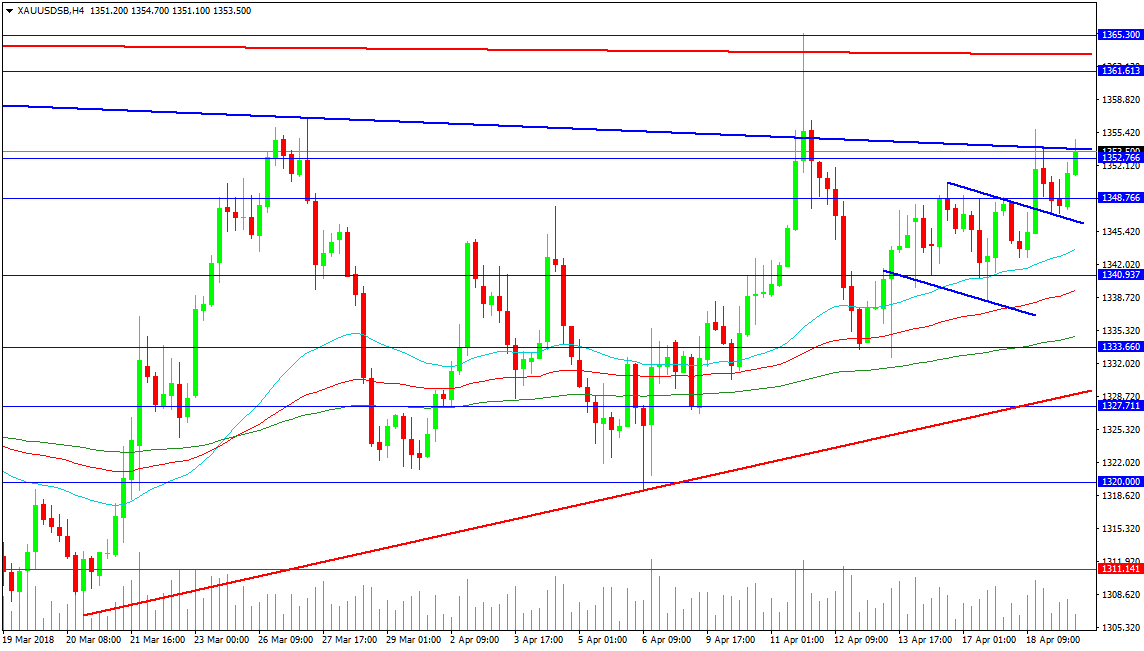
The commodities block has been rising, with oil and metals leading the way. Gold has tested its down trend line resistance again at 1354.00, with a close above this level targeting resistance around 1365.30. The creation of higher lows strongly reinforces this move but caution must be taken that the market doesn’t enter a sideways pattern. A move above resistance leads to 1370.00, followed by 1378.00 and 1390.00. The 1400.00 area remains a target gold bulls will relish achieving but focus will soon shift to higher levels at 1435.00 and 1450.00.
Support comes from the trend line at 1346.50, which has been successfully retested after the breakout. The 4-hour 50-period MA is located at 1343.56, with the 100 MA at 1339.40 and the 200 MA at 1334.75 and rising. The 1333.66 level is mildly supported by the rising red trend line at 1328.90, with stronger support close by at 1327.70. The 1320.00 level held up well during the test on the 6th of April, with a drop below targeting 1311.14 and the 1300.00 area, specifically 1302.50.
NZDUSD
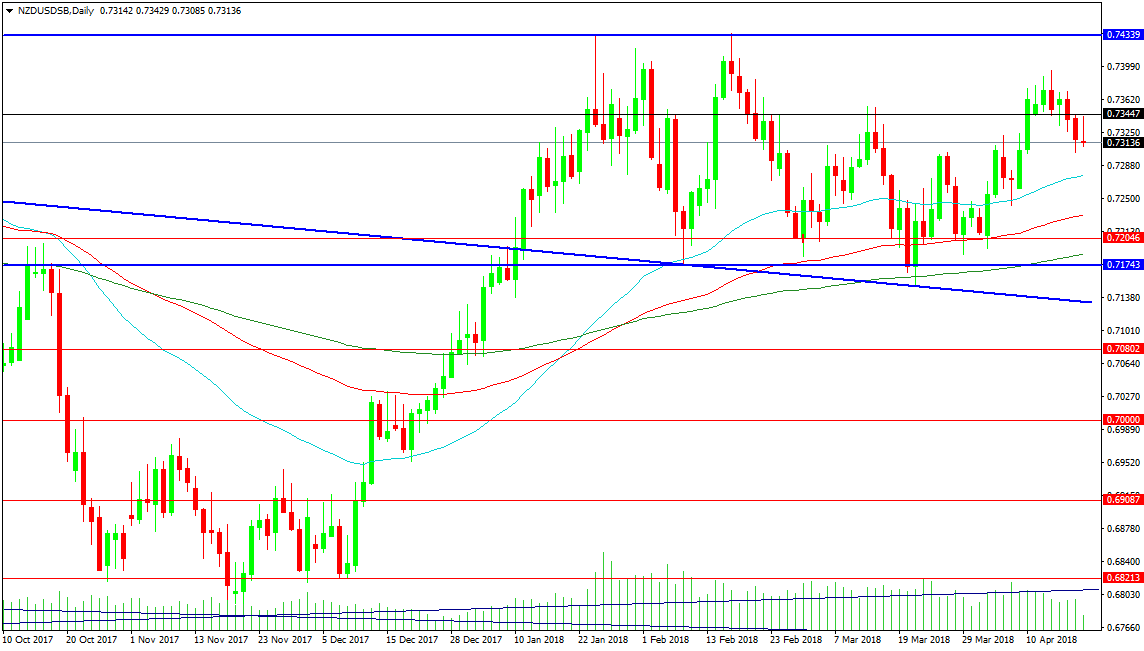
The NZDUSD pair has settled into a trading range between 0.71500 and 0.74340, after breaking above trend line resistance at 0.72000 and successfully retesting said trend line on two occasions since. The upward bias is still present on the chart, with a move above the highs needed to push the market higher. The 0.73447 level is providing resistance at present, with the high at 0.73900 also creating a lower high. It is possible this formation turns into a Bull flag, with a target in the 0.77300 area. A move above resistance at 0.75000 and 0.76240 is needed to reach that area.
Support comes in at the 50 DMA at 0.72760, with the 100 DMA at 0.72312 and the 200 DMA at 0.71867. The falling trend line comes in at 0.71330. A move under this line would target resistance at 0.70800, followed by 0.70000 and 0.69087. The lows of late 2017 come in at 0.68213 and 0.67797.
Fed Speakers And Earnings In Focus
- Markets Steady After Strong Start to Earnings Season;
- Retail Sales Data Provides Further Headache For BoE.
'Stocks have been gradually rising this month which has been aided by easing trade war tensions and the geopolitical environment becoming less of a concern'
Financial markets appear to have lost some of their spark in recent days, with a flat session on Wednesday being followed by similar trading in Europe on Thursday and US futures pointing to a similar open.
Stocks have been gradually rising this month which has been aided by easing trade war tensions – albeit far from resolved – and the geopolitical environment, while remaining heated, becoming less of a concern. Earnings season has also got off to a very good start with the banks reporting strong earnings growth and comfortably beating already inflated market expectations.
The number of companies reporting on the first quarter will pick up considerably over the coming weeks and, in the absence of tensions mentioned above significantly escalating, could help the recovery in market which have struggled since late January. Other events of note today will be the release of jobless claims data and speeches from three Federal Reserve officials including Lael Brainard, Randal Quarles and Loretta Mester, all of whom are voters on the FOMC.
'The figures, combined with the inflation and labour market data earlier in the week won’t make for easy reading for the Bank of England which has been prepping investors for a rate hike'
UK retail sales slumped on a month by month comparison in March, with bad weather having an adverse impact, particularly on petrol sales, although online performance provided a positive takeaway. A weak showing in March meant annual growth slipped to only 1.1% and while temporary factors may have strongly contributed to it, it is part of a longer term trend of softer consumer spending driven primarily by the squeeze on incomes.
That squeeze is likely to ease over the course of this year thanks to a combination of lower inflation and slightly higher wages, with the numbers earlier in the week confirming real wages grew by 0.1% in February for the first time in a year. The figures, combined with the inflation and labour market data earlier in the week won’t make for easy reading for the Bank of England which has been prepping investors for a rate hike, widely seen prior to this week as coming in May.
Softer inflation and weak consumer spending at a time when the economy is growing at a slow pace and facing the uncertainty of Brexit makes the case for a rate hike less compelling. Still, while market expectations of a hike have fallen to around 68%, I still expect policy makers to push through with one in May and possibly accompany it with dovish language intended to talk down the possibility of another this year.
WTI Oil – Bulls Eye Next Target At $70
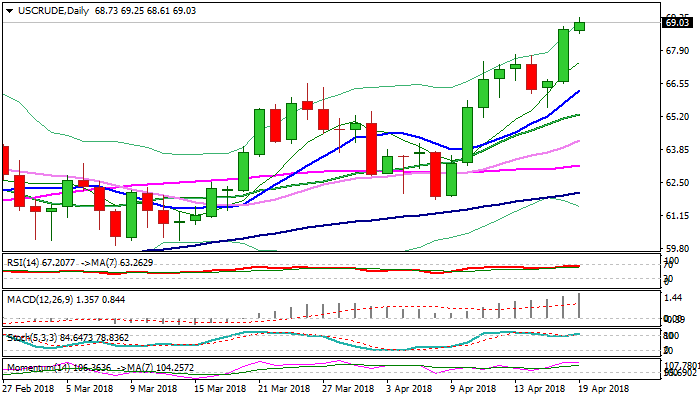
WTI oil price hit new over three-year high at $69.25 on Thursday, in extension of previous day’s strong rally.
Strong bullish sentiment returned to play after brief $67.74/$65.55 correction, as weekly crude stocks fell more than expected (1.07 million barrels vs 0.5 million barrels draw forecasted), EIA report showed on Wednesday and Saudi Arabia continues to push for production cut, in order to further tighten oil market.
OPEC and Russia, key world oil producers maintain their efforts for extended output cut to neutralize negative impact from oversupply and eye $80 per barrels as next target, signaling that oil price could extend even higher.
Bulls approach initial target at $70 and could extend in the short-term towards $76.35 (Fibo 61.8% of 107.45/$26.04 fall) on break higher.
Bullish daily studies add to positive sentiment, however, overbought slow stochastic warns of hesitation on approach to $70 target.
Last week’s former high at $67.74 marks initial support ahead of previous top at $66.64 (25 Jan), where extended dips should find ground.
Res: 69.25, 70.00, 71.00, 71.86
Sup: 68.61, 67.74, 66.64, 66.40
Bitcoin Bearish Consolidation
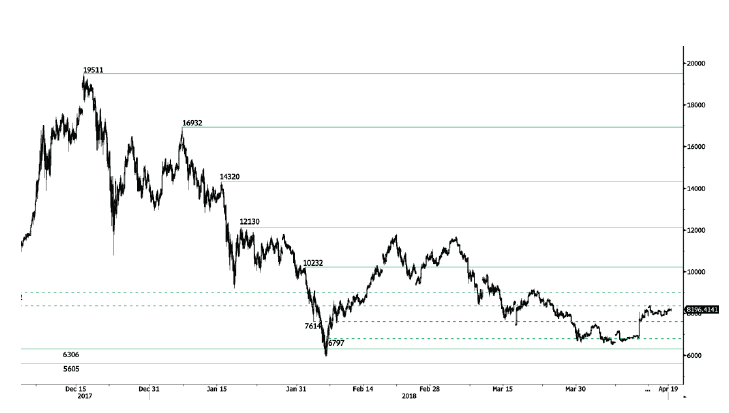
Bitcoin rise started in mid April pauses, currently trading above 8000 and heading along the 8090 range. Bitcoin bearish pattern started in March 2018 is maintained as long as the 9000 range is not reached. The pair is contained between hourly support and resistance given at 6306 (13/11/2017 low) and 10232 (01/02/2018 high). The technical structure suggests shortterm sideways trading moves.
In the long-term, the digital currency has had an exponential growth but also presented important downturns. There is decent likelihood that the currency could stabilize between 7'000 - 12'000 in 2018. Bitcoin is trading slightly above its 200 DMA (8000 range).
CRUDE OIL Edging Higher
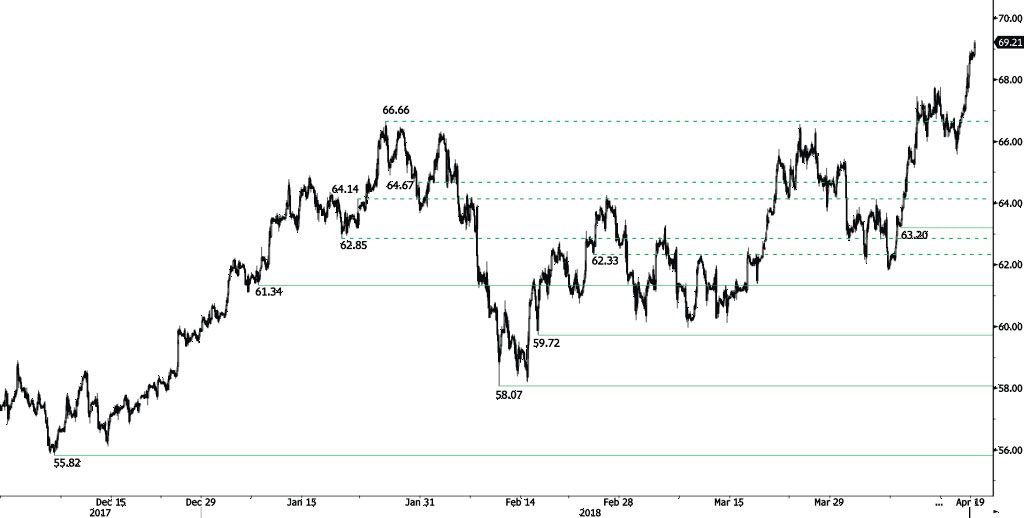
Crude oil bounce from 65.56 continues, heading along the 69.25 range. Crude Oil is trading at its December 2014 high. The bullish pattern started in November 2017 is strengthened. Hourly support at 63.20 (10/04/2018 low) is distanced. The technical structure suggests further short-term increase.
In the long-term, crude oil has recovered after its sharp decline last year. However, we consider that further weakness is very likely. For the time being, the pair lies in an upside trend since June 2017. Support lies at 42.20 (16/11/2016) while resistance is located at 77.83 (20/11/2014). Crude oil is trading largely above its 200 DMA.
SILVER Bullish Breakout
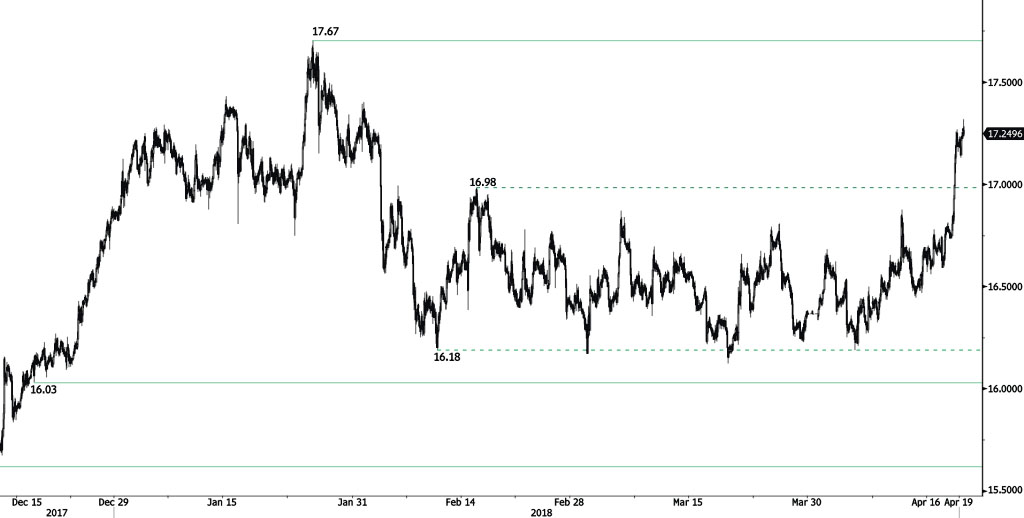
Silver rising pattern started in mid April strengthens following recent rise from 16.76, trading at the January range and heading along 17.30. Hourly resistance at 16.98 (15/02/2018) is now broken. Hourly support and resistance are now given at 16.03 (18/12/2017 low) and 17.67 (25/01/2018 high). The short-term technical structure suggests further short-term increase.
In the long-term, the trend remains negative/ sideways. Further downside is very likely. The pair is trading above its 200 DMA. Resistance is located at 21.58 (10/07/2014 high). Strong support can be found at 11.75 (20/04/2009).
GOLD Bouncing Off
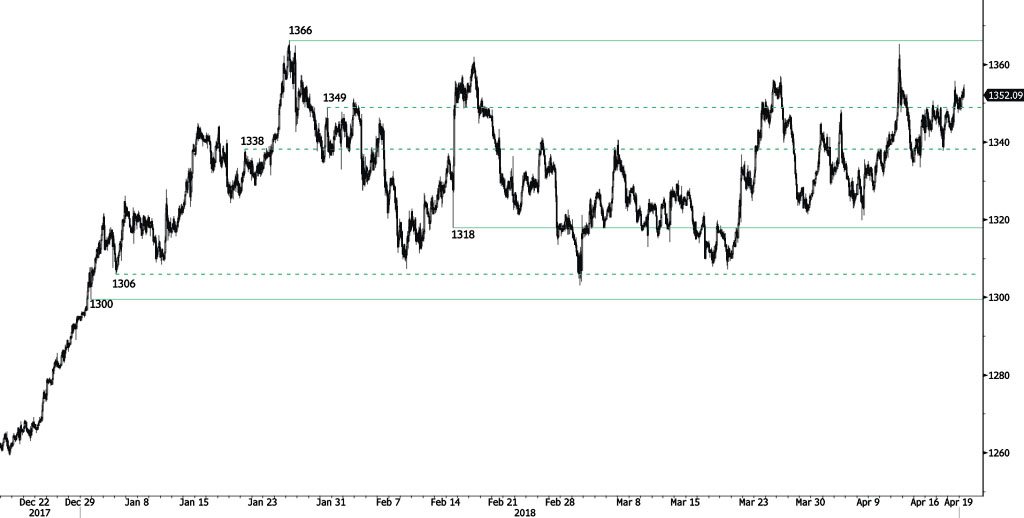
Gold is recovering from 1348 low, heading along the 1355 range. Hourly support and resistance are given at 1318 (14/02/2018 low) and 1366 (25/01/2018 high). The technical structure suggests short-term upward moves.
In the long-term, the technical structure suggests that there is a growing upside momentum. A break of 1'392 (17/03/2014) is required to confirm it. A major support can be found at 1'045 (05/02/2010 low).
EUR/CHF Slight Decline At 1.1981
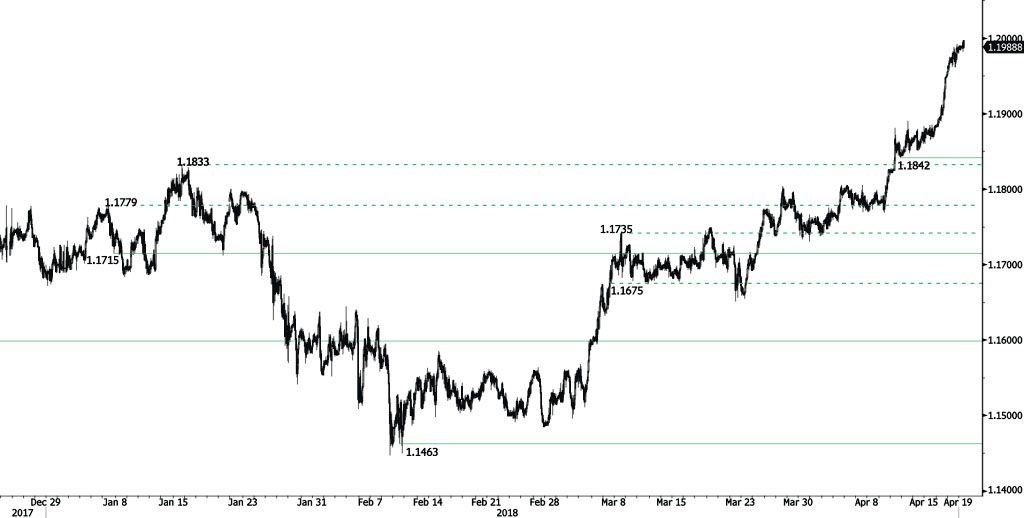
EUR/CHF bullish momentum pauses below the 1.20 slightly declining and heading along the 1.1975 range. Strong resistance at 1.20 (level before the unpeg) remains. Hourly support given at 1.1715 (07/01/2018 low) is distanced. The short-term technical structure suggests shortterm decrease.
In the longer term, the technical structure has reversed. Strong resistance is given at 1.20 (level before the unpeg). Yet, the ECB's slowing QE program is likely to cause buying pressures on the euro, which should weigh in favour of the EUR/CHF. Support can be found at 1.0624 (24/06/2016 low).