Sample Category Title
Germany’s Joint Economic Forecast Project Group raised 2018 and 2019 growth projections
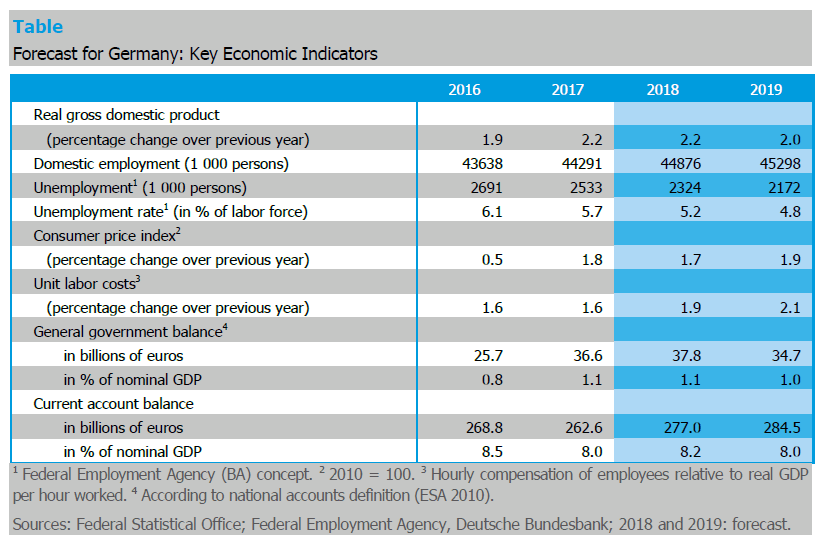
In the twice a year published Joint Economic Forecast by leading German institutes, growth projection for 2018 and 2019 were raised to 2.2% and 2.0% respectively. Both were upwardly revised by 0.2% from Autumn report. The released warned that while German economy "continues to boom", "the air is getting thinner". Still, "pace of economic expansion nevertheless remains brisk:" It pointed to upturn in the world economy, favorable situation in labor market and fiscal stimulus of the new coalition government as driving forces. Inflation is projected to slow to 1.7% in 2018 then rise again to 1.9% in 2019.
 Global growth projection was revised up by 0.3% to 3.4% in 2018. The reported noted that "tax cuts in the USA will stimulate economic activity there, which may have a knock-on effect on other countries". However, it also warned that the dynamic in the world economy will "gradually flatten off over the forecasting period". And that's partly due to "a harsher trade policy climate, which will burden global investments.".
The report also pointed directly to the US announcement of steel and aluminum tariffs as "another step towards greater protectionism". It warned that "any further escalation of the trade conflict will restrict international trade in goods and significantly damage world economic growth in the mid-term." Even "mere discussion of such measures can increase uncertainty over a country's future trade policy and weaken economic sentiment".
A summary of the report can be found here. Or more details here.
Members of the Joint Economic Forecast Project Group
Deutsches Institut für Wirtschaftsforschung e.V. [www.diw.de]
in co-operation with:
The Austrian Institute of Economic Research WIFO [www.wifo.ac.at]
ifo Institute – Leibniz Institute for Economic Research at the University of Munich[www.ifo.de]
in co-operation with:
Swiss Institute of Business Cycle Research (KOF), ETH Zurich [www.kof.ethz.ch]
Institut für Weltwirtschaft an der Universität Kiel [www.ifw-kiel.de]
Halle Institute for Economic Research (IWH) [www.iwh-halle.de]
RWI – Leibniz-Institut für Wirtschaftsforschung [www.rwi-essen.de]
in co-operation with:
Institute for Advanced Studies, Vienna [www.ihs.ac.at]
EUR/GBP Heading Higher
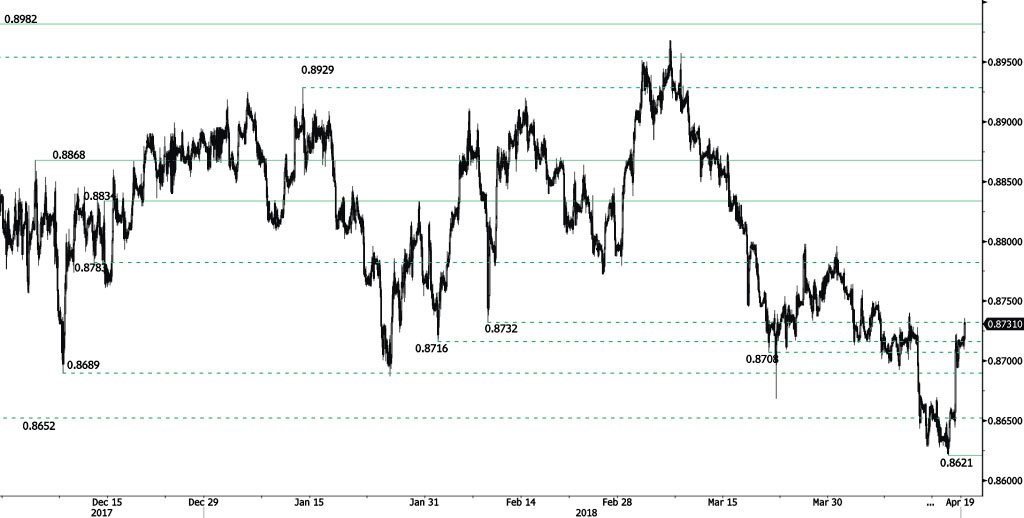
EUR/GBP bullish momentum started from 0.8644 continues, trading at 0.8721 and heading along the 0.8730 range. EUR/GBP bearish pattern started in March is somewhat weakened. Hourly support and resistance are given at 0.8621 (17/04/2018 low) and 0.8834 (14/12/2018 high). The technical structure suggests further short-term increase.
In the long-term, the pair has largely recovered from 2015 lows. The technical structure suggests further upside pressure. Strong resistance can be found at 0.9500 (psychological level) while support remains at 0.8304 (05/12/2016 low). The pair is trading below its 200 DMA.
AUD/USD Approaching 0.78
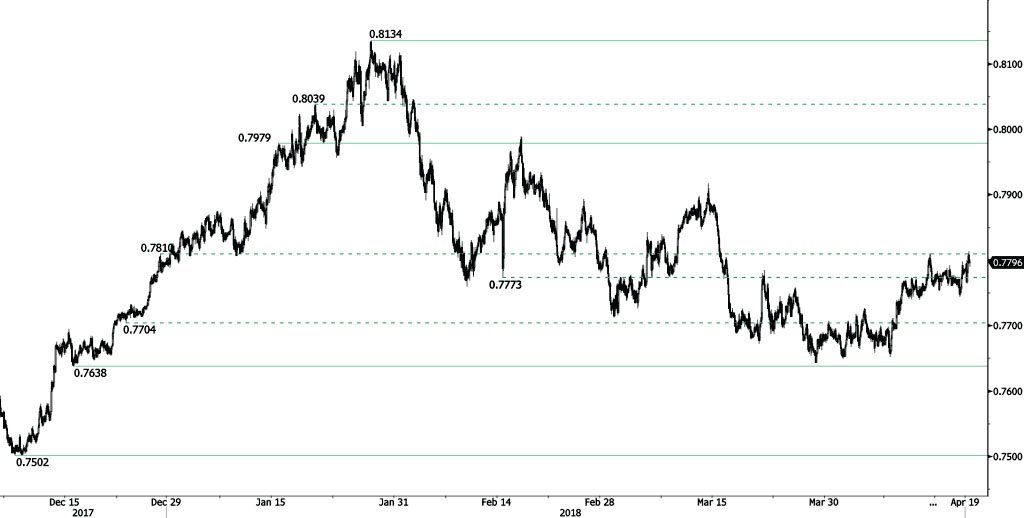
AUD/USD short-term momentum starts back, breaking resistance at 0.7810 (28/12/2018) and heading along the 0.7815 range. Hourly support and resistance are now at 0.7638 (15/12/2017 low) and 0.7979 (15/01/2018 high) remain. The technical structure suggests short-term upward moves.
In the long-term, the upward trend slows down after failing to reach key resistance at 0.8164 (14/05/2015 low). Key support stands at 0.6009 (31/10/2008 low). A break of the key resistance at 0.8164 (14/05/2015 high) is needed to invalidate our long-term bearish view.
USD/CAD Slight Decline
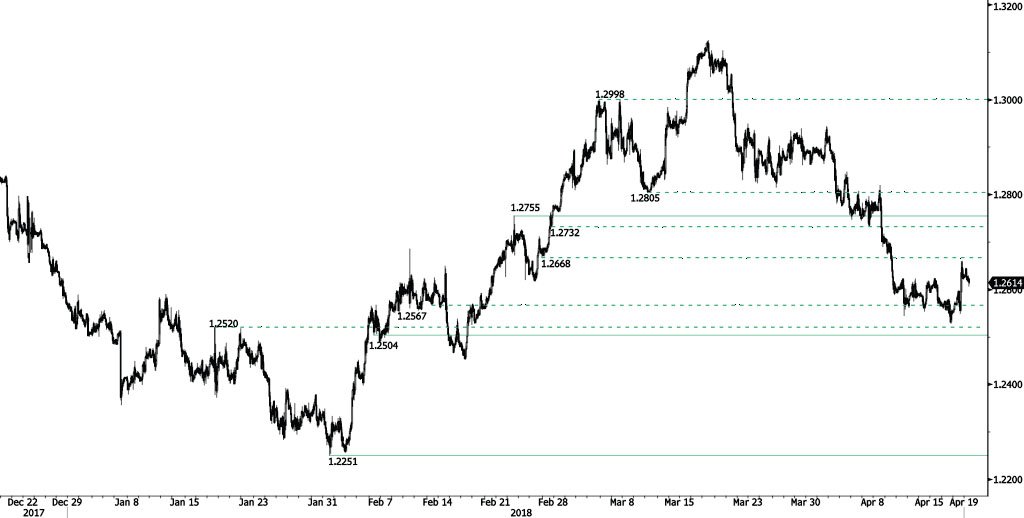
USD/CAD recovery phase from 1.2528 low pauses, slightly declining and heading along the 1.2610 range. Hourly support and resistance are given at 1.2504 (06/02/2018 low) and 1.2755 (22/02/2018 high). The short-term technical structure suggests short-term decrease.
In the longer term, the pair is trading between resistance point at 1.3805 (05/05/2017 high) and support at 1.2128 (18/06/2015 low). Strong resistance is given at 1.4690 (22/01/2016 high). The pair is likely to head lower. The pair is trading at its 200 DMA.
USD/CHF Maintained Within Upward Trend Channel
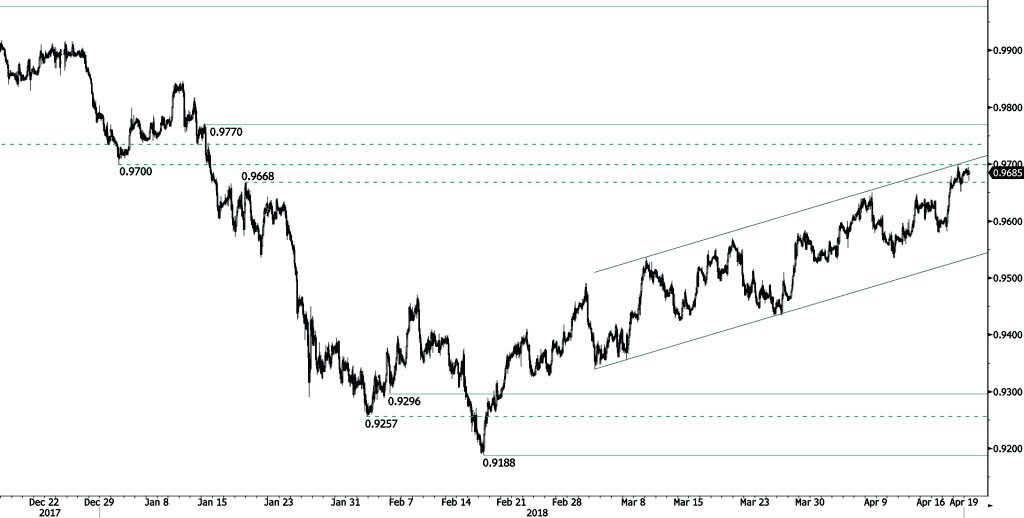
USD/CHF rise momentarily stops, near the 0.97 range. The bullish pattern started from 0.9188 (16/02/2018 low) continues. The pair is contained between hourly support and resistance given at 0.9296 (05/02/2018 low) and 0.9770 (12/01/2018 high). The technical structure suggests shortterm sideways trading moves.
In the long-term, the pair is still trading in range since 2011 despite some turmoil when the SNB unpegged the CHF. Key support lies at 0.9072 (07/05/2015 low) while resistance at 1.0344 (15/12/2016 high) is distanced. The technical structure favours a long term bullish bias since the unpeg in January 2015.
EUR/CHF Tests 1.20, UK Inflation Decelerates
EUR/CHF testing 1.20
The euro has finally made its way back to the infamous 1.20 level against the Swiss franc. EUR/CHF traded as high as 1.1995 on Thursday morning but was unable to break the 1.20 resistance to the upside as traders wonder whether the market is ready to accept finally a weaker Swiss franc.
The Swiss currency retains a negative momentum since early March: on a trade-weighted basis, the franc fell more than 3.75% to its lowest level since January 15, 2015. Over the same period, the Swissie lost ground against all its G10: 4% against the euro, 2.55% against the greenback and 2% against the Japanese yen. What could explain such a move, especially against the backdrop of rising geopolitical tensions?
There are several reasons for this market movement. In recent days, the announcements of US sanctions against Russia have often been cited as a cause of the broad decline of the Swiss franc. Although they can explain part of this movement, especially in the last few days, it is too recent to explain the whole move.
We can also exclude without hesitation any intervention by the SNB on the foreign exchange market. Banks' sight deposits with the central bank have remained stable since the summer of 2017 - at around 575 billion - which clearly indicates that the monetary institution has remained on the sidelines.
A general strengthening of the euro could reasonably explain this trend – on a trade-weighted basis, the single currency rose 1% since February 28 – however, once again, it is not enough. On the economic front, inflation expectations in the euro area have remained relatively stable since the beginning of the year, as have expectations regarding the monetary tightening process of the ECB.
However, it would seem that divergences in monetary policies, as well as the acceleration of global growth, particularly in the euro zone, could very well explain this depreciation of the Swiss franc, as investors do not feel the need to seek to take shelter anymore. Indeed, the Swiss national bank has not yet mentioned any rate hike - which would go against its objective of keeping the Swiss franc at a sustainable level for the Swiss economy - while the ECB and the Fed are already much more advanced in this process. The SNB will never tighten its monetary conditions until it is ensured that this will not negatively impact EUR/CHF.
EUR/CHF should pass the 1.20 mark anytime. This level, however, remains a key resistance and won’t be easy to break. It may take time before seeing EUR/CHF taking off towards 1.30. However, conditional on the ECB maintaining the course of monetary policy tightening and the growth outlook in the eurozone and in the US not deteriorating, the euro could reasonably reach 1.30 at the end of the year.
UK inflation surprises to the downside
After reaching 3.10% in November 2017, UK inflation is giving signs of further slack, a rather positive sign for UK households who benefit from an increasing purchasing power. Published at 2.50% by the office for national statistics, March consumer price index slows down at a stronger pace than expected, given at one-year low. Essentially supported by a decline in clothing, alcoholic beverage and furniture prices, it appears that the inflation pattern is reversing amid continued negative-oriented producer price index numbers (-0.10%). The strong pound recovery started in January 2017 following June 2016 Brexit vote is also a large contributor to that effect due to significant decline in the cost of imported goods within the UK.
Since investors are expecting the Bank of England monetary policy decision to rise its key rate by 25 basis points (fully priced-in scenario) to 0.75% as part of its normalization policy meeting in May 10th, we remain subdued as to the potential of further increase in interest rate for the current year. The scenario of a second hike in November continues to weaken as inflation rapidly approaches the 2% target set by monetary authorities and Brexit negotiation uncertainties softens. Accordingly, we would retain the scenario of continued inflation deceleration amid increasing wage growth and increasing consumer spending for the months to come.
Approaching its ex ante level before Brexit event, the GBP/USD pair is quoted at 2 years high, currently trading at 1.4194, slightly declining and approaching the 1.4185 range in the short-term.
USD/JPY Continued Increase
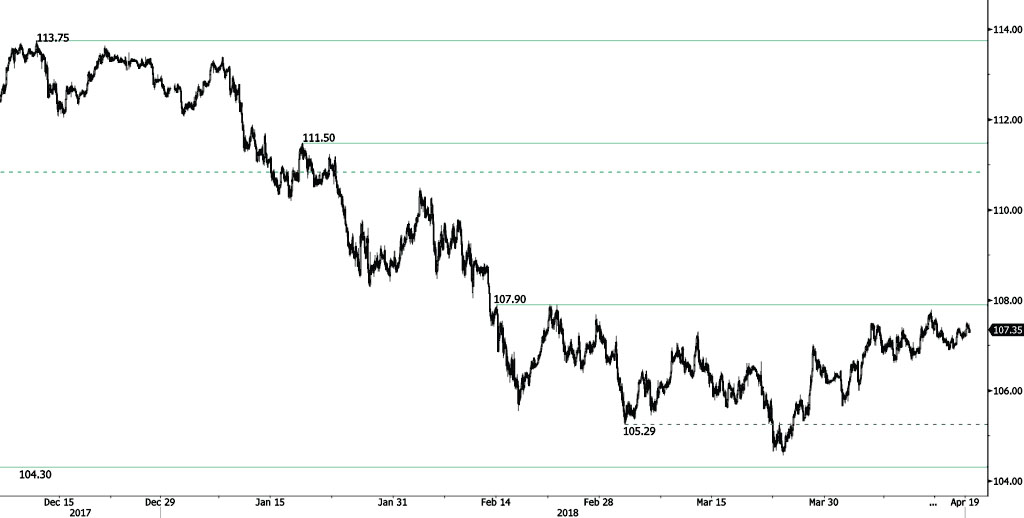
USD/JPY bounce from 106.90 low continues, approaching the 107.50 range. The bearish pattern started in January 2018 is somewhat weakening. The short-term technical structure suggests continued short-term upward moves.
We favor a long-term bearish bias. Support remains at 101.20 (09/11/2016 low). A gradual rise toward the major resistance at 125.86 (05/06/2015 high) seems unlikely. Expected to decline further support at 101.20 (09/11/2016 low). The pair trades below its 200 DMA.
GBP/USD Continued Bearish Move
GBP/USD strong decline from 1.4377 high continues, trading at end March high and heading along the 1.4160 range. Hourly support and resistance are given at 1.3451 (23/02/2018 low) and 1.5018 (24/06/2016 high). The technical structure suggests further short-term decline.
The long-term technical pattern is reversing. The Brexit vote had paved the way for further decline but the pair is moving to 2016 highs. Long-term support and resistance are given at 1.1841 (07/10/2017 low) and 1.5018 (24/06/2016 high).

EUR/USD Further Sideways Trading
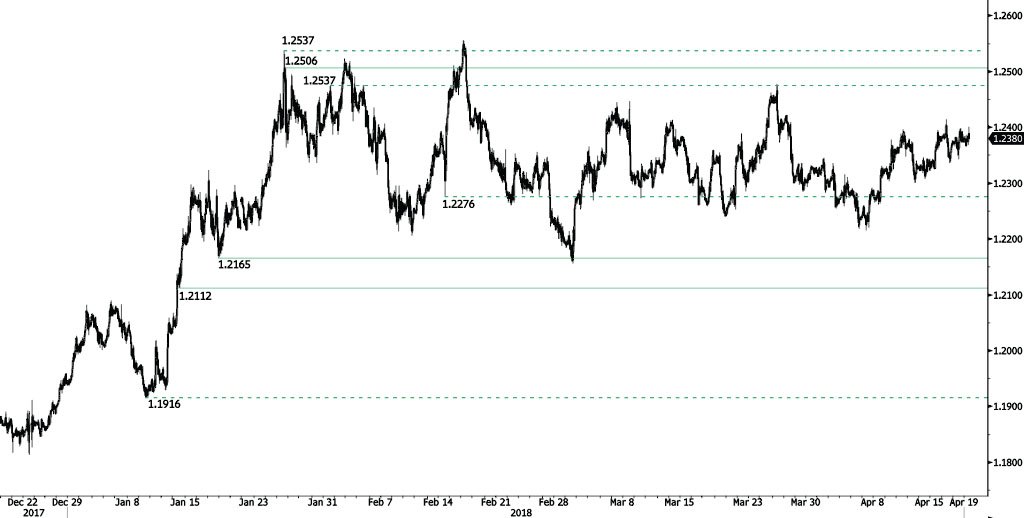
EUR/USD sideways trading continues at the 1.2370 range. The pair is currently maintained between hourly support and resistance given at 1.2165 (17/01/2018 low) and 1.2506 (25/01/2018 high). The technical structure suggests further short-term sideways trading moves.
In the longer term, the momentum is turning largely positive. We favor a continued bullish bias. Key resistance is holding at 1.2886 (15/10/2014 high) while strong support lies at 1.1554 (08/11/2017 low).
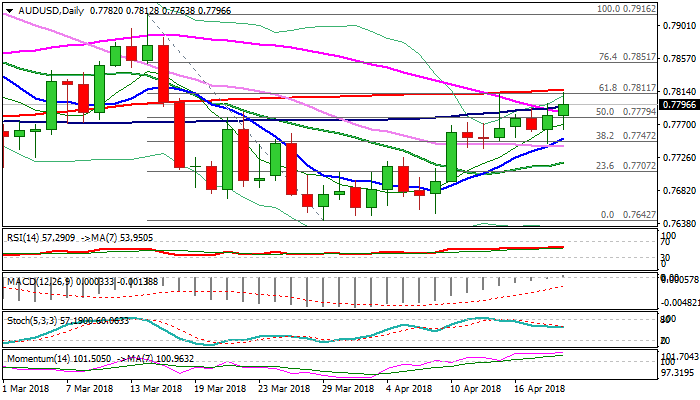
AUDUSD – 200SMA Continues To Cap
The Aussie dollar maintains positive tone on Thursday and retested strong barrier at 0.7815 (200SMA) but was so far unable to break higher.
The second rejection confirms that 200SMA is strong resistance and the pair may struggle further in attempts to break above.
Near-term action is also weighed by thickening daily cloud (cloud base lies at 0.7835) and multiple rejections at 200SMA could signal recovery stall.
Downbeat Australian jobs data in March when 4.9K new jobs were created vs 20.3K forecast, add to negative impact on near-term bulls off 0.7640 base.
Eventual break through 200SMA and penetration of daily cloud would generate stronger bullish signal for recovery extension.
Conversely, repeated close under 200SMA would signal extended sideways mode between 30/200SMA’s (0.7740/0.7815), while close below 30SMA would generate negative signal.
Res: 0.7815, 0.7835, 0.7851, 0.7900
Sup: 0.7764, 0.7751, 0.7740, 0.7720