Sample Category Title
Yen and Franc Ended as the Weakest Ones as Risk Aversion Temporarily Eased, Reaction to Syria Strikes Watched
Easing risk aversion was the main theme last week as Japanese Yen and Swiss Franc ended as the weakest two. It's not the kind that investors were in euphoria. But nonetheless, major stock indices around the world ended up higher. Dollar ended as the third weakest despite markets firming up pricing for June and September Fed hike. Euro followed as the fourth weakest as cautious ECB meeting accounts disappointed Euro bulls. On the other hand, commodity currencies ended as the strongest ones, led by Canadian Dollar, which was additionally supported by surge in oil price on Syria tension. Australian Dollar and New Zealand Dollar ended as the second and third strongest, followed by British Pound.
We'd like to emphasize it's just that risk aversion eased, but not return of risk appetite. Overall, we sensed a lot of nervousness in the markets. It's kind of strange feelings that it looked that the markets were about to breakdown, but every time there was a certain turn and everyone was relieved. Anyway, Chinese President Xi Jinping's speech at the Boao Forum for Asia was welcomed as there was at least no escalation in trade tension between China and US. That was also followed by outlines of some reforms to open up the Chinese markets to foreign investments quicker. But the problem was not solved yet. And there were rumors that US will come back with the details of tariffs of additional USD 100b of Chinese products, as soon as this week.
Also, US, UK and Franc finally launched attack in Syria in retaliation for a chemical weapon attack outside Damascus by Bashar al-Assad's regime late Friday, early Saturday. It's a "one-time shot" according to US Defence Secretary Jim Mattis. For now, we don't know how the markets are going to to react to this on Monday. At the same time, the strike also triggered furious response from Russia. Anatoly Antonov, Russia's ambassador to the US responded by writing on Facebook that "Our worst apprehensions have come true. Our warnings have been left unheard." And, "we warned that such actions will not be left without consequences." He also condemned that "insulting the President of Russia is unacceptable and inadmissible" apparently referring to US President Donald Trump's mention of Russian President Vladimir Putin is his speech.
Technically speaking, the rebound in US equities were corrective looking. European indices were also held below near term resistance. The markets were clearly not out of the woods yet. Reactions to the Syria strike and developments in US-China trade tensions would be important for the market this week.
Rebound in global equites was corrective in nature, more risks ahead
Take DOW as an example, it hit as high as 24646.45 last week but closed at 24360.14, up the week by 427 pts. But DOW clearly cannot stay above 24622.24 near term resistance, 55 day EMA at 24566.07, or trend line resistance at around 24665. Price actions from 23344.52 were also corrective looking. We'd still expect another fall through 23344.52 to extend the correction from 26616.71.
 Similar, S&P 500 closed the week up 51.83 pts at 2656.30. But it failed to take out 55 day EMA at 2681.97. And rebound from 2553.80 is corrective looking too.
 It's the same for NASDAQ. It's closed up 191.5 pts at 7106.65. It failed to stay above 55 EMA at 7154.12. And recovery from 6805.96 is corrective looking.
 European indices looked a little bit better. But still, DAX will need to overcome 12601.46 resistance to confirm near term reversal.
 FTSE also has to take out 7326.02 resistance to confirm near term reversal too.
Market pricing 100% chance of June Fed hike, but dolllar got no lift
With March core CPI accelerated to 2.1% yoy, and after comments from Fed officials as well as FOMC minutes, markets are firming up their expectation on June Fed hike. Fed fund futures are now pricing in 100% chance of 25bps hike to 1.75-2.00%.
 For September, Fed fund futures are also pricing in 70.4% chance of another hike to 2.00-2.25%. That's notably higher than prior week's pricing of 54%.
 But Dollar is getting no support from Fed expectations with dollar index continued to struggle in established range. We'd maintain out view that as it's getting close to medium term trend like resistance. A breakout is likely imminent. Only that it "could be very soon or not so soon at all!" Break of 88.25 will pave the way to 61.8% retracement of 72.69 to 130.82 at 84.58. We maintain the view that fall from 103.82 is a corrective move. And strong support is expected from 84.58/75 to contain downside and bring sustainable rebound finally.
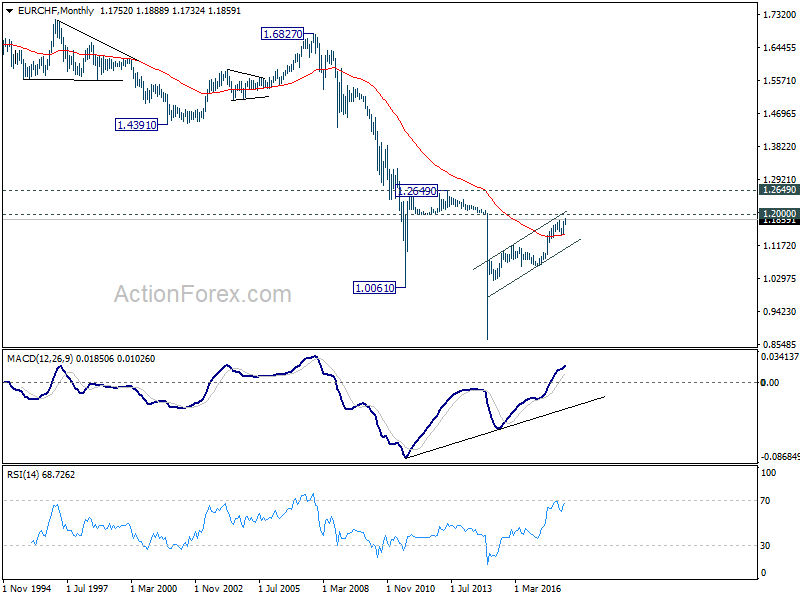
EUR/CHF Weekly Outlook
EUR/CHF rose to as high as 1.1888 last week and finally resumed medium term up trend. As a temporary top is in place, initial bias is neutral this week first for some consolidations. But downside of retreat should be contained by 1.1748 minor support to bring another rally. Above 1.1888 will target 1.2 handle, and then 61.8% projection of 1.0629 to 1.1832 from 1.1445 at 1.2188.
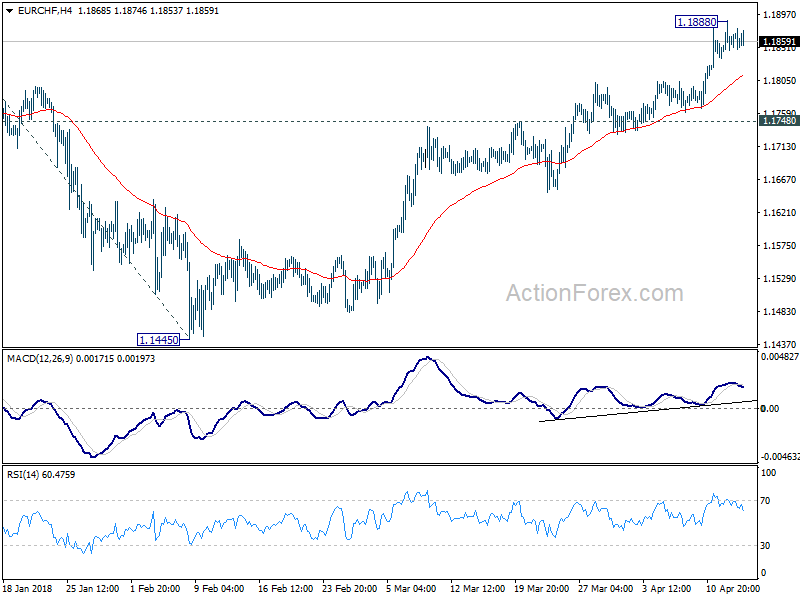
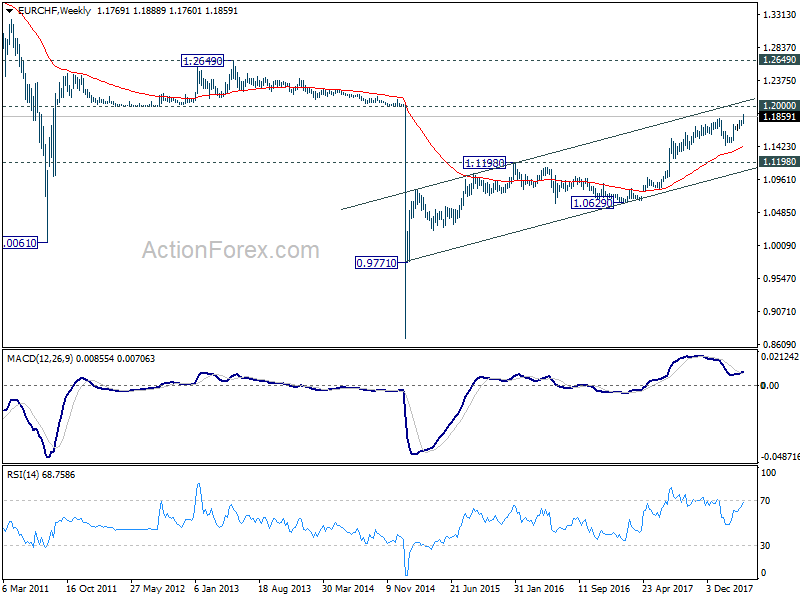
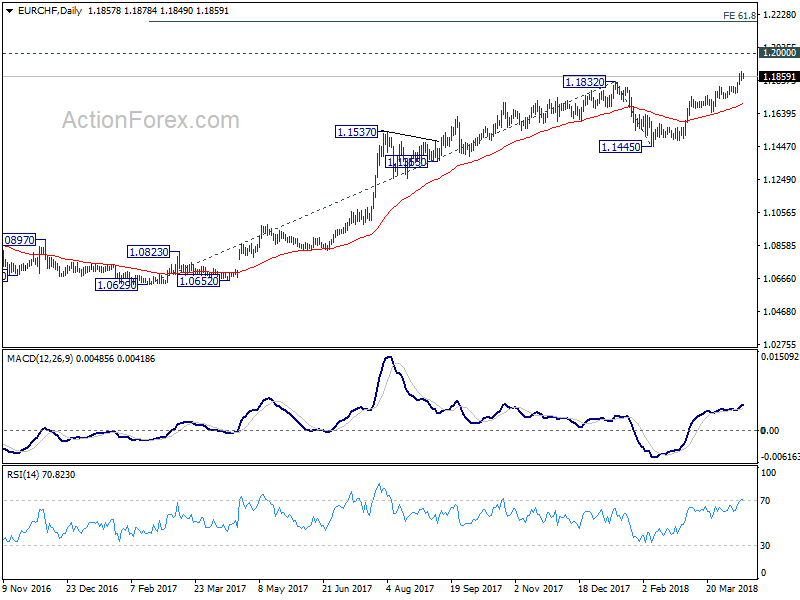 In the bigger picture, decisive break of 1.1832 should now extend the medium term up trend through prior SNB imposed floor at 1.2000. 2013 high at 1.2649 should be the next target. Outlook will remain bullish as long as 1.1445 support holds, even in case of deep pull back.
US, UK, France struck Assad’s chemical weapons facilities in one-time shot
US, UK and France launched attack in Syria in retaliation for a chemical weapon attack outside Damascus by Bashar al-Assad's regime. US Defence Secretary Jim Mattis said more than 100 missiles were fired, and struck three of Syria's main chemical weapons facilities. Mattis also said that is a "one-time shot" to send a "very strong message" to Assad to "dissuade him, to deter him". And no attack is planned for now. Russia's Defence Ministry said the majority of missiles fired were intercepted by Syrian government air defence systems.
Anatoly Antonov, Russia's ambassador to the US responded by writing on Facebook that "Our worst apprehensions have come true. Our warnings have been left unheard." And, "we warned that such actions will not be left without consequences." He also condemned that "insulting the President of Russia is unacceptable and inadmissible" apparently referring to US President Donald Trump's mention of Russian President Vladimir Putin is his speech.
In Trump's televised speech, he said "in 2013 President Putin and his government promised the world that they would guarantee the elimination of Syria's chemical weapons. Assad's recent attack and today's response are the direct result of Russia's failure to keep that promise. Russia must decide if it will continue down this dark path, or if it will join with civilized nations as a force for stability and peace."
Summary 4/16 – 4/20
Monday, Apr 16, 2018
[php_everywhere instance="1"]
Tuesday, Apr 17, 2018
[php_everywhere instance="2"]
Wednesday, Apr 18, 2018
[php_everywhere instance="3"]
Thursday, Apr 19, 2018
[php_everywhere instance="4"]
Friday, Apr 20, 2018
[php_everywhere instance="5"]
Weekly Economic and Financial Commentary: Firming Inflation Favors June Rate Hike
U.S. Review
Firming Inflation Favors June Rate Hike
- Market participants were greeted this week with three unique inflation indicators. Looking beyond the headline figures, the releases reveal broad-based price firming in the economy.
- Core CPI has increased at a 2.9 percent annual rate over the past three months – core services strengthened 0.3 percent on the month led by a rebound in shelter costs.
- Producer prices are up 3.0 percent year over year, further supporting the narrative of firming prices across the economy. Strengthening prices support a June rate hike.
Inflation Measures Dominate Data Wire
Market participants this week eagerly awaited the release of three carefully watched inflation metrics: the producer price index, the consumer price index and the import price index. Observers who were hoping for signs of firming inflation were not disappointed. The inflation celebration, albeit a restrained one, was kicked off on Tuesday with the release of March's producer price index (PPI), which rose 0.3 percent ahead of expectations for a 0.1 percent gain. Besides the energy component, all major sub-sectors saw prices rise last month. Moreover, this now marks the third straight month that the PPI for services advanced upward. Our preferred measure of core PPI rose 0.4 percent and points to the underlying trend in inflation continuing to strengthen.
Perhaps the most highly anticipated economic indicator this week was released on Wednesday morning–the consumer price index (CPI) report for March. Although the headline figure fell 0.1 percent, the decline can be entirely traced to energy, where prices fell 2.8 percent. Elsewhere, however, price gains were stronger and point to firming inflation. After what had been the strongest three-month run in 10 years, the core index increased an impressive 0.2 percent. Core services strengthened 0.3 percent, led by a rebound in shelter costs. Prices for medical services also strengthened notably, up 0.5 percent, after being flat last month.
It was this time last year that core inflation posted a surprising decline due to the now-infamous drop in wireless services. The index fell 0.1 percent – a rare event outside of a recession. With the drop now a full year behind us, the 12-month rate of core inflation jumped to 2.1 percent from 1.8 percent. Even through the 12-month change has been helped by an easy base comparison, we believe there is more strength to come even without such a favorable base effect over the next few months. Core CPI has increased at a 2.9 percent annual rate over the past three months, and we look for the core index to increase 2.2 percent year-overyear in the second quarter. The third inflation metric, the import price index, was generally flat on the month in an otherwise pricefirming environment. Fuel imports fell for the second month in a row, but are still up over the year. Despite the soft headline figure, ex-petroleum import prices rose 0.1 percent on the month.
Recent months have witnessed a heightened level of anxiety surrounding a potential trade war with China. Fiery rhetoric from various figures have spooked markets and raised fears of heightened import prices as a result of tariffs. However, import inflation brought on by a possible trade war would likely be seen as transitory by the Fed. Furthermore, the Fed's main focus is with consumer price inflation. FOMC Chair Powell and other members are certainly aware of the aforementioned favorable arithmetic surrounding the year-ago rate of core inflation, so the jump witnessed in March is unlikely to alter their overall view of inflation. What we believe is likely to be more influential in the Fed's thinking is the overall strength that has prevailed since late last year, as well as broadening indications of higher input costs for labor and raw materials.
U.S. Outlook
Retail Sales • Monday
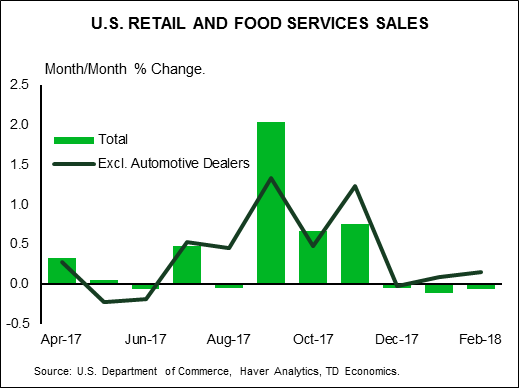
Retail sales have gotten off to a slow start in 2018, falling 0.1 percent in January and February. The sectors that were the biggest drags on retail sales in February were motor vehicle & parts dealers' sales, furniture & home furnishing sales and electronics & appliance store sales. Gasoline stations' sales also declined in February, by 1.2 percent, despite higher gasoline prices in the month. Sectors that showed positive growth included sporting goods, hobby, book & music stores' sales, building material sales and clothing & clothing accessories sales.
The first two retail sales reports of 2018 indicate that consumption may have slowed during the first quarter of the year. Control group sales, which go directly into GDP calculations, were flat in January and below consensus in February. Despite the weakness during the first two months, we remain positive on the consumer this year, with accelerating inflation posing the greatest downside risk.
Previous: -0.1% Wells Fargo: 0.3% Consensus: 0.4% (Month-over-Month)
 Housing Starts • Tuesday
A dramatic drop in multifamily starts of 26.1 percent in February pulled the headline reading down to a 7.0 percent drop on the month. This masked a 2.9 percent gain in single-family housing starts, as new home construction gains momentum. This solid gain followed a 3.5 percent gain in January. The South and West have contributed the vast majority of single-family starts, accounting for 77 percent of the nation's total in 2017. Unseasonably mild winter weather in these regions to start the year has boosted starts, while the Midwest and Northeast have lagged due to harsher winter conditions.
The housing recovery has been sluggish, as shortages of lots and workers have held back starts. Higher building material prices have also made it more difficult to build entry-level homes as profit margins are crimped. However, momentum seems to be building over the past year and we look for the pace of housing starts to continue to trend higher.
Previous: 1,236K Wells Fargo: 1,268K Consensus: 1,269K
 Industrial Production • Tuesday
Industrial production surged 0.9 percent in February, finally indicating a convergence between output and strong soft data readings in the manufacturing sector. All major categories increased in the month, with motor vehicles and parts gaining roughly 4.0 percent. For months, hard data have lagged behind survey measures such as small business confidence, purchasing manager surveys and the ISM survey. This month's report is an encouraging development for industrial production.
Mining output jumped 3.5 percent in February, which is the largest increase in almost 10 years. Utilities, on the other hand, declined 4.9 percent as a warm February weighed on demand. This surge in industrial production pushed up capacity utilization. Manufacturing utilization is currently at a cycle-high at 75.9 percent. While this utilization is still below the high of the prior cycle, it is above the 20-year average of 75.5 percent.
Previous: 0.9% Wells Fargo: 0.3% Consensus: 0.3% (Month-over-Month)
Global Review
Is Global Economic Growth Slowing?
- Industrial production in the euro area fell for the second consecutive month in February, which means that IP likely contracted in Q1. Although weather likely played a role in depressing IP in the first quarter, the acceleration phase of the current cycle in the euro area has likely passed.
- IP in the United Kingdom only edged higher in February, and a widely respected British think tank estimates that overall real GDP growth in the first quarter was weak. Although we are not forecasting a recession, we look for British growth to remain underwhelming throughout most of this year.
Is Global Economic Growth Slowing?
After a lackluster 2016, global economic activity accelerated in 2017. Not only did growth in global industrial production (IP) strengthen last year but so too did growth in global trade volumes (see graph on front page). However, as discussed in our "Monthly Economic Outlook", we estimate that the sequential rate of real GDP growth in the United States downshifted markedly in the first quarter. Incoming data similarly indicate that GDP growth in some other major economies slowed as well in Q1.
Let us start in the Eurozone where IP slumped 0.8 percent in February following the 0.6 percent drop that was registered in January. Unless IP rebounded 2.1 percent or more in March, which seems like a tall order, it will have contracted in Q1-2018. Some of the weakness in IP in February reflects unusually cold weather, and IP remains up nearly 3 percent relative to last year (top chart).
Although we estimate that real GDP growth in the first quarter was positive—output in the service sector, which accounts for the lion's share of value added, likely remained resilient—the Eurozone is unlikely to match the 0.6 percent (not annualized) GDP growth rate that it churned out in Q4-2017. Indeed, we believe the acceleration phase of the current cycle in the euro area has now passed. We are not saying that the Eurozone is slipping back into recession. We are just saying that real GDP growth will slow back to a more "normal" rate. In that regard, real GDP in the euro area was up 2.7 percent in Q4-2017, the strongest year-over-year growth rate in more than six years. We forecast that it will slow to 2 percent by the end of 2018 (middle chart).
Real GDP growth in the United Kingdom also appears to have been muted in the first quarter. For starters, IP edged up only 0.1 percent in February as production in the manufacturing sector fell for the first time in 11 months. (Strength in utilities, which reflects the unusually cold weather noted above, kept overall IP growth in positive territory.) Meanwhile, output in the construction sector tumbled 1.6 percent in February, which followed on the heels of the 3.1 percent decline registered during the previous month.
A widely respected think tank, National Institute of Economic & Social Research (NIESR) announced this week that it estimates that British real GDP grew only 0.2 percent (not annualized) in the first quarter. If confirmed by official data that will be released later this month, it would represent a marked slowdown from the 0.4 percent sequential rate that real GDP grew in Q4-2017.
We are not as pessimistic as the NIESR about the U.K.'s growth performance in Q1, although we do acknowledge some downside risk to our current estimate of 0.5 percent sequential growth. Uncertainty related to Brexit appears to have constrained real GDP growth in the United Kingdom in recent quarters, and we look for British growth to remain underwhelming throughout most of this year (bottom chart).
Global Outlook
China GDP • Tuesday
The Bloomberg consensus once again expects Chinese GDP growth to print at 6.8 percent year over year for Q1-2018. If realized, this would mark the third consecutive reading of 6.8 percent and the 11th consecutive quarter economic growth has been +/- 0.1 percentage point from 6.8 percent. Based off of monthly data available through February, it appears a pick-up in industrial output and investment spending relative to Q4 helped offset some modest cooling in personal consumption. It will be interesting to see what kind of momentum Chinese international trade had in Q1 at the onset of the recent trade flare-up between China and the United States.
Despite steady growth in Q1, our expectation is that Chinese real GDP growth will continue to gradually slow over the coming quarters amid an aging population, decelerating investment and deleveraging efforts. We look for real GDP growth of 6.3 percent in China in 2018 before slowing further to 6.0 percent in 2019.
Previous: 6.8% Wells Fargo: 6.6% Consensus: 6.8% (Year-over-Year)
U.K. Consumer Price Index • Wednesday
A slew of important data on the United Kingdom economy are reported next week. Data on U.K. employment and earnings print next Tuesday, followed by the CPI on Wednesday and retail sales on Thursday. Inflation continues to be key to the outlook for the Bank of England, as the United Kingdom is one of the few advanced countries where inflation is currently running well above the central bank's target. Recently, inflation has shown signs of turning over as the effect from the pound's sharp depreciation following Brexit has gradually begun to fade.
Accelerating prices and stagnant nominal wage growth drove a deceleration in real wages that has recently shown some nascent signs of reversing. Retail sales volumes declined in December and January but rebounded in February, and next week's data for March will show if U.K. consumers carried that momentum into the end of the first quarter.
Previous: 2.7% Wells Fargo: 2.6% Consensus: 2.7% (Year-over-Year)
Japan CPI • Thursday
Economic conditions in Japan have clearly firmed over the past few quarters. Japan has registered its longest period of uninterrupted growth since the 1986 expansion, and headline and core inflation have risen from recent lows. This improvement, coupled with gradually tightening monetary policy elsewhere in the advanced world, has led some to start questioning when the Bank of Japan (BoJ) might start the process of unwinding its extraordinary easing.
BoJ Governor Haruhiko Kuroda noted at a news conference this week that the BoJ will "need to eventually consider kicking off a process towards policy normalization." For now, however, inflation remains well short of the BoJ's 2 percent target, as it has for much of the past two decades. Given the structural economic challenges in Japan and the continued gulf between realized inflation and the 2 percent target, we expect the BoJ to remain committed to its current monetary policy stance for the foreseeable future.
Previous: 1.5% Wells Fargo: 1.2% Consensus: 1.1% (Year-over-Year)
Point of View
Interest Rate Watch
Rising Inflation, Flatter Yield Curve
One of the interesting developments in the credit market is the expectation of rising inflation in the future, yet a lower risk premium to cover higher prices. Breakevens for the 10-year Treasury have risen since early 2016 and even more so since the start of this year (top graph). This breakeven represents the spread between the nominal interest rate and the real interest rate. Meanwhile, the TIPS yield (also top graph) has risen even more since mid-2016, with a spike in early 2018. This would reflect a market expectation for a rising real yield. The breakeven and TIPS yields would support the case for a higher 1o-year rate going forward. Our outlook is for a continued rise in the 10-year rate for 2018 and into 2019.
Inflation Outlook: Next Five Years
Looking further ahead, the Fed's five-year forward breakeven measure indicates that inflation expectations have risen since mid- 2016 and jumped at election time. Since the start of 2018, this measure of inflation expectations has moved up even more. This is quite a contrast to the decline in this series from January 2014 to mid-2016.
Yet a Flatter Yield Curve
As illustrated in the bottom graph, the yield curve, shown by the 10Y/2y and 10y/5Y spreads, has flattened since early 2014. This would appear unusual given that inflation expectations, measured by breakevens and five-year forwards, have actually risen, along with the TIPS measure of real yield. Moreover, recent reports from the Congressional Budget Office project a higher budget deficit going forward, which should also likely boost net Treasury issuance in the coming quarters. How do we reconcile these conflicting factors?
Our outlook is that the FOMC's path to higher short-term rates would push the twoyear yield to 2.90 percent by the end of this year, compared to a rise in the 10-year yield to 3.20 percent. The FOMC's moves would more than offset the fundamental factors driving the rise in longer term rates. It also appears that markets are not yet fearing the financing challenge of a larger federal deficit, currently leading short-term rates to rise faster than long-term rates.
 Credit Market Insights
Student Loan Growth Slows
U.S. households held $1.4 trillion in student debt in Q4-2017, 5.2 percent more than a year earlier. This growth rate is the lowest since the New York Fed began recording the series in 2004. Consistently high growth rates over the past decade, however, mean that the volume of student debt remains more than double its level in 2008.
Student debt has registered some of the fastest growth rates of all types of debt in this expansion; student loan balances grew consistently above 10 percent a year in 2009-2014, even as households reduced mortgage, auto and credit card debt postrecession. Student debt made up less than 4 percent of household debt in 2005, but the share has since ballooned to 10.5 percent.
The growth rate of student debt has moderated recently, falling by roughly half over the past 2 years. Contributing to slower student loan growth is a shrinking collegeage population—the number of 20-24 year olds fell 300,000 (1.4 percent) in 2016, after declining for the first time since 1996 in 2015. Student loan originations are also down in each of the past two years.
While the number of new borrowers is shrinking, many existing borrowers are still struggling to pay back their loans. At 11 percent, the delinquency rate on student loans is the highest of all debt categories, and has stayed about constant since 2012 despite gains in household incomes and wealth. Student loans make up about 30 percent of all new seriously delinquent loans (90 or more days late).
Topic of the Week
Sizing Up the Budget and Economic Outlook
The Congressional Budget Office (CBO) released its 10-year Budget and Economic outlook earlier this week. The report was more highly anticipated than usual as CBO's last update occurred in June 2017, before the tax cut and spending bills were enacted into law. In short, yesterday's release showed large upward revisions to economic growth and the federal budget deficit in the short-run. Over the long-run, CBO continues to expect a deteriorating fiscal outlook and potential GDP growth between 1.75 and 2.0 percent.
Perhaps most surprising was CBO's bullish short-term economic growth estimates. As seen in the top chart, the outlook for this year and next has significantly improved relative to CBO's expectations 14 months ago. CBO anticipates 3.0 percent real GDP growth in 2018 (measured as a year-over-year percentage change of the annual average level) and 2.9 percent in 2019. This contrasts with our expectation for 2.6 percent growth this year and 2.9 percent in 2019. Using the Fed's Q4 over Q4 convention, CBO's forecast for 2018 is not only higher than the FOMC median but would be the highest among the 15 FOMC submissions by 0.3 percentage points.
Regarding the budget deficit, CBO's forecast is roughly in-line with our own. For FY 2018, CBO expects a deficit of $804 billion, slightly larger than our forecast of $775 billion. For FY 2019, CBO looks for a deficit of $981 billion, a bit below our $1.1 trillion forecast. Like ours, CBO's deficit forecast has risen dramatically over the past year even as the outlook for economic growth has improved. CBO now expects the cumulative deficit over 2018-2027 to be $11.7 trillion, up from $9.4 trillion as of last January (bottom chart). If this baseline scenario unfolds, net Treasury issuance over the next decade would nearly double the size of today's roughly $15 trillion Treasury market.
The Weekly Bottom Line: Trade Deals (Not Wars) Back on the Agenda
U.S. Highlights
- Financial markets bounced back from the selloff last week as trade tensions between China and U.S. eased somewhat.
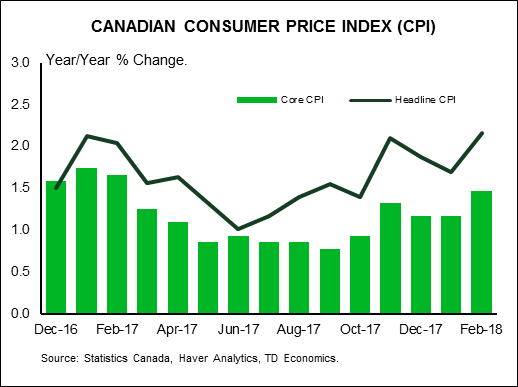
- Both headline and core CPI inflation ticked up in March on a year-on-year basis.
- FOMC March meeting minutes indicate that some members contemplated a faster pace of rate hikes this year. Overall, we believe the balance of risks remains consistent with a total of three rate hikes in 2018.
Canadian Highlights
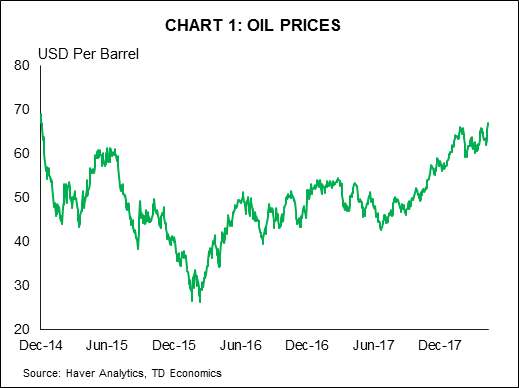
- The WTI benchmark jumped 8% this week to a 3-year high of US$67 per barrel as geopolitical tensions trumped a bearish US storage report.
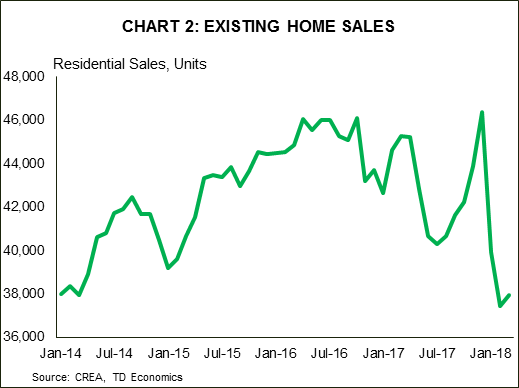
- Housing starts remained strong in March, bringing the 6-month average to 227k units. Existing home sales stabilized during the month, after falling sharply in the prior two. Meanwhile, quality-adjusted home prices rose at the slowest pace in nearly 5 years.
- The Bank of Canada is expected to remain on the sidelines next week, with the Monetary Policy Report providing the Bank’s updated outlook for the Canadian economy.
U.S. - Trade Deals (Not Wars) Back on the Agenda
Politics dominated headlines this week. Financial markets recovered from last week’s selloff, as the fear of a full blown trade war between the U.S. and China receded for at least a few days. However, geopolitical tensions remain elevated as more economic sanctions against Russia took effect and the U.S. administration considers military action against Syria, providing a strong bid on gold and oil.
Although there has been more bark than bite on trade protectionism from the U.S. administration thus far, a hot trade war could do a lot of damage. However, events this week provide some hope that a trade war can be averted. Speaking at the Boao forum for Asia, Chinese President Xi repeated past promises to expand intellectual property protections and open various sectors of China’s economy to foreign investment. Later in the week, word spread that President Trump was directing officials to explore returning to the Trans Pacific Partnership, an agreement that he withdrew from shortly after coming to office.
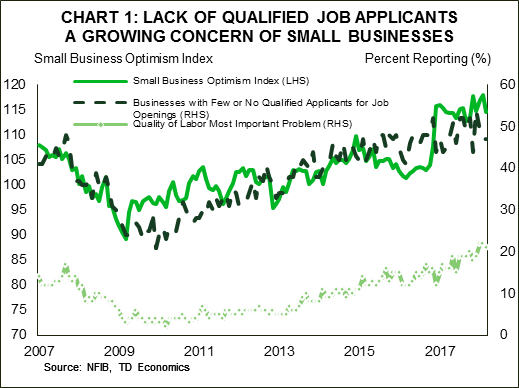
With heightened uncertainty about the future trading relationship between the world’s economic heavyweights, business confidence could start to wane. Small business optimism pulled back in March, but the decline comes after the index reached a 35 year high in February. While a pullback was expected, one cannot rule out that rising trade tensions contributed to the greater-than-anticipated decline. What’s more, the report reinforced the labor market themes we’ve seen from the ISM surveys: rising labor shortages driving up wages as firms act to attract and retain workers (Chart 1).
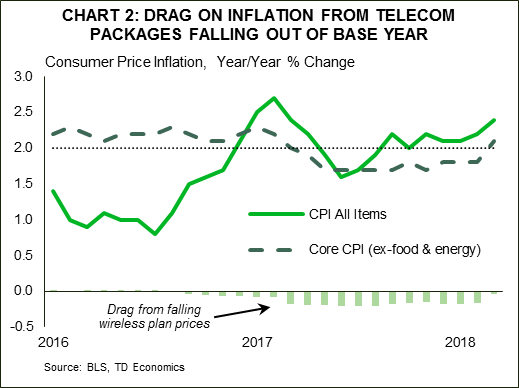
Rising wages and input costs will eventually drive consumer prices higher. For the month of March, consumer prices rose 2.4% (year-on-year), but a more meagre 0.1% monthly change owing to decline in gas prices. Most importantly, core inflation (CPI ex-food and energy) ticked up to 2.1% y/y from 1.8% in the previous month, largely on the back of base-year effects (Chart 2). Still, core inflation rose a healthy 0.2% on the month, suggesting that a hot economy is leading to a broad build-up in price pressures.
Labor shortages, solid wage growth, and rising prices should reassure the Federal Reserve that higher interest rates are warranted. Although there was little new information in the March FOMC meeting minutes released this week, there were still some discussions worth noting. Strong economic growth along with rising price pressures are evidence that the economy is coping well with past rate hikes and can absorb more. In fact, some participants think that a total of four rate hikes may be warranted this year, while also suggesting that the language in the monetary policy statement be changed to reflect a view that interest rates are exerting a more neutral rather than accommodating impact on economic activity. Still, uncertainty about the ultimate impact of fiscal stimulus on output and the downside risks posed by trade protectionism is more consistent with a total of three rate hikes this year.
 Canada - BoC Likely To Sit On The Sidelines Next Week
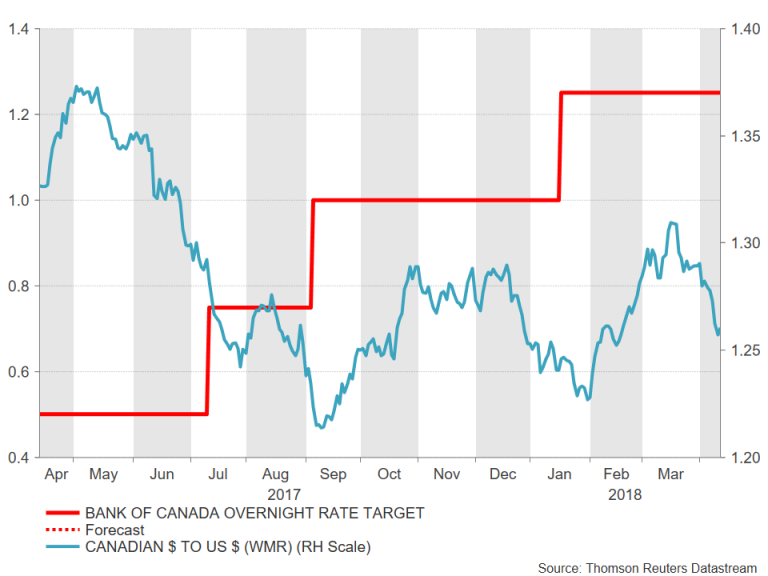
Canadian financial markets were up this week, led by an 8% jump in oil prices that reached a three-year high. This helped to push the loonie above 79 US cents, while the S&P TSX finished the week in slightly positive territory.
The WTI crude oil benchmark surged to over US$67 per barrel, as geopolitical tensions trumped a bearish US storage report. Indeed, comments from President Trump suggesting that Russia should get ready for US missiles to be fired at Syria was the key catalyst driving oil prices higher. Meanwhile, an unexpected build in US inventories and rising oil production stateside was brushed off amid the these threats. While inventories are closing in on OPEC’s target (the 5-year average), current prices still appear to be higher than fundamentals would suggest, with some reversal likely once geopolitical tensions abate. However, should tensions intensify further, or sanctions against Iran be reinstated, prices could gain further ground. Headlines this week suggested that Saudi Arabia is targeting an oil price of US$80 per barrel; that would be a tall order considering the market is not quite balanced and prices at current levels or higher would trigger further growth in output, particularly in the US.
On the data front, housing starts remained strong in March, bringing the six-month average to 227 thousand units – a solid pace of activity, particularly in light of the cooling seen in existing home sales and prices. Data out this morning revealed that existing home sales stabilized in March (+1.3%), follow a steep decline in the prior two months. Meanwhile, quality-adjusted home prices were up 4.6% year-on-year – the slowest pace in over four years. Hence, despite strong homebuilding activity, the drop in sales suggests that residential investment will weigh on growth in the first quarter.
Indeed, at 1.4% (annualized), Q1 economic growth is tracking well below the Bank of Canada’s forecast of 2.5%. The Bank’s outlook is likely to be downgraded in its Monetary Policy Report on the 18th alongside its interest rate decision. Economic growth seems to have gotten off to a slow start this year, but there are many positives for the data-dependent Bank to consider as it sets interest rates. The unemployment rate is sitting at a record low and inflation pressures have begun to materialize, with the core rates reaching the Bank’s 2% target level. Moreover, the Bank of Canada’s Business Outlook Survey released this week showed a high level of optimism among firms with respect to both sales and investment.
At the same time, however, there are still a number of uncertainties clouding the outlook for the Canadian economy. NAFTA renegotiations and the threat of a global trade war top the list of external threats, while the impact of higher interest rates and policy changes on the housing market and minimum wage hikes loom on the domestic front.
All told, the Bank of Canada will have to balance the positive data points against these downside risks. We suspect that the Bank will remain on hold next week, with the next hike unlikely to come before the summer. The MPR could, however, shed some light on where the Bank sees the balance of risks and what it would take to push rates higher.
 U.S.: Upcoming Key Economic Releases
U.S. Retail Sales - March
Release Date: April 16, 2018
Previous Result: -0.1%, ex-auto: 0.2%
TD Forecast: 0.4%, ex-auto: 0.0%
Consensus: 0.4%, ex-auto: 0.2%
We expect retail sales to advance 0.4%, with the control group up 0.3%. Boosting spending will be auto sales. Tax refunds, which were pushed into March, also imply a pickup in spending. However, offsetting declines from gasoline station receipts, building materials and food services (the latter two likely weather related) should temper the increase.
 Canada: Upcoming Key Economic Releases
Canadian Manufacturing Sales - February
Release Date: April 17, 2018
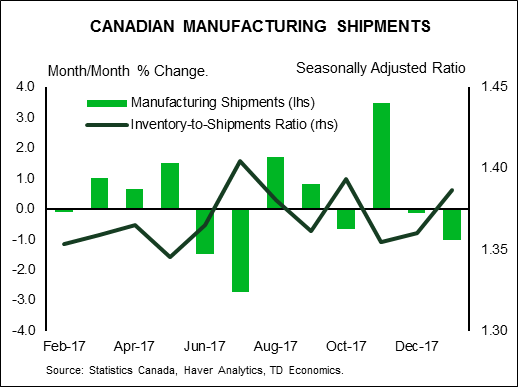
Previous Result: -1.0% m/m
TD Forecast: 1.2% m/m
Consensus: N/A
Manufacturing sales are forecast to rebound by 1.2% m/m in February on a recovery in motor vehicles. Motor vehicle exports posted a sharp rebound in February after plant shutdowns constrained output the prior month. Their recovery should also bode well for auto part shipments, which shaved 0.2% from headline manufacturing sales growth in January off reduced demand. However, energy products should provide an offset. Outside of these two product groups we expect a relatively broad increase in sales, consistent with strong survey data. Real manufacturing sales should post a gain of roughly 1.0%, slightly below the nominal print, which should help support industry-level growth for February.
Canadian Retail Sales - March
Release Date: April 20, 2018
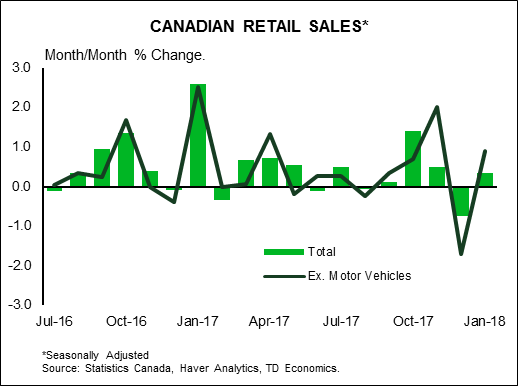
Previous Result: 0.3%, ex-auto: 0.9%
TD Forecast: 0.3%, ex-auto: 0.2%
Consensus: N/A
Retail sales are forecast to rise 0.3% in February, matching their performance from the prior month. We look for auto sales to make a positive contribution to the headline print but expect weaker growth in core retail sales, as a slowdown in the housing market and more modest labour market performance weigh on consumer sentiment. Gasoline station receipts should also make a muted contribution with prices little changed on the month. Real retail sales will come in slightly below the nominal print; even though an upside surprise in February CPI pushed inflation to a three-year high, prices were only up 0.15% on a SA basis. This would leave volumes relatively stable near 3% y/y, though Q1 is shaping up to be weaker after a soft 0.1% increase in January.
 Canadian CPI - March
Release Date: April 20, 2018
Previous Result: 0.6% m/m
TD Forecast: 0.5% m/m
Consensus: N/A
We expect headline CPI to rise further above target to 2.5% y/y, reflecting a 0.5% m/m gain on the month. The latter should translate to a seasonally adjusted increase of 0.3% m/m. Energy prices should be a net positive on higher gasoline prices. We also see a boost from food prices, helped by CAD depreciation over February and March, while the food away from home category may see continued upward pressure after the Ontario minimum wage hike. Outside of food and energy, we expect shelter prices (rents and owned accommodation) to see some moderation as the tailwind from higher mortgage interest costs fades while new home price increases remains weak on the back of the pullback in the Ontario market. But outside of that, risks are generally to the upside. Currency pass-through is a net positive this month given the 4% cumulative depreciation in CAD since January, boosting categories such as apparel and vehicle prices. We also eye another one-off this month in the communications category, which could reflect another jump in internet services prices. After one telecom company ended bundled discounts in January, other telecom companies have begun hiking internet prices beginning March. The lift to headline prices could amount to a non-trivial 10bps.
In light of these upside risks, we expect exclusion-based core measures (ex food and energy, CPIX) to move higher in March while we cannot rule out firmer trend measures given lagged effects of falling economic slack. Looking ahead, we expect headline inflation to remain in the mid-2% range largely on energy prices, whereas core inflation measures should hover closer to 2.0%. That is, inflation remains largely in check.
Dollar Looks to Retail Sales With Syrian Anxiety in the Background
The US dollar lost against most majors even if it appreciated against safe haven currencies on Friday. The Syrian conflict concerns faded at the end of the week and boosted the USD versus the JPY and the CHF. The release of the meeting notes from the March Federal Open Market Committee (FOMC) proved to be a positive for the American currency as the Fed was more hawkish than expected. Next up for the markets will be the release of retail sales data in the US and the Bank of Canada (BoC) rate stamens. US retail sales will be published on Monday, April 16 at 8:30 am EDT. The BoC will release its rate statement on Wednesday, April 18 at 10:00 am EDT.
- Hawkish Fed and dovish ECB not enough for USD
- US Retail sales expected to gain 0.4 percent
- Bank of Canada (BoC) to keep rates unchanged in April
Dollar Struggles With Too Many Fronts Open
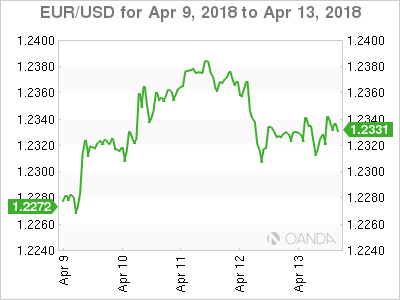
The EUR/USD gained 0.45 percent during the week. The single currency is trading at 1.2335 after the release of the FOMC minutes from the March meeting where the central bank raised rates by 25 basis points. The European Central Bank (ECB) also release the notes from its monetary policy meeting. The contrast between the two was an important factor in the direction of the pair, but not the dominant one as Western states considered air strikes against Syria for its use of chemical weapons.
 The White House’s tough talk on trade has eroded some of the confidence in the greenback as a reserve currency. In the case of a trade war breaking out it is unclear if America would be the winner after reciprocal tariffs would hurt US producers. The Trump administration has opened too many fronts as uncertainty rises on the staff who will be left to manage the offensive.
US retails sales will prove decisive for a dollar looking for support. After a soft start in 2018 a rebound in March data is expected. Given the importance of US consumers to the economy a strong retail sales indicator would appreciated the USD versus the EUR.
Canadian Dollar Rises Ahead of BoC Despite Weak Housing Data
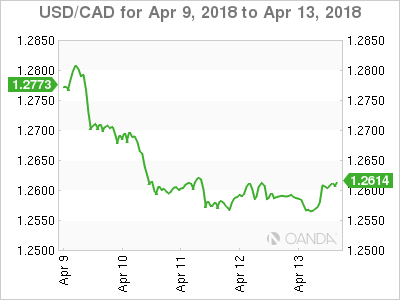
The USD/CAD lost 1.29 percent in the past five days. The currency pair is trading at 1.2615 as trade war concerns have faded. The weakness of the USD and the strength of oil prices have taken the Canadian dollar to the top spot against the USD from all major pairs. The NAFTA treaty pessimism is now optimism as the US has softened its hard stance and various reports are pointing to a lower demands on autos, but there is still a huge gap in other sectors that might not be bridged on the fast track the US expects.
The Bank of Canada (BoC) is anticipated to keep its benchmark interest rate unchanged at 1.25 percent on Wednesday. The central bank has mentioned trade uncertainty as a big factor as well as the slowdown of the economy. Housing data this week revealed lower building permits than expected as well as a downturn in prices of new homes. A positive this week for the loonie was the release of the BoC Business Outlook Survey. Businesses remain optimistic about the economy despite the unclear fate of NAFTA. The central bank is expected to hike at least twice this year, but April is too early with so many unknowns still up in the air.
The fact that the US is now reconsidering rejoining the Trans Pacific Pact in an effort to offset China’s growing influence is a good sign for the survival of NAFTA. Due to the escalation of the Syrian conflict US President Trump had to cancelled his appearance at the Americas Summit in Peru, where the market expected some insight on NAFTA negotiations and how much did the US negotiations were making a real effort.
Market events to watch this week:
Monday, April 16
- 8:30am USD Core Retail Sales m/m
- 8:30am USD Retail Sales m/m
- 9:30pm AUD Monetary Policy Meeting Minutes
- 10:00pm CNY GDP q/y
Tuesday, April 17
- 4:30am GBP Average Earnings Index 3m/y
- 8:30am USD Building Permits
Wednesday, April 18
- 4:30am GBP CPI y/y
- 10:00am CAD BOC Monetary Policy Report
- 10:00am CAD BOC Rate Statement
- 10:00am CAD Overnight Rate
- 10:30am USD Crude Oil Inventories
- 11:15am CAD BOC Press Conference
- 6:45pm NZD CPI q/q
- 9:30pm AUD Employment Change
- 9:30pm AUD Unemployment Rate
Thursday, April 19
- 4:30am GBP Retail Sales m/m
Friday, April 20
- 8:30am CAD CPI m/m
- 8:30am CAD Core Retail Sales m/m
*All times EDT
St. Louis Fed Bullard downplays rise in core CPI
St. Louis Fed President James Bullard tried to down play recent rise in core inflation, where core CPI rose above 2% to 2.1% in March. Bullard said "year-over-year core CPI is now above 2 percent but it was also above 2 percent all during 2016, and so it's really only come back to the level that it was in that earlier period when interest rates were much lower." And to him, "those developments so far have been unsurprising."
Regarding trade tensions, Bullard said there is too much uncertainty around the tariffs to assess the impact for now. But he hoped that US and China will get a good outcome on trade.
Regarding exchange rates, Bullard said growth growth has been surprising, in particular in Europe. Such strength wasn't priced in and thus, led to dollar weakness.
Is Trump Preparing for a Round of Trade Escalation – Again?
The pendulum keeps swinging in the US-China trade conflict. Recently tensions eased following Xi Jinping’s speech at the Boao Forum signalling a more rapid pace of opening up and cutting tariffs on cars and other goods. Trump responded positively on Tuesday 10 April saying, ‘Very thankful for President Xi of China’s kind words on tariffs and automobile barriers… also, enlightenment on intellectual property and technology transfers. We will make great progress together!’
However, there are signs that the Trump administration is not done firing trade shots at China and we could see a further escalation next week. A Wall Street Journal Article (paywall) on Thursday suggested that the White House plans to escalate the pressure further on China as it sees the recent signals from China as concessions due to their pressure, encouraging Donald Trump to add more pressure.
According to the article the White House is preparing to announce details on which goods categories of the USD100bn will be subject to a 25% tariff. Trump announced a week ago, that he had instructed his Trade Representative to look into this list after China announced retaliation to the first USD50bn of goods subject to tariffs. It will raise the total amount of Chinese goods to be taxed at the border to USD150bn (1/3 of total US imports from China, 1.2% of Chinese GDP). Trump’s recent announcement that he will reconsider joining the Trans-Pacific Partnership deal is probably another attempt to add pressure on China, see Reuters, 12 April.
If Trump goes on and announces the USD100bn list of goods, we expect China to be quick to announce a 1-1 retaliation. This has been the pattern so far when Trump announced details on his trade threats. It is not possible to find US goods imports worth a total of USD150bn as the total imports from the US are only USD130bn. However, there are other areas where China can turn up the heat. China has signalled it could restrict trade within services where the US has a surplus around USD30bn. For example 1.1m Chinese tourists spent more than USD30bn in the US in 2016 and a tourist ban on travelling to the US could hurt tourisms. China is also the country sending the most students to the US. In 2016 China had around 350,000 students in the US giving revenue to American colleges and Universities (see South China Morning Post, 14 November 2017). However, China’s strongest weapon is probably a consumer boycott of US products. A People’s Daily article last week warned of ‘an army of 1.4bn consumers who are proud of their nation’s development…’ and that China was ready to ‘fight till the bitter end’.
The White House may be overplaying its cards here and misread what China is doing. China has planned to open up more all along, and what they are doing is speeding up the process. In that sense the pressure is helping reformers within China that argue for faster reforms but who face opposition from vested interests within. This is also alluded to in the WSJ article. However, there is a limit to how much China can speed up, both because the Chinese government generally believes in gradualism, as expressed by the new central bank governor Yi Gang over the past week (‘The Chinese philosophy is gradualism’) and because there is a limit to how much Xi Jinping can offer the US, as it could look as if China is letting itself be bullied by the US into opening up.
While we still believe in a deal between the US and China, ultimately we may be in for another escalation soon. But as we have stated several times, we are likely to see ebbs and flows in the conflict before a deal is finally reached down the line.
Australia & New Zealand Weekly: RBA Financial Stability Review – Global Risks Dominate
Week beginning 16 April 2018
- RBA Financial Stability Review - global risks dominate.
- Australia: Westpac-MI leading index, RBA minutes, employment.
- NZ: CPI, house sales.
- China: GDP.
- Euro Area: consumer confidence, ZEW survey.
- US: retail sales, Federal Reserve Beige Book.
- Canada: BoC decision
- Key economic & financial forecasts.
Information contained in this report current as at 13 April 2018.
RBA Financial Stability Review - Global Risks Dominate
The Reserve Bank released its semi-annual Financial Stability Review (FSR) this week. While previous reports have singled out domestic concerns that led to significant policy changes – the 'macro-prudential' tightenings in 2015 and 2017 – the current focus is more around risks from abroad. Foremost amongst these is the potential disruption from a sharp rise in global interest rates. Threats stemming from China's financial system again highlighted but recent developments are seen as positive. To the extent that Australia's household debt levels are mentioned, they are characterised as a 'contingent risk' that could amplify a shock with borrower stress still low and regulatory measures improving the risk profile of new loans.
The RBA's FSR assesses the condition of the financial system and potential risks to financial stability. While the report may not have the direct link to monetary policy decisions the quarterly Statement on Monetary Policy has, it nonetheless sets out some of the Bank's key concerns, some of which can factor in policy decisions and wider policy formation. Most notably, concerns around Australia's high household debt levels have influenced the Bank's interest rate decisions in the past and prompted so-called 'macro-prudential' tightening measures in both 2015 and 2017.
The circumstances leading in to the April FSR look considerably more benign on the domestic front. In particular, the housing market backdrop is decidedly soft and a far cry from the strong gains in 2015 and 2017 that were sparking concerns about potential overheating. Dwelling price growth nationally has been flat over the last year with modest declines over the last six months. That compares to the double-digit growth rates ahead of the key reviews in 2017 and 2014.
Instead the focus of the report this time is more around the potential risks associated with shocks from abroad, the primary concern being the potential vulnerability to a global interest rate shock. More specifically, a "sharp rise in interest rates in the absence of stronger economic growth arising from, for instance, a jump in realised or expected inflation or a change in investors' risk appetite". The Bank has highlighted in the past the extended period of very low interest rates and low volatility and the extent to which high asset prices relied on the expectation that this situation would continue. This concern has clearly been sharpened by the market turbulence in February – sparked in part by a surprisingly strong wage inflation read in the US and a shift in Fed expectations that saw rates rise across the curve.
The risk of similar episodes is highlighted as a key stability concern with global debt levels high and the potential for a shock to be amplified by more leveraged household and corporate sectors in many countries. In a separate box, the Bank highlights the risk to the global financial system from associated asset price falls. The central concern is that the run-up in asset prices has been across a wide range of assets and a synchronised fall could be very disruptive, notwithstanding post-GFC improvements to the resilience of the global financial system architecture.
Importantly, the RBA's fear centres mostly on a situation in which global interest rates rise sharply without a related increase in growth. While some of the market reassessment in February could be seen this way, the more general rise in rates has been accompanied by more positive expectations for growth and the prospects of a problematic rise in US inflation that might drive such a sharp move in rates still look remote.
On China, the RBA remains concerned about its financial system but notes some improvement over the last six months. The main issue continues to be around high corporate debt, the poor quality of some lending, and the complex and opaque nature of some parts of the financial system. Recent reforms and political commitments are seen as having had some success in containing a further build up in risks but further progress is needed.
On the domestic front, concerns around housing have clearly eased although high household debt is still viewed as a source of vulnerability in the event of a shock. Macro-prudential measures are viewed as having positively reduced the build-up of risks. Current indicators continue to show few signs of stress. Notably the Bank is sanguine on the potential stress from 'interest only' rollovers – "the share of borrowers who cannot afford higher P&I repayments and are not eligible to alleviate their situation by refinancing is thought to be small".
It is also relatively sanguine on risks in the business sector. Although commercial property is still seen as an area to watch, the bank notes that increases in apartment supply have been absorbed well so far despite some increase in settlement issues. Regulatory measures have also seen Australia banks tighten lending criteria for commercial property although foreign banks have become more active. Again, a further increase in global interest rates could impact valuations, leading to some increase in stress.
More generally, Australian banks are seen as having improved their resilience and performance. The RBA notes the 'spike' in short-term funding spreads – BBSW is up about 25bps since the start of the year despite little change in cash rate expectations. While they note historically this has been an indicator of market stress or credit risk, the current circumstance "appears instead to be due to changes in the demand for and supply of US money market instruments" which have spilled over to Australia. The increased issuance of treasury bills on the back of the suspension of the US government debt ceiling as well as near-term seasonal factors has combined with impacts from recent US tax changes encouraging US corporates to repatriate offshore funds and also to borrow directly in the US rather than via interoffice parents.
In terms of overall wholesale funding costs, the RBA also notes that long-term financing conditions remain favourable and that with reduced rates on deposits, "overall funding costs for Australian banks declined over the past year".
Australian banks are seen as "resilient to potential domestic liquidity shocks" with both liquidity coverage ratios and net stable funding ratios above minimum requirements. Further analysis of bank's interest rate risk to a 2ppt increase in shortterm rates is "modest, at around 2 per cent of their current capital level, which is much less than in many other countries". Notably though, this resilience rests on the high share of variable rate assets – any shock is therefore passed on to borrowers, households in particular. How this may circle back to the banks through household activity becomes critical.
Conclusion
The RBA Board next meets on May 1. It is almost certain to leave rates unchanged and may well lower its 3¼% forecast for growth in 2018 in the May Statement on Monetary Policy released three days later. The FSR confirms that while domestic stability concerns around household debt and housing are less pressing than they were in 2015 and 2017 they are still a consideration for policy. The prime concern is instead the potential impact from rising global interest rates, particularly in an environment that does not see corresponding gains in growth and incomes and with some risk of large, synchronised asset price falls.
Asked following a speech this week "what keeps him awake at night?" the RBA Governor responded that he "sleeps relatively well" but his three main concerns were fragilities in China's financial system, the possibility of a trade war, and the high level of household debt, particularly as it affects the economy's response to an external shock. That suggests the Governor is less anxious, for now, than the FSR appears to be about a sudden sharp rise in global interest rates.
The week that was
Global markets have remained in a delicate balance this week, unsure of the next turn in the US/China trade saga and given growing geopolitical tensions. Meanwhile in Australia, the RBA sought to encourage optimism over the outlook.
For Australia, the most significant development this week was RBA Governor Lowe's address in Perth, titled 'Regional Variation in a National Economy'. His take-home point was simple: "over time the differences in the structure of output and employment across regions are tending to become smaller". For much of the post-GFC period, Australia has suffered from a two (or more) speed economy, most evident after the end of the mininginvestment boom when opportunities in WA and Qld lagged a long way behind the other states.
However, as highlighted by Governor Lowe, this disparity of opportunity looks to be dissipating. Consider the 2.5%yr gain for employment in WA over the past year against the four years of no growth that preceded it. Business investment in the state has also stabilised over the past year, having halved from its peak. And business conditions are also trending higher towards those seen elsewhere in Australia. The one 'cyclical' convergence that is not positive for our economy is that of wages which are weak across the nation, restraining consumption.
Governor Lowe went on to discuss a number of structural factors across the states. Two are worth highlighting. First is interstate migration. While NSW and Vic has received the lion's share of international migration, interstate migration is now spreading the benefit of population growth from NSW to Queensland. Further, the outflow of workers from WA has also abated. Both Qld and WA now have a stronger foundation for growth come 2018 and beyond. The imbalance in house prices also cited is a key justification of this outflow, with affordability weighing heavily on the minds of residents of NSW.
Interestingly, interstate migration remains a positive for Vic despite concerns over affordability. Arguably for Vic, the growth and employment opportunities there outweigh the high cost of living.
Providing support for the RBA's optimism over the outlook, Westpac–MI consumer sentiment held above the optimist/ pessimist divide in April, near its long-run average. Economic conditions on a one and five-year view remain well above average levels despite recent trade and geopolitical tensions. But against this positive overview, households' perceptions of their finances remain sub-par, particularly for the coming year. Consumers' willingness to spend is then limited, with 'time to buy a major household item' also below average, and affordability concerns are felt all the more –most prominently in Sydney and Melbourne. It is difficult to foresee above-trend GDP growth in Australia if these concerns around family finances persist.
On business conditions, the exceedingly strong outcomes reported by the NAB business survey in January and February we were cautious of have now been reversed. That said, March was still a strong result, well above the long-run average. By sector, retail remains the standout weak spot, particularly given strength is relatively broad based elsewhere. This is a concern for business investment as equipment investment is typically concentrated in retail and other consumer-centric industries.
Moving offshore, developments in the trade spat between the US and China have been positive this week. President Trump's request for another $100bn of Chinese imports to impose tariffs on was largely forgotten mid-week, thanks to President Xi's conciliatory tone. In his address, President Xi provided nothing new in terms of policy, nor any hard dates for reform.
That said, President Xi's remarks did (again) highlight that China is willing to negotiate a solution, even one that allows the US to claim an immediate political victory. China is instead focused on developing its long-term economic and financial strength; western know-how in finance and insurance (among other industries) could aid their cause materially. There is still a long way to go before the consultation period for tariffs announced to date ends. Further bouts of volatility before an eventual deal is therefore highly likely.
On US monetary policy, the March FOMC meeting minutes again emphasised that the Committee has a great deal of confidence in the outlook for the economy, and hence their 'gradual' approach to policy normalisation. We agree that the near-term risks are to the upside, but feel that, come mid-2019, that situation will turn. Strong outcomes in the short term will see financial conditions tighten, restricting growth later. To our mind, that will put a halt to the FOMC's rate hike plans following four further increases by June 2019.
Chart of the week: US budget deficit
In the US, the CBO has released their long-awaited analysis of the Trump administration's tax and spending initiatives – respectively passed in December 2017 and February 2018.
From 2019, the CBO's best-case scenario sees the deficit at 5% of GDP, leaving public debt to GDP at 96% of GDP in 2028. Needless to say there are plenty of ways a worse outcome could come to pass. Most notably, given the current expansion is near the longest on record, a further decade of growth from here is highly unlikely. More so in 2019 than 2018, the risk of an eventual recession will play on market participants' minds.
Further detail can be found in our Northern Exposure publication which provides regular analysis on the US and European economies.
New Zealand: week ahead & data wrap
Activity muddling along
For some time we've been highlighting that GDP growth over the next few years is likely to be slower than both the NZ Treasury and the RBNZ are assuming. We expect that growth is going to slow from rates of around 3.5% to 4% in recent years, to around 2.8% over 2018 and 2019. In part, that reflects some developments that are already underway, including increasing capacity constraints in the construction sector and a gradual slowdown of population growth from the current rapid pace. We also expect that the housing market will cool, putting a dampener on consumer spending.
With this in mind, the latest Quarterly Survey of Business Opinion provided some interesting reading. While business confidence has picked up as the uncertainty around last year's election has faded, it remains lower than the levels we saw over the past few years. Importantly, both trading activity and forward orders remain down on the levels we saw through 2016 and early 2017. Overall, we're left with a picture of an economy that is continuing to muddle along. However, we're not seeing signs of the re-acceleration in activity that government agencies are banking on. And that's also the message we're getting from other surveys of business conditions, including the latest PMI.
Consistent with signs that the momentum in economic activity is softening, we've also seen some easing in businesses' hiring intentions, and firms have reported less difficulty finding labour. However, at least at this stage, businesses' investment intentions have been a bit more resilient than we might have expected.
On the prices front, we have seen a lift in cost pressures. However, this does not appear to be spilling over into widespread increases in consumer price inflation. In fact, looking at key sectors like retail, the number of firms who have been increasing their prices remains at low levels. Prices are rising a bit faster in the construction sector than elsewhere, but even here, things look like they are levelling off.
The impact of minimum wage hikes
This week we released two Bulletins looking at some key developments in the New Zealand economy. The first looks at the impact of planned minimum wage hikes.1 From the start of April the minimum wage increased from $15.75/hr to $16.50/hr. This was the first step in the new Government's plan to raise the minimum wage to $20/hr by April 2021, economic conditions permitting.
Compared to other developed countries, minimum wage changes are likely to have a larger impact in New Zealand. That's because, relative to average wage rates, New Zealand already has the highest minimum wage rate in the OECD. Planned policy changes will extend this lead further over the next few years.
Prior to the most recent increases, we estimate that around 8% of workers were covered by the minimum wage (around 155,000 people). The planned increases will likely cover around 10% more of workers. There will also be some workers who will receive a pay rise in order to maintain wage relativities across roles. This means that by April 2021, up to 25% of the workforce – about 530,000 workers – could have their pay rates affected by the increase in the minimum wage. However, the impact on labour costs will not be as dramatic, as these workers share of the total wage bill will be around 12%.
We estimate that the minimum wage hikes will add about 1 percentage point to the Labour Cost Index (LCI) over the next four years combined. That's compared to what would have happened if the minimum wage had continued to rise at the same rate as in recent years. The minimum wage has been rising by around 3.3% per annum since 2011, which has added around 0.1% to the LCI each year. Over the coming years, the minimum wage will rise by around 6.2% per annum, and will have a larger impact in later years as increasing numbers of people are affected.
A 1% rise in the LCI as a result of minimum wage hikes is expected to reduce the number of hours worked by 0.3%, and raise the unemployment rate by 0.2%.
The impact on the CPI is expected to be much smaller than the increase in wage costs. Increases in the minimum wage are expected to add an additional 0.3 percentage points to the CPI, spread over the next four years. While some industries (such as hospitality) may increase prices due to minimum wage changes, competitive pressures are keeping a cap on many prices. In addition, in many affected industries, there is not a close relationship between wage costs and the prices faced by consumers (e.g. health care services).
Auckland's growing housing shortage
The second Bulletin we released looks at Auckland's growing housing shortage.2 Population growth in Auckland has continued to outpace home building, and around a decade of strong construction activity will be required. That is going to be a tough task to achieve. Auckland already has a shortage of around 30,000 homes, and the region's population is set to grow by around 300,000 people over the coming decade.
We expect that construction activity will increase over the next few years. However, it will be a slow grind higher. Even with building levels still below the required pace, the construction sector is already encountering growing pains, including a shortage of skilled labour. This is providing a brake on how quickly construction activity can ramp up, and means that home building will need to remain strong even as population growth slows.
The shortage of housing is going to get worse before it gets better. Although we expect that population growth will slow over time, it will be several years before building levels catch up, and even longer for the shortage of homes to be eroded.
Data Previews
Aus Mar Westpac–MI Leading Index
Apr 18, Last: +1.30%
The six month annualised growth rate in the Leading Index rose from +0.68% in January to +1.30% in February, a well above trend read indicating improving prospects for growth in the first half of 2018. That said the index has been very choppy over the last four months, mainly reflecting volatile swings in the dwelling approvals component.
The Mar read looks likely to see some easing. It will include weaker updates on: the ASX200, down –4.3% vs –0.4% last month; the Westpac-MI Consumer Expectations Index, down –0.9% vs –0.1% last month; dwelling approvals, down –6.2% vs 17.2% last month; the yield spread, which has narrowed 30bps vs a 13bps widening last month; and the Westpac-MI Unemployment Expectations Index, which deteriorated 3.1% vs 1% last month. These moves will likely dominate small gains in total hours worked, US industrial production and commodity prices.
 Aus Labour Force Survey – total employment '000
Apr 19, Last: 15.8k, WBC f/c: 20k
Mkt f/c: 20k, Range: 10k to 30k
Total employment grew 17.5k in February, broadly in line with the market expectation of 20k and a little below Westpac's forecast of +25k. Full time employment rose 65k and part-time fell 47k reversing January's mix of -53k and +66k respectively. Hours worked gained 1.2% in February after falling 1.3% in January.
2017 was a strong year for employment ending the year at a 3.4%yr pace. But momentum steadied over the past three months and the three month annualised pace has slowed to 2.1%. This pace is more consistent with a solid, rather than aggressive, employment growth outlook over the near-term as suggested by business surveys.
The business surveys have flattened a little but are still holding very robust levels suggesting healthy employment growth. Our 20k forecast will see the annual pace of employment growth ease modestly to 3.2%yr.
 Aus Labour Force Survey – unemployment rate %
Apr 19, Last: 5.6%, WBC f/c: 5.6%
Mkt f/c: 5.5%, Range: 5.4% to 5.6%
In February the unemployment rate lifted to a soft 5.6% (5.56%) from 5.5% (5.50%) in January. Over the first three quarters of 2017, we saw some progress in reducing the unemployment rate, falling from a peak of 5.9% in February to 5.5% in September. However, that has since stalled as the participation rate has steadily risen from 64.5% in September 2016 to 65.7% as at February, while employment momentum has recently eased.
We are looking for the participation rate to hold at 65.7% which given the current rate of working age population growth should see the labour force lift by 25.7k in the month. As such we expect the unemployment rate to hold 5.6% when rounded to one decimal place.
 NZ Mar REINZ house sales and prices
Apr 17, Sales last: +1.5%, Prices last: 3.9%yr
After slowing in early- to mid-2017, the New Zealand housing market has been more positive in recent months. House prices lifted 1.5% over the three months to February – slightly less in Auckland and Canterbury, slightly more elsewhere. Market turnover has also picked up, albeit less emphatically.
March will probably be another relatively buoyant month. Banks have been reducing mortgage rates and lending more freely.
However, later in 2018 we expect a marked housing market slowdown. The bright-line test for taxing capital gains on resold properties will be extended from two to five years, foreign buyers will be restricted from mid-year, and further tax changes designed to cool house prices can be expected. At the same time, population growth is slowing and fixed mortgage rates will soon stop falling.
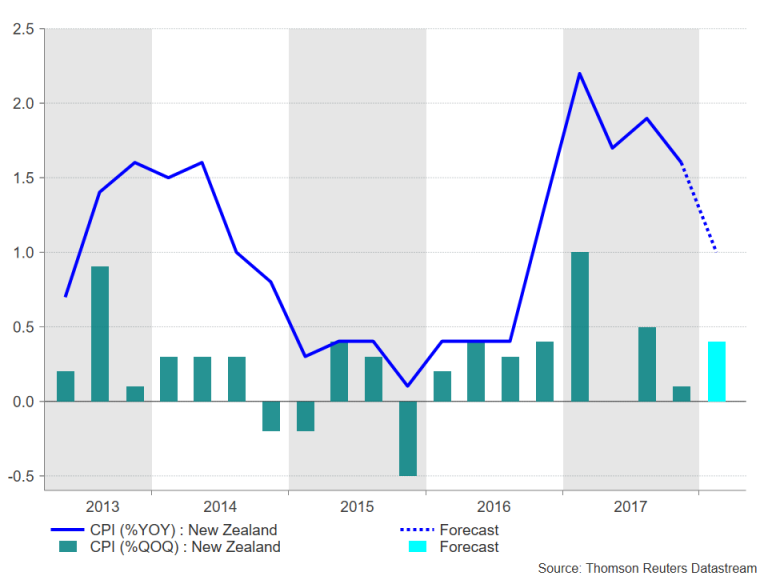
 NZ Q1 CPI
Apr 19, Last: 0.1%, Westpac f/c: 0.5%, Mkt f/c: 0.5%
We expect a 0.5% rise in consumer prices for the March quarter, barring any major surprise in March food prices (released on Monday). This would bring annual inflation down from 1.6% to 1.1%, the lowest since September 2016.
There are two factors behind the drop in annual inflation. The first is the introduction of a years' free tertiary education, which we estimate will take 0.2% off the CPI. The second is base effects: a surge in oil prices a year ago saw annual inflation rise to 2.2% in March 2017, before dropping back to 1.7% in June. The dip in annual inflation this year will be similarly short-lived.
Setting aside the expected volatility, underlying inflation remains subdued. The lower New Zealand dollar over the last year will add to tradables inflation, but domestic inflation pressures have yet to pick up.
 US Mar retail sales
Apr 16, last –0.1%, WBC 0.4%
US retail sales have continued to disappoint through Q1 2018. In the February report, a third consecutive negative was recorded for total sales.
It is certainly the case that one-off factors have been at play: auto sales continue to come back to a more normal level after their hurricane-induced spike in late 2017; also abnormally cold weather in February weighed on gasoline and store sales as consumers stayed home. However, a surge back in Mar is highly unlikely.
Evident in the income and savings data in recent months is that real wages growth (excluding the tax cuts) remains soft, and household savings low versus history. These restrictions on spending are unlikely to abate anytime soon. As such, we look for continued modest gains for spending through 2018 – circa 0.4% for headline sales in March, and 0.2% for core.
 China Q1 GDP
Apr 17, last 6.8%, WBC 6.8%
In the final quarter of 2017, annual growth was sustained at a strong 6.8% despite a pull back in the quarterly growth pulse, from 1.8% to 1.6%. The first quarter of 2018 looks as though it will be a repeat of the last (1.6%; 6.8%).
As we move through 2018, quarterly growth will be sustained near 1.6%, and that will result in the annual growth rate slowing to 6.3%, a little below authorities 6.5% growth target for the year.
Driving this outcome is expected to be a much-reduced contribution from net exports and continued modest momentum in investment, across both housing and infrastructure.
Evident from the PMI reports, restraint on hiring and incomes will preclude an acceleration in spending by the consumer. This trend will be sustained into 2019.
Week Ahead – March Inflation, BoC Meeting, US Retail sales and China GDP Among Highlights; Geopolitical Risks also Loom...
It will be an important week for major economic releases over the next seven days with key indicators due from all the big markets. Inflation and retail sales data will dominate the calendar followed by employment numbers. A policy meeting by the Bank of Canada will also be eyed. However, with geopolitical risks currently running high, a worsening risk sentiment could dampen market enthusiasm for the data.
While simmering tensions in the Middle East may have distracted President Trump’s attention away from the trade dispute with China, markets will still be watching for any developments on that front. In particular, investors will want to see the two sides begin negotiations to demonstrate progress after China’s President signalled willingness to compromise in a key address this week. A bigger imminent risk at the moment, however, is the real threat of military action by the United States and its allies in Syria. A military response by the West to the suspected chemical weapons attack in Syria could escalate into a wider conflict with Russia and other players in the Middle East. Safe-haven assets such as gold and the yen will likely remain elevated in the coming week in the absence of a diplomatic push to ease Syrian tensions, while oil might also receive an additional lift in case of supply disruptions.
Australian job figures could push aussie beyond $0.78
Some easing in US-China trade tensions helped the Australian dollar to climb to three-week highs this week. The aussie could extend those gains if Thursday’s employment data shows there was another month of solid job gains in March. Before that though, the minutes of the Reserve Bank of Australia’s March policy meeting will come into focus. No surprises are expected from the minutes as the RBA has been pretty consistent recently in maintaining a neutral stance.
Staying close to the region, New Zealand will publish quarterly inflation figures on Thursday. After briefly rising to within the upper band of the Reserve Bank of New Zealand’s 1-3% inflation target in the first quarter of 2017, CPI has since fallen back below 2% and stood at 1.6% in the final quarter of last year. It is expected to drop further in the first three months of 2018 to 1.0% year-on-year. The number may not necessarily alarm the RBNZ, which may decide to take comfort from the anticipated 0.4% quarter-on-quarter gain instead and stick to its neutral path. However, if there is a lower quarterly reading, it could undo some of the kiwi’s sharp two-week gains and thwart a potential break above $0.74.
 Japanese trade and CPI eyed
Another country reporting inflation data next week is Japan. The core CPI rate targeted by the Bank of Japan reached a milestone in February by climbing to 1% y/y – the halfway mark to the BoJ’s 2% objective. However, the snail-pace progress will likely be highlighted again in March as core CPI is expected to dip back to 0.9% y/y in Friday’s data. Also out of Japan next week are the latest trade figures, due on Tuesday. Japanese exports have been growing positively since the end of 2016 but have slowed substantially from 18.1% in August 2017 to 1.8% in February. Further deterioration could raise some alarm about the sustainability of the current upturn in Japanese growth and would suggest a stronger yen is weighing on exports.
China Q1 GDP in spotlight
Investors will get a good insight into China’s economic performance in the first quarter of the year as the GDP report is out along with monthly industrial output, investment and retail sales figures. All the data are due on Tuesday. China’s economy is forecast to have expanded by 6.7% y/y in the January-March period, marginally lower from the prior quarter’s 6.8% rate. If confirmed, it would underscore the view that only a mild slowdown is anticipated this year. A stronger-than-expected reading on the other hand would be especially impressive given the winter pollution curbs and tighter lending controls. But a disappointing figure could raise concerns of a deeper slowdown.
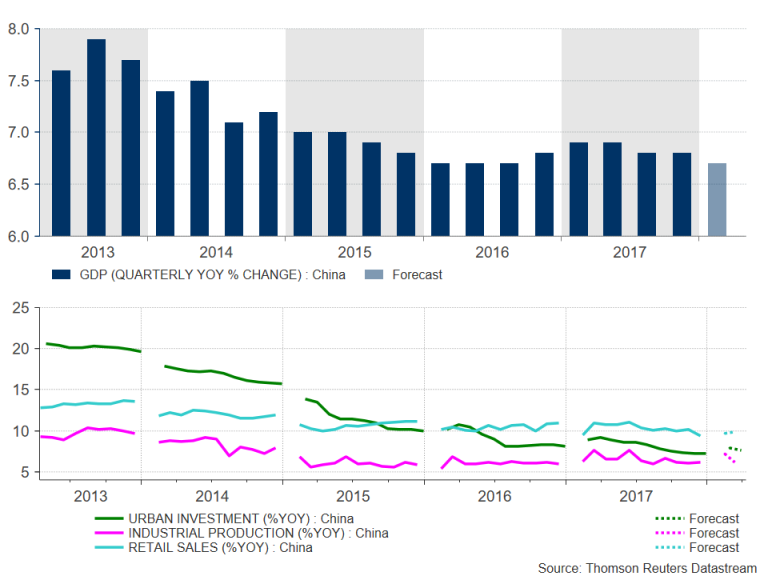 Looking at the other figures, industrial output is forecast to moderate from 7.2% y/y in February to 6.2% in March and investment in urban areas is expected to slow from 7.9% to 7.6% annually in the year-to-date in March. Retail sales meanwhile are forecast to quicken to 9.9% y/y. All three indicators were boosted in February from the Lunar New Year celebrations.
German ZEW awaited for clues on Eurozone growth
It will be a relatively quiet week for the Eurozone with only the ZEW economic sentiment index out of Germany likely to grab much attention. The closely watched business confidence gauge fell to the lowest since September 2016 in March as a stronger euro and rising trade war fears weighed on investor sentiment in the Eurozone’s largest economy. The ZEW economic sentiment index is forecast to decline further in April to -1.3 from 5.1 when released on Tuesday. On Wednesday, the final reading of euro area inflation for March is expected to stay unrevised at 1.4% y/y, and on Friday, the flash print of the consumer confidence index for April will be watched.
UK inflation, jobs and retail sales in focus
Major data out of the UK next week will be scrutinized as key measures for prices, the labour market and consumer spending will be the last releases before the Bank of England’s next policy meeting on May 10. The jobs data is out first on Tuesday. The unemployment rate is expected to hold steady at 4.3% in the three months to February. Average weekly earnings are forecast to rise by 3.0% y/y in February, which would make it the highest since September 2015 and up from the prior 2.8%. Inflation numbers will follow on Wednesday. After the bigger-than-expected fall to 2.7% in February, the annual rate of CPI is forecast to hold at that level in March. The core rate is expected to inch up though by 0.1 percentage points to 2.5%. On Thursday, retail sales figures will round up the UK data. Retail sales are forecast to decrease by 0.5% month-on-month in March, having jumped by 0.8% in the previous month.
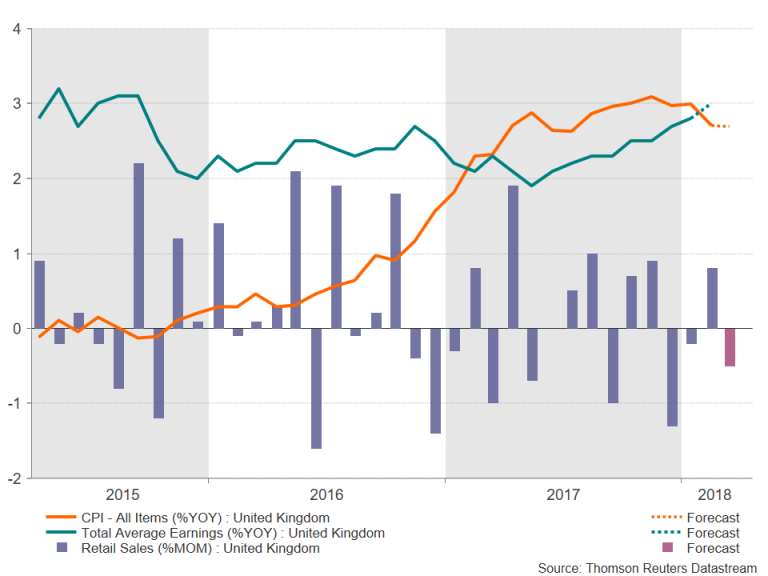 Any big surprises in the data could be significant in swaying the BoE policymakers that are sitting on the fence with regards to voting for a rate hike in May. MPC members have been citing a stronger-than-expected recovery in wages as one of the main reasons for arguing for further tightening in monetary policy this year. Any renewed weakness in wage growth though could lead to reduced odds for a rate hike next month. The pound could face a sharp sell-off should the data disappoint, ending the week-long rally that has driven cable close to $1.43.
US retail sales to show stronger end to quarter
The Federal Reserve pointed out consumption as a weak point in the economy in the first quarter in its March policy meeting minutes published this week. But after three consecutive months of 0.1% m/m declines, retail sales are forecast to have rebounded slightly in March, with sales expected to grow by 0.4% in Monday’s data. A bigger-than-expected increase could help the US dollar target the 108-yen level after this week managing to break out of its recent 106.50-107.50 range.
Other data to watch out of the US next week will include the Empire State manufacturing index for April on Monday, March building permits and housing starts, as well as industrial output on Tuesday, and the Philly Fed manufacturing index for April on Thursday. In addition to the data, several Fed policymakers, whose comments have the capacity to move the dollar, will be making public appearances. The speakers will include Raphael Bostic, William Dudley and Randal Quarles.
Loonie looks to Bank of Canada to extend rally
It will be a crucial week for the Canadian dollar as inflation and retail sales data, along with a Bank of Canada policy meeting could pave the way for a rate hike in May. As the US, Mexico and Canada move closer to a NAFTA deal, it potentially removes a major downside risk to growth for the BoC, shifting the focus firmly back onto data. Inflation came in at a stronger-than-expected 2.2% in February and another positive reading in March on Friday would strengthen the case for an early rate hike. Retail sales, also due on Friday, have been somewhat disappointing in recent months but are forecast to bounce back in February, jumping by 1.1% m/m.
However, the data will be too late for the April policy meeting which takes place on Wednesday. The BoC is expected to keep rates at 1.25% but could hint at a move at its May 30 meeting. Any hike though would be dependent on a preliminary NAFTA deal being agreed before then. The loonie has already rallied to more than 7-week highs on growing optimism of a deal but could be vulnerable to a downside correction should next week’s data disappoint.