Sample Category Title
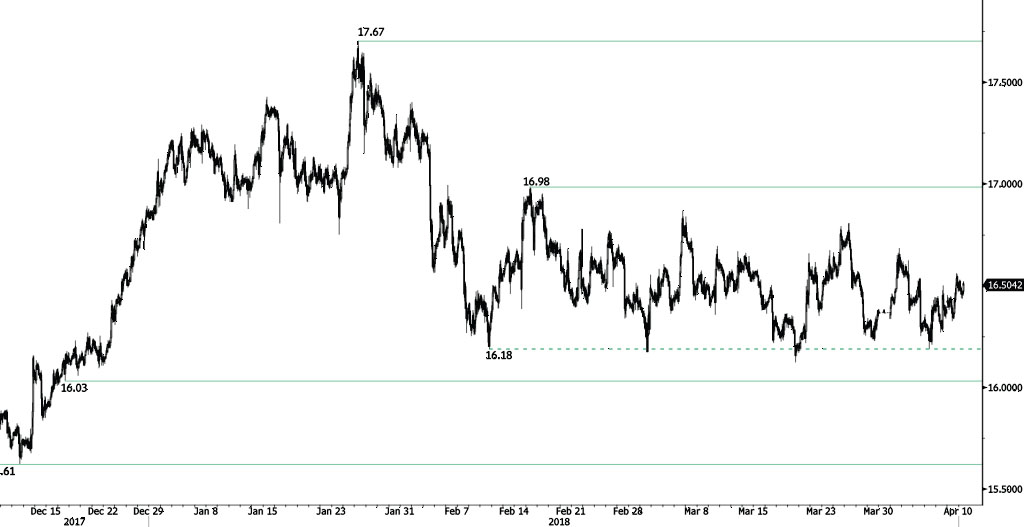
SILVER Trading Sideways
Silver is pausing following recent rise at 16.56, heading along the 16.52 range. Silver is contained between hourly support and resistance given at 16.03 (18/12/2017 low) and 16.98 (15/02/2018 high). The short-term technical structure suggests short-term sideways trading moves.
In the long-term, the trend remains negative/ sideways. Further downside is very likely. The pair is trading below its 200 DMA. Resistance is located at 21.58 (10/07/2014 high). Strong support can be found at 11.75 (20/04/2009).
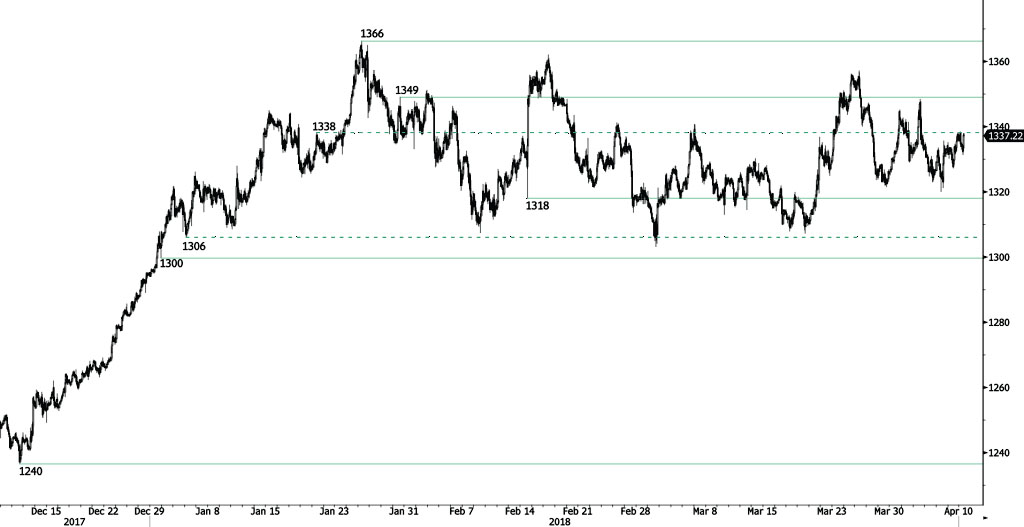
GOLD Bearish Reversal
Gold is starting a bearish consolidation phase following recent recovery at 1338. Approaching the 1334 range. Hourly support and resistance remain at 1318 (14/02/2018 low) and 1349 (30/01/2018 high). The technical structure suggests short-term consolidation.
In the long-term, the technical structure suggests that there is a growing upside momentum. A break of 1'392 (17/03/2014) is required to confirm it. A major support can be found at 1'045 (05/02/2010 low).
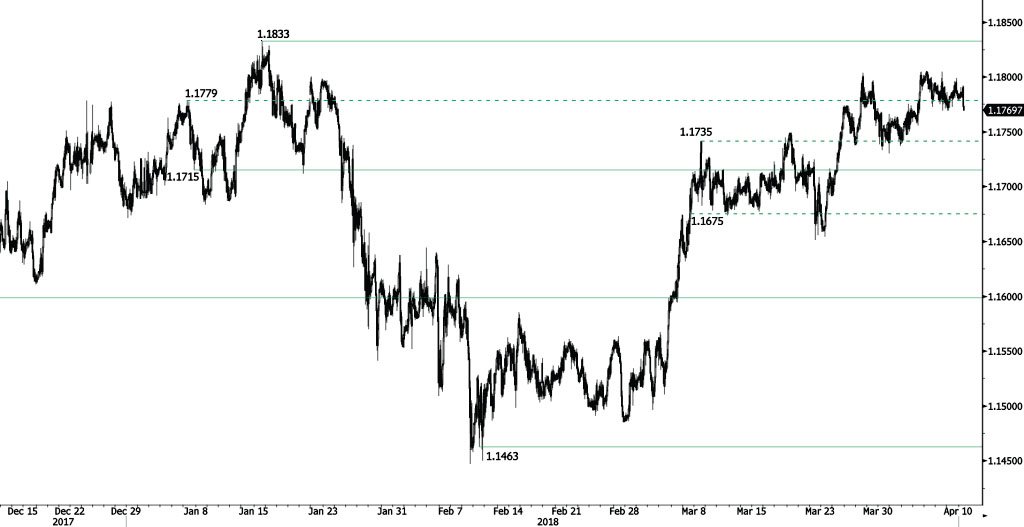
EUR/CHF Heading Lower
EUR/CHF sideways trading phase stops, the pair is decreasing, heading along the 1.1771 range. EUR/CHF bullish trend started in March is maintained. Hourly support and resistance are given at 1.1715 (07/01/2018 low) and 1.1833 (15/01/2018 high). The short-term technical structure suggests short-term decrease.
In the longer term, the technical structure has reversed. Strong resistance is given at 1.20 (level before the unpeg). Yet, the ECB's slowing QE program is likely to cause buying pressures on the euro, which should weigh in favour of the EUR/CHF. Support can be found at 1.0234 (20/04/2015 low).
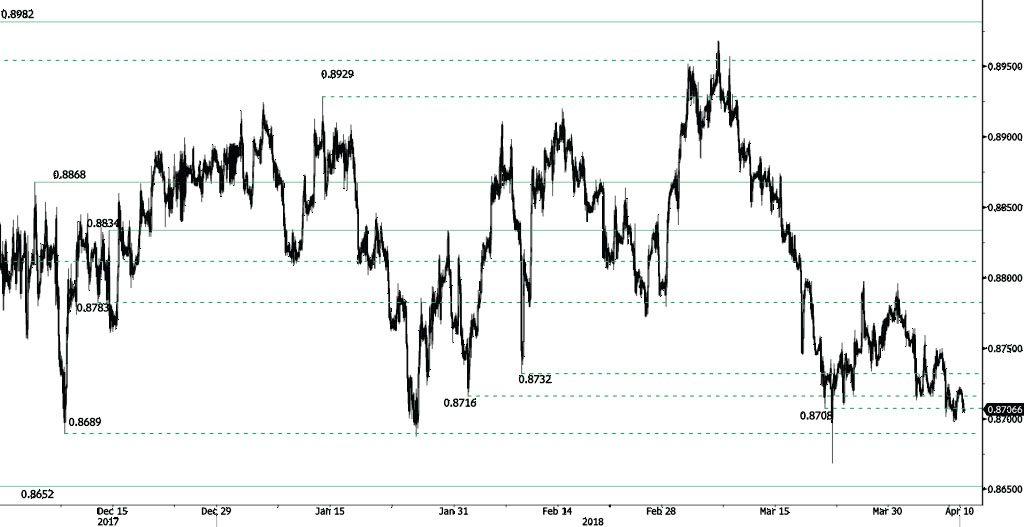
EUR/GBP Strong Decline
EUR/GBP is decreasing further, approaching January 2018 lows and heading along the 0.8695 range. EUR/GBP bearish pattern started in March is maintained. Hourly support and resistance are given at 0.8652 (08/06/2017 low) and 0.8834 (14/12/2017 high). The technical structure suggests further short-term decrease.
In the long-term, the pair has largely recovered from 2015 lows. The technical structure suggests further upside pressure. Strong resistance can be found at 0.9500 (psychological level) while support remains at 0.8304 (05/12/2016 low). The pair is trading below its 200 DMA.
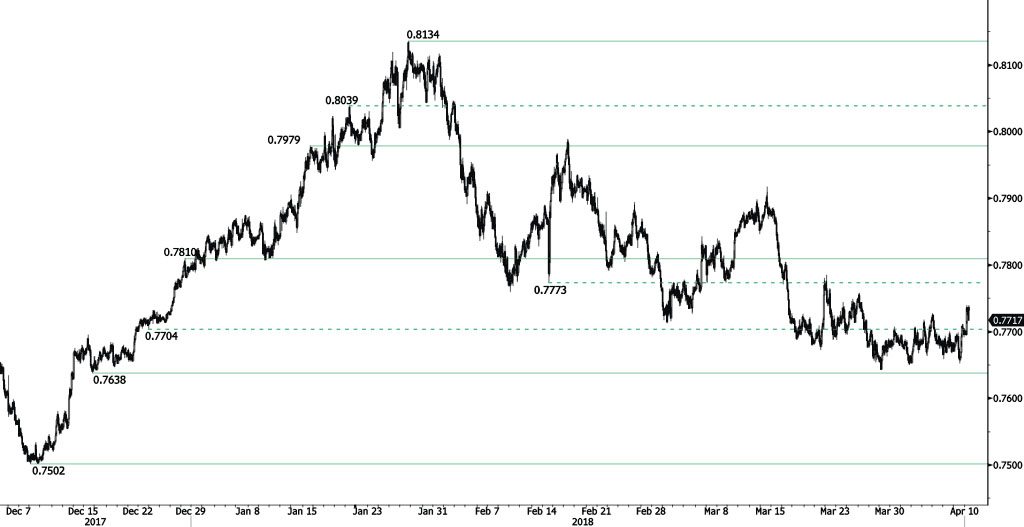
AUD/USD Strengthening
AUD/USD is bouncing off from 0.7652 low, heading along the 0.7740 range. The bearish pattern started in February 2018 is maintained. Hourly support and resistance are given at 0.7638 (15/12/2017 low) and 0.7810 (28/12/2017). The technical structure suggests short-term upward moves.
In the long-term, the upward trend slows down after failing to reach key resistance at 0.8164 (14/05/2015 low). Key support stands at 0.6009 (31/10/2008 low). A break of the key resistance at 0.8164 (14/05/2015 high) is needed to invalidate our long-term bearish view.
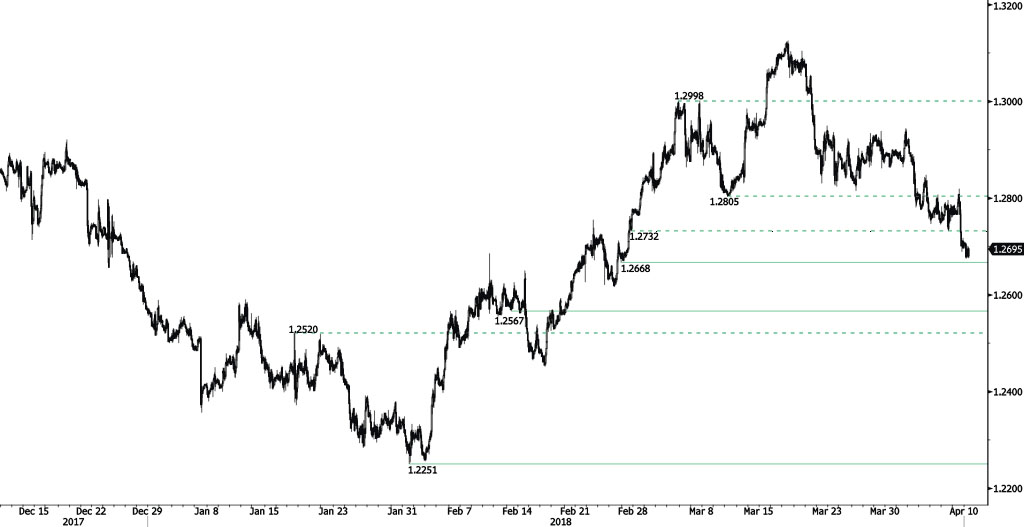
USD/CAD Steady Bearish Pressures
USD/CAD is pausing following recent decline from 1.2819 high, breaking hourly support at 1.2732 (27/02/2018) and approaching new hourly support given at 1.2668 (26/02/2018 low). Hourly resistance at 1.3308 (23/06/2017 high) is distanced. The short-term technical structure suggests short-term sideways trading moves.
In the longer term, the pair is trading between resistance point at 1.3805 (05/05/2017 high) and support at 1.2128 (18/06/2015 low). Strong resistance is given at 1.4690 (22/01/2016 high). The pair is likely to head lower. The pair is trading above its 200 DMA.
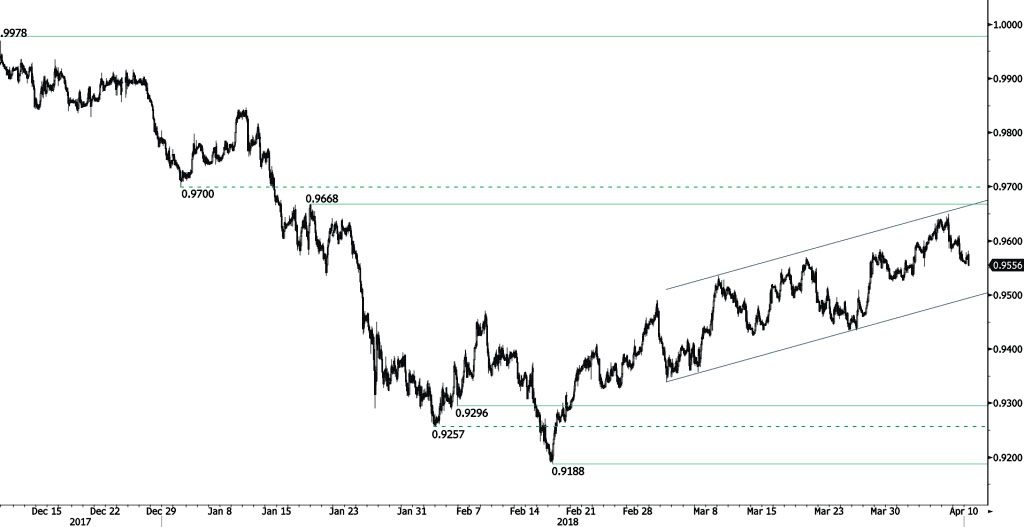
USD/CHF Bearish Dip Within Sideways Range
USD/CHF recovery stops, the pair is deceasing following recent rise at 0.9649, heading along the 0.9550 range. The bullish pattern started from 0.9188 (16/02/2018 low) continues. The pair is contained between hourly support and resistance given at 0.9296 (05/02/2018 low) and 0.9668 (17/01/2018 high). The technical structure suggests short-term sideways trading moves.
In the long-term, the pair is still trading in range since 2011 despite some turmoil when the SNB unpegged the CHF. Key support lies at 0.9072 (07/05/2015 low) while resistance at 1.0344 (15/12/2016 high) is distanced. The technical structure favours a long term bullish bias since the unpeg in January 2015.
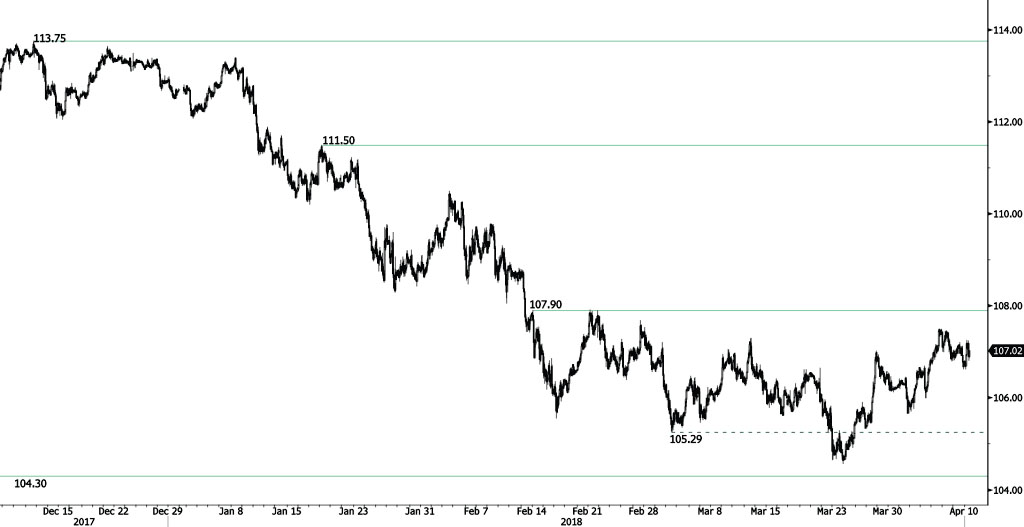
USD/JPY Testing The 107.25 Range
USD/JPY bullish momentum continues after a slight decline at 106.62 low. Approaching the 107.25 range. Hourly support and resistance are given at 104.30 (08/11/2016 low) and 107.90 (14/02/2018 high). The bearish pattern started in January 2018 is maintained. The short-term technical structure suggests further short-term increase.
We favor a long-term bearish bias. Support remains at 101.20 (09/11/2016 low). A gradual rise toward the major resistance at 125.86 (05/06/2015 high) seems unlikely. Expected to decline further support at 101.20 (09/11/2016 low). The pair trades largely below its 200 DMA.
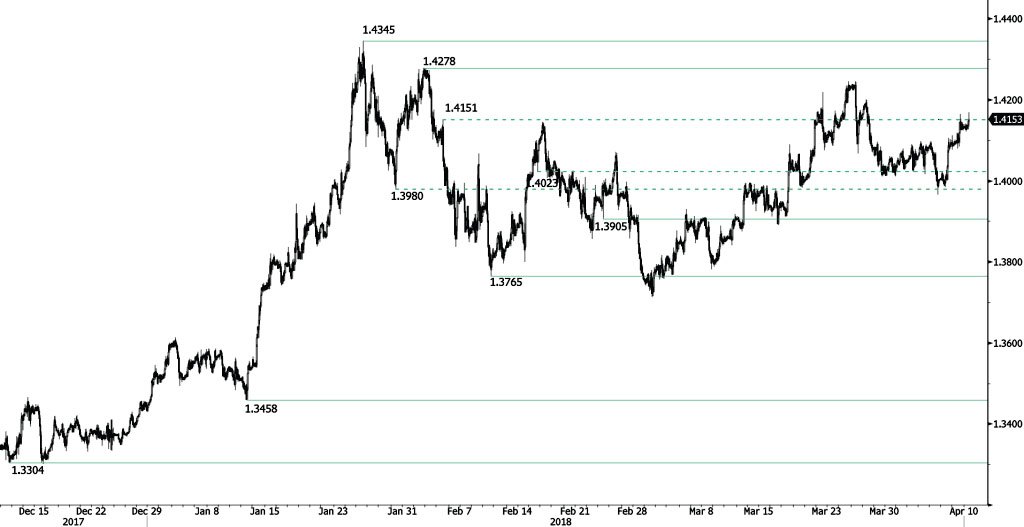
GBP/USD Edging Higher
GBP/USD continues its recovery phase, approaching March 2018 highs and heading along the 1.4170 range. Hourly support and resistance are given at 1.3905 (23/02/2018 low) and 1.4278 (02/02/2018 high). The technical structure suggests further short-term increase.
The long-term technical pattern is reversing. The Brexit vote had paved the way for further decline but the pair is moving to 2016 highs. Long-term support and resistance are given at 1.1841 (07/10/2017 low) and 1.5018 (24/06/2016 high).
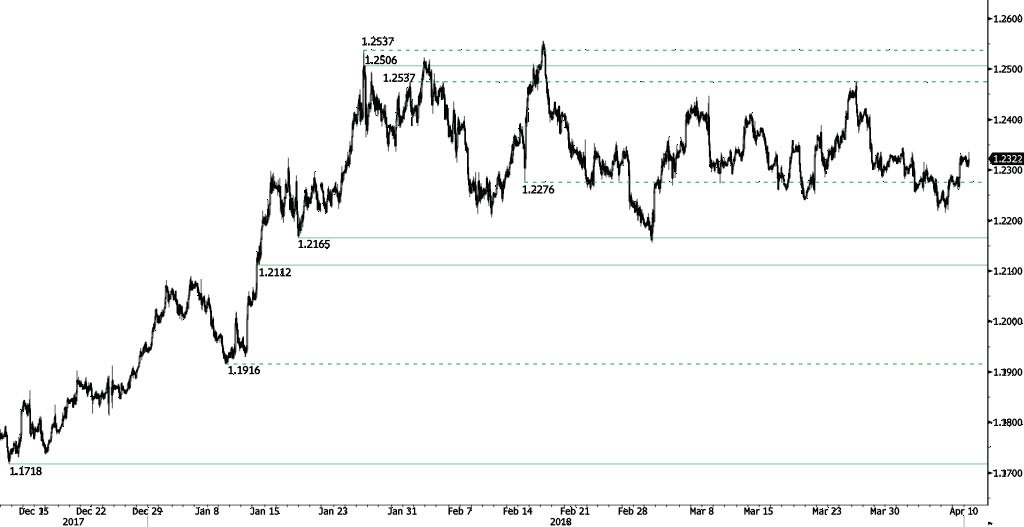
EUR/USD Sideways Range Continues
EUR/USD sideways trading continues following slight increase at 1.2335. The pair is currently maintained between hourly support and resistance given at 1.2165 (17/01/2018 low) and 1.2506 (25/01/2018 high). The technical structure suggests further sideways trading moves.
In the longer term, the momentum is turning largely positive. We favor a continued bullish bias. Key resistance is holding at 1.2886 (15/10/2014 high) while strong support lies at 1.1554 (08/11/2017 low).