Sample Category Title
BRL In Free Fall Amid Political Uncertainties
Brazilian assets in the doldrums
Over the last few days, both Brazilian stocks and the real suffered major losses amid rising heightened uncertainties about the upcoming presidential elections. On Monday, the Bovespa index fell 1.78% to 83,307 points. The 1-month implied volatility also edged above the 20% level to 21.85%. Overall, the stock market was only moderately impacted by the local political developments. On the other hand, in the FX market, traders were more nervous against the backdrop of a potential trade war between the two largest economies.
On Monday, the Brazilian real slid 1.54% to its lowest level since December last year as USD/BRL hit 3.4219. Developments in the option market suggest that traders are buying protection against further depreciation of the real. The 6-month 25-delta risk reversal (the difference between call and put prices) jumped 45bps to 2.3575% amid mounting worries that a less market friendly candidate will take over Michel Temer in October general election. Indeed, international investors are always dubious about left-wing candidates. As an indication, CDS rates started to build upside momentum with the 10-year rates inching up to 272bps, while the 5-year one rose to 169bps.
Given the uncertainty generated by the political situation, investors will most likely stay away from Brazilian assets. In addition, the interest rate differential has narrowed significantly, as it decreased from around 12% in 2017 to around 5.8% today, making carry trade less interest especially in such an environment.
Japan balance of payment is taking off amid higher consumer confidence
Though an inflation below its 2% target (1.50% as of February 2018) adding up with the challenging task of changing its population’s “deflationary” state of mind, Japan economy remains solid. Following recent modest slowdown in first quarter Tankan manufacturing indicator (given at 24 while previous estimated at 25), Japan recent data releases are pleasing, starting with February balance of payments that recovers from recent December 2017 – January 2018 declines, given at JPY 2’076 billion (USD 19.5 billion), valued above its 2 years average of JPY 1’723. Largest contributors being for instance Goods and Services +3’114 (previous: -8’348). Though a slight decline in business sentiment and weak private consumption in February (monthly retail sales at +0.40%), Japan consumer confidence remains strong for the month of March, in line with previous month number of 44.3 and remaining at 5 years highs, thus confirming the view of a rather strong economic growth potential.
Suffering from continued currency appreciation, Japan current challenge lies in devaluing its currency, despite continued dovish monetary policy initiated by Bank of Japan Governor Kuroda who maintains the key rate in the range of 0% – -0.10% since February 2016, a measure that seems to falter since the beginning of 2017 (USD/JPY: -8.54%). Accordingly, USD/JPY currently trading at 106.98 is expected to continue its bullish trend started in March 25th, bouncing off from 104.56 low and approaching hourly resistance given at 107.90 (14/02/2018 high). Expected to head along the 107.25 range in the short-term.
EUR/JPY Bullish Zig-Zag Targeting 132.40
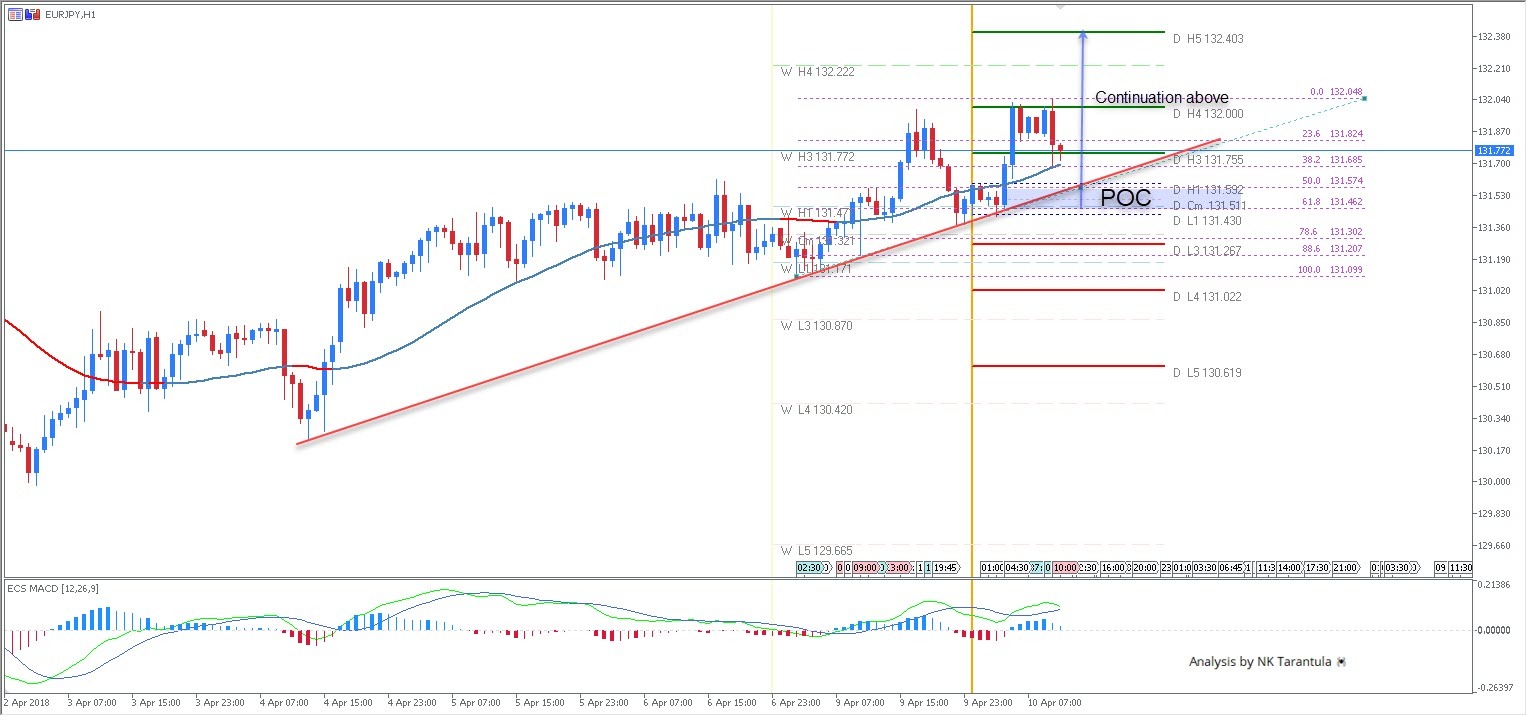
The EUR/JPY has been following both the ascending trend line and the EMA perfectly and we might see the uptrend continuation. POC zone 131.50-60 could reject the pair on retracement. However if we don’t see any retracement pay attention to 131.75 rejection towards 132.00. Only above 132.00 we might see 132.40 that is D H5 – strong daily resistance. As long as the pair is kept above 131.25, bulls should be safe.
W L3 - Weekly Camarilla Pivot (Weekly Interim Support)
W H3 - Weekly Camarilla Pivot (Weekly Interim Resistance)
W H4 - Weekly Camarilla Pivot (Strong Weekly Resistance)
D H4 - Daily Camarilla Pivot (Very Strong Daily Resistance)
D L3 – Daily Camarilla Pivot (Daily Support)
D L4 – Daily H4 Camarilla (Very Strong Daily Support)
POC - Point Of Confluence (The zone where we expect price to react aka entry zone)
China offered to cut surplus to US by USD 50b??
Bloomberg reported citing a "person familiar with the situation" regarding US-China trade tension. That "person" said China Vice Premier Liu He rejected US request to stop subsidizing business related to its "Made in China 2025" initiative.
Request from the US came after China offered to lower it's trade surplus to US by USD 50b. And that would be done by China buy more liquefied natural gas, agricultural products, semiconductors and luxury goods from the US. China's proposal also include opening the financial sector at a faster pace, giving US companies more access to the e-commerce markets.
In addition, that "person" said Liu said that President Xi Jinping is ready to fight back in Trump wants a trade war. And China is open to talks but won't initiate it.
Our views
It's yet another Bloomberg report with information from a "person". Bloomberg didn't even specify that it's from a Chinese government official. So, there is no way for us to judge whether is information is indeed from the US or from China. Even so, is it something that leaked, or made up, from Trump's own team?
For now, we don't believe that China has offered to cut the surplus to US by USD 50b. There is no urgency for China to offer anything. It takes from now to May 22 for Trump to collect public input on the tariffs on that USD 50b. What will the end-list be? It's a big unknown, not to mention that list of USD 100b of goods. Even if China would offer something eventually, would Xi want to drag the negotiation beyond the mid-term election in the US?
CHI50 Stock Index Heads Higher But Bears Still Sneaking Around
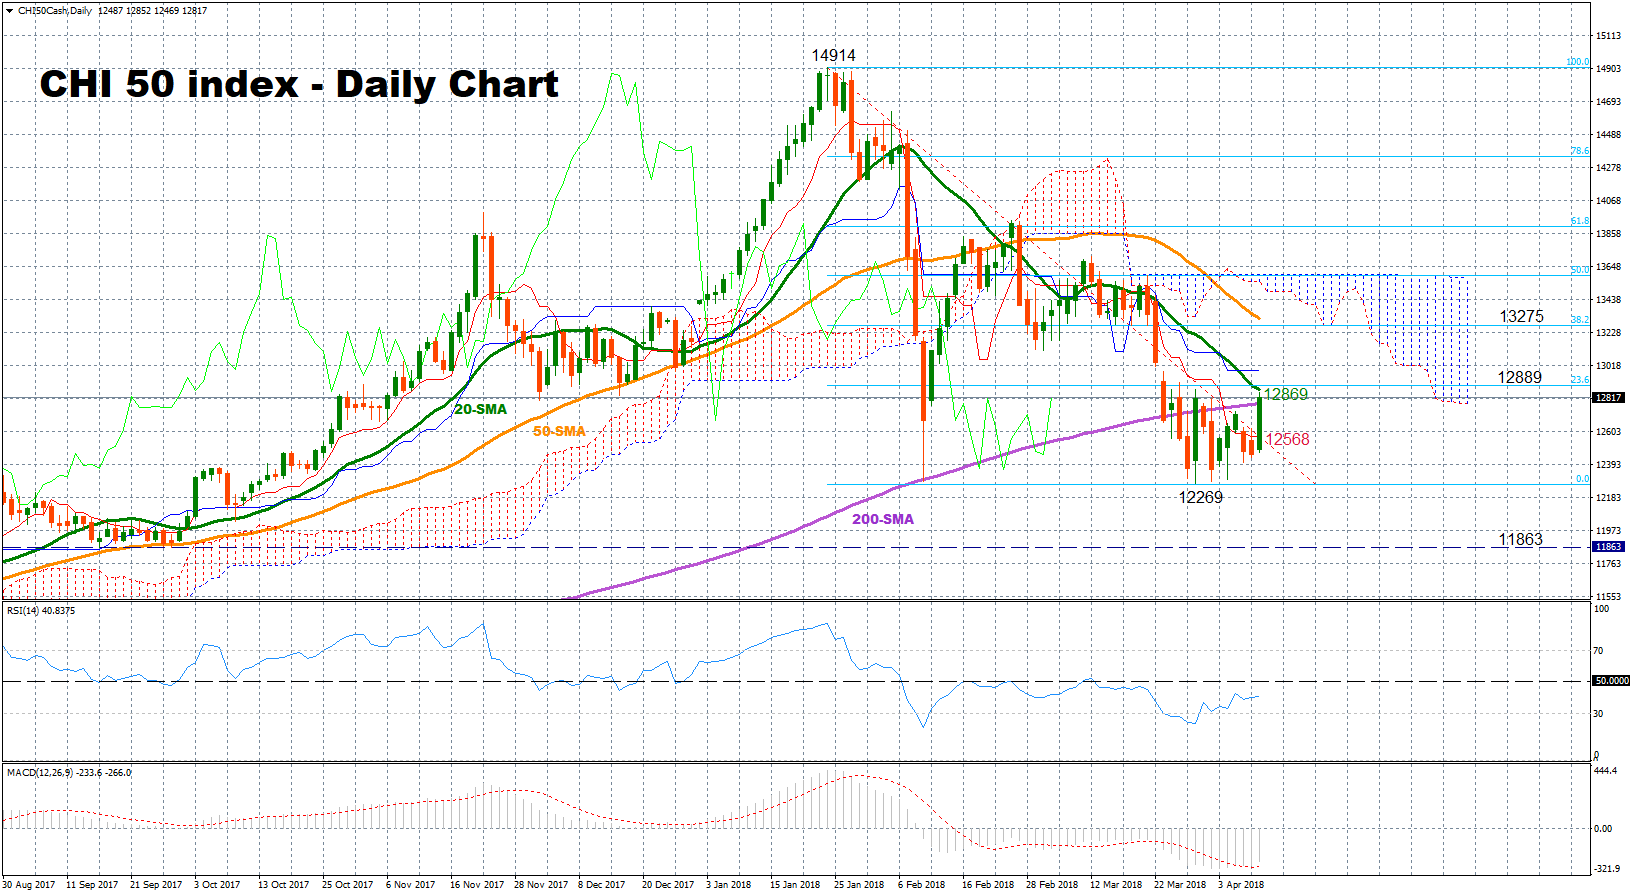
The China A50 stock index (CHI50) did little to gain ground after it hit a 5 ½-month low of 12,269 at the end of March, with the index posting moderate moves since then to create a base around that trough. The market is currently trying to surpass its 200-day simple moving average and the technical indicators are somewhat supportive but positive signals are too weak to paint a bullish picture.
The RSI is slowly moving to the upside and the MACD is increasing positive momentum above its red signal line but both indicators are still in bearish territory with the former holding below its neutral threshold of 50 and the latter trending below zero. Besides that, prices are fluctuating far below the Ichimoku cloud, while the 20- and the 50-day SMAs are currently pointing to the downside, hinting that the bearish picture is less likely to turn positive any time soon.
Should the index loose further strength, the red Tenkan-sen line at 12,568 could provide nearby support before the focus shifts back to the 5 ½ -month low of 12,269. If there is a move even lower, negative momentum could pick up speed, stretching the downleg started at the end of January towards 11,863, a level last visited in September.
Alternatively, if the market shows improvement, the index could meet a strong barrier at the 23.6% Fibonacci of 12,889 of the downleg from 14,914 to 12,269, where the 20-day SMA is also located. Any break above this previous support and resistance level could see the blue Kijun-sen line at 12,989 coming into view before there is a retest at the 38.2% Fibonacci of 13,275 which was also frequently congested in the past.
In the medium-term, the outlook is still bearish given that prices continue to trade below the 50-day SMA. However as long as the bullish cross between the 50- and the 200-day SMA remains in place, upside movements cannot be ruled out yet.
Encouraging Signs In The US-China Trade Conflict
Following the escalation of the US-China trade dispute on Friday, we have seen two signs that support the picture that it is part of negotiations to reach a deal rather than Trump taking China into a trade war. We thus still expect the endgame to be a deal between the US and China and that the situation will be resolved without a trade war.
First, over the weekend Trump tweeted that he and Xi Jinping would always be good friends and that a deal would be made on intellectual property. This was a clear softening after Trump escalated the situation by tripling the amount of Chinese imports that would be taxed at the border. China called Trump 's bluff, though, and warned sharply that it would retaliate any measures from Trump and reminded him that China has an army of 1.4 billion consumers ready to fight a trade war - indicating that a consumer boycott of US goods could very well be the result if Trump does not back down.
Second, Xi Jinping overnight promised a further opening and promised a reduction of tariffs on cars and other goods. He urged for ‘dialogue rather than confrontation' and stated China would also enhance proposals to increase imports, reduce limits on ownership of foreign companies in a range of sectors and enhance the protection of intellectual property rights.
While these measures have been planned in China for some time, the pressure from US and EU is probably pushing China to implement this. China's vice-premier and economic architect Liu He at the World Economic Forum in Davos signalled that China would surprise the world by the speed at which it would open up further. Reform and opening is high on the agenda in the year of the 40th anniversary of the ‘Reform and Opening' policy started in late 1978 by China's new leader at the time, Deng Xiaopeng.
In his speech Xi Jinping also continued the path laid out at last year's World Economic Forum in Davos when he warned of protectionism and spoke in favour of free trade and global cooperation. Xi Jinping said that ‘the Cold War mentality and zerosum game are increasingly obsolete' and ‘only by adhering to peaceful development and working together can we truly achieve win-win results'. The concept of win-win cooperation is repeated again and again by Chinese leaders and a strong part of their mind set.
No doubt the world will be watching China closely. However, we are cautiously optimistic that China will follow through on its words, as reforms have moved to the top of the agenda. Xi Jinping has a strengthened mandate and more power to push through the reforms he has outlined for some years.
We will likely still see ebbs and flows in the trade dispute but we see the recent developments as a positive sign that both countries want to find a solution and strike a deal rather than go into a trade war.
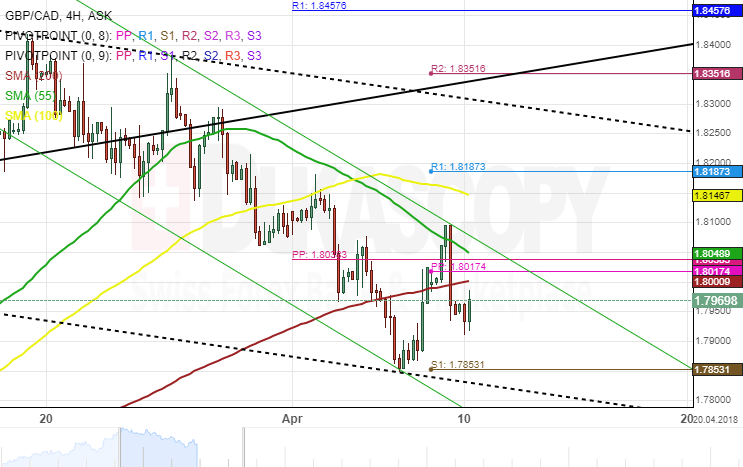
GBP/CAD 4H Chart: Breakout Likely
The price movement of the GBP/CAD currency pair has been steered by a junior descending channel. The pair tested the upper boundary of the junior pattern on March 19 and followed by a new wave down.
The combination of the 55– and 100– hour simple moving averages have been pressurizing the exchange rate lower after a crossed over of the SMAs on April 4. Furthermore, the pair has breached both the monthly and the weekly PPs near the 1.8017 area.
Everything being equal, a breakout is expected through the lower boundary of a dotted trend-line during the following trading sessions. Technical indicators suggest that bears are likely to grow stronger within the following days.
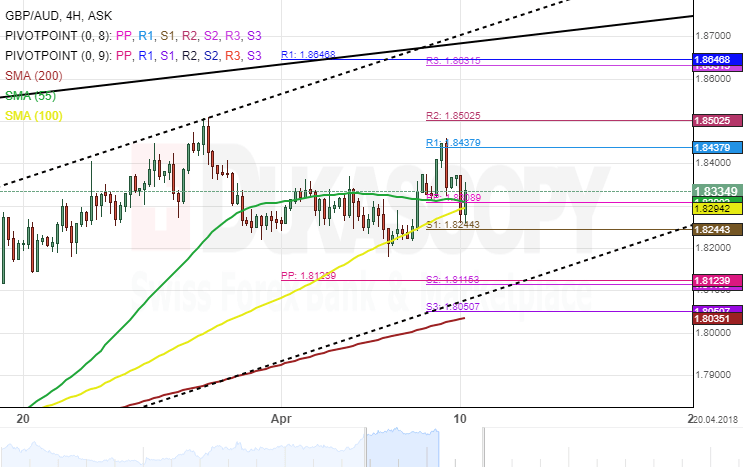
GBP/AUD 4H Chart: Bullish Momentum Continues
The British Pound has been trading in an ascending channel against the Australian Dollar since early September 2017. The currency pair bounced off the bottom border of the channel on September 8 and has since reached a one year high.
The GBP/AUD exchange rate tested the upper boundary of a junior pattern and currently retracing south. Meanwhile, the pair has breached the weekly pivot point and the 55– hour simple moving average near 1.8808.
As for near future, the currency exchange rate is likely to continue moving to the upside. However, the aforementioned retracement is expected to find a support cluster set by the combination of the weekly and the monthly PPs near the 1.8123 mark.
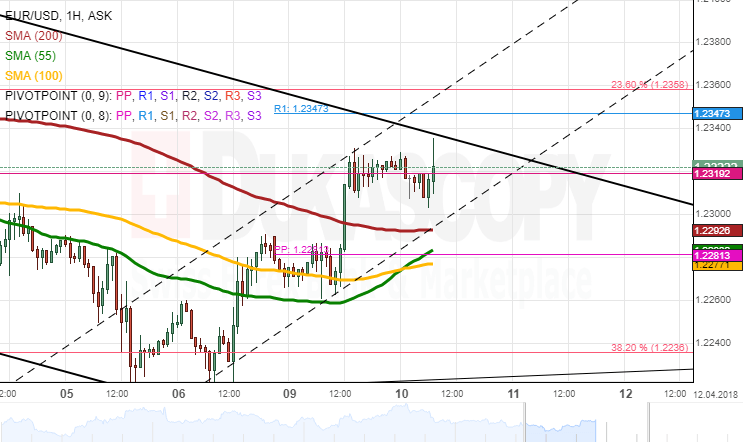
EURUSD Analysis: Respects Prevailing Patterns
The common European currency has been steadily appreciating against the US Dollar for the third consecutive session. This movement has been confined in two opposing channels.
Except for a 56-pip surge, the equal force of bulls and bears maintained the rate steady on Tuesday. The Asian session did not introduce massive changes, as the Euro remained lingering slightly below the upper boundary of the senior channel and the monthly PP at 1.2320.
It is likely that the bearish sentiment guides the pair today. Even if the senior channel is not respected, a move above 1.2360 is unlikely. Instead, the pair should approach a support cluster set by the 55–, 100– and 200-hour SMAs and the weekly PP at 1.2280. This level is expected to hold in case the US PPI at 1230GMT does not change this assumption.
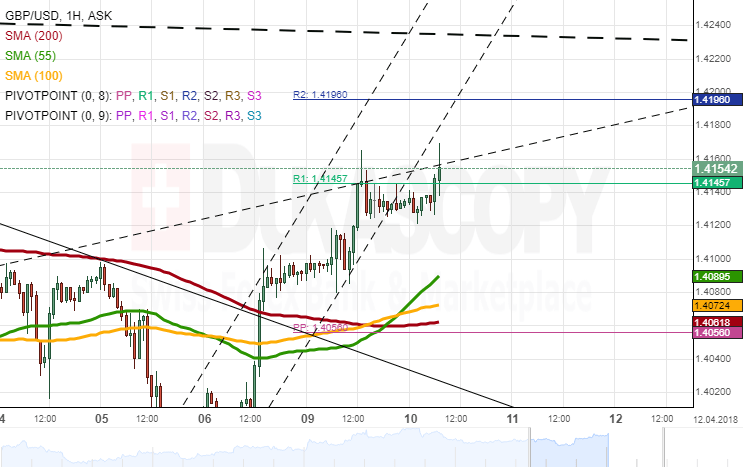
GBPUSD Analysis: Restricted By Weekly R1
Despite flashing bearish signals early on Monday, the Sterling managed to maintain its high positioning against the US Dollar and even push higher during the previous session.
As a result, the pair was trading near the weekly R1 and a minor trend-line at 1.4140 this morning. Apart from this resistance, the Pound is constrained by the weekly R2 and a medium-term trend at 1.42 and 1.4240, respectively.
Technical indicators have already started to move lower; thus, the given pair is expected to follow any time soon. The daily low should remain the same as yesterday—the 1.4055/80 territory where the 55-, 100– and 200-hour SMAs and the weekly PP is located.
This support is likely to provide a strong barrier for several sessions, as the 55– and 100-period SMAs on the 4H time-frame are likewise located there.
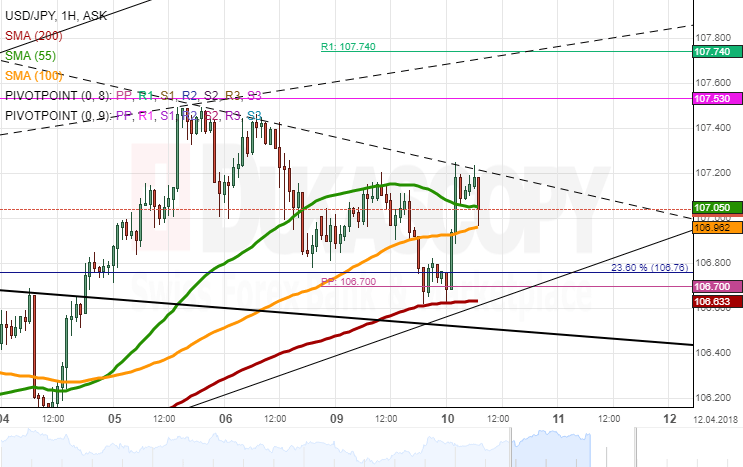
USDJPY Analysis: Surges In Asian Session
USD/JPY remained in between the 55– and 200-hour SMAs on Monday. During the first part of the day, the US Dollar tried to surpass the former and thus re-test a March high at 107.50.
Lacking the necessary upside momentum, bulls gave up their positions and allowed for a fall down to the long-term moving average, the weekly PP and the 23.60% Fibonacci retracement. The pair gained strong upside momentum early this morning, as comments by the Chinese President diminished considerably demand for the Yen as a save-haven currency.
A surge could be a possibility today, especially if the 55– and 100-hour SMAs have been surpassed. The nearest point of resistance is the monthly R1 a 107.50. The weekly R1 is likewise located nearby. Conversely, a decline should not exceed the 106.70 level.