Sample Category Title
Gold Analysis: Trades In Two Patterns
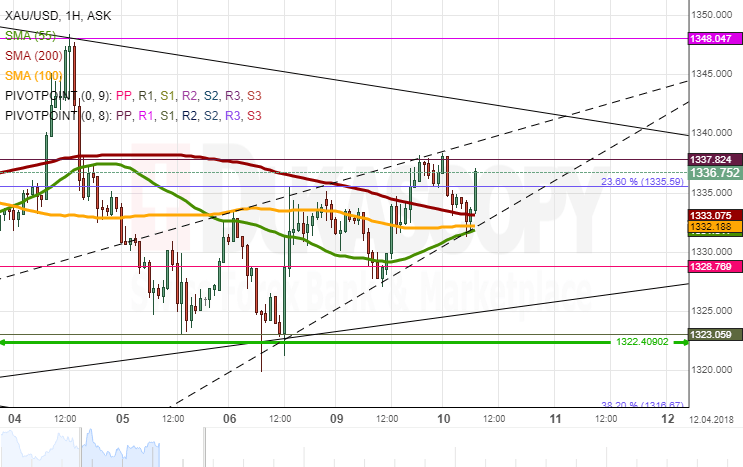
Gold demonstrated high fluctuation against the Greenback on Monday. The pair was moving along the lines of the 55– and 200-hour SMAs prior to breaching the latter to the upside.
As apparent on the chart, the rate's movement has been bounded in two patterns, namely, a descending triangle and a short-term ascending wedge. The pair was testing the latter's bottom boundary near 1,330.00, which also coincides with the 55- , 100– and 200-hour SMAs, early today. It is likely that this level holds strong and provides upward pressure for the pair. The nearest resistance is set by the upper triangle line at 1,340.00.
If taking into account the pair's movement since late February, Gold should reverse from this level and initiate a new wave south down to the 1,322.40 mark later this week.
USD Dominance Stays Despite Twin Deficits and Threats to Sell Treasury
In IMF’s latest world FX reserve report*, central bank’s/ reserve managers’ demand for US dollar remained intact in 4Q17. This has not only reinforced the greenback’s dominant status as the world’s reserve currency, but also signaled other currencies still failed to gain widespread confidence due to the economic and/ or financial developments of the corresponding economies. Global central banks’ holdings of US dollar in their FX reserves dropped -0.8 percentage point to 62.7 in 4Q17, from a quarter ago. From a year- over- year basis, the composition fell -2.6 percentage points. From a broader perspective, USD’s share of reserve has fallen from over 70% in the early 21st century to a record low of 61.2% in 2013. The rapid decline after the 2008 Global Financial Crisis was driven by the Fed unprecedented QE program (virtually money printing in nature) which had caused confidence crisis over the credibility of USD. We did see gradual recovery of USD’s share to recent years’ peak of 65.7% in 2015 after the Fed confirmed the end of the 5-year QE program in October 2014. The remarkable 2.6-percentage point decline in USD’s share last year from 2016 mainly represents central banks’ shift in asset holding in order to minimize the impact of USD’s depreciation, instead of an attempt to replace the greenback with other currencies as the main reserve currencies.
The Euro
The distant second and third dominant currencies in global FX reserve are the euro and Japanese yen, respectively. Both were once considered challenging to USD’s status. Consider the euro, its rise in share since inception in 1999 has been at the expense of that of USD, but has never touched 30% so far. Once perceived a challenge to the greenback’s pre-eminence, confidence over the single currency has deteriorated after the European sovereign debt crisis. Although recent economic and financial indicators in the Eurozone as a whole suggest that the worst is behind us, a number of peripheral economies have continued to struggle with high deficit- to- GDP ratios and high unemployment. Reserve managers should remain vigilant when accumulating the euro.
Japanese Yen
Despite its exceptionally low interest rates and the lukewarm growth in the economy, Japanese yen’s share has increased for three consecutive years, from 3.5% in 2014 to 4.9% in 2017. We attribute this phenomenon to the hedging activities as the “cross currency basis” between Japanese yen and many other currencies has been wide. Indeed, RBA’s annual report (https://www.rba.gov.au/publications/annual-reports/rba/2017/) has revealed this. While JPY-denominated assets took up 67% of RBA’s FX reserve in 1H17, the contribution was greatly reduced to 4.8% after “forward FX commitments”- a FX swap operation undertaken by RBA so as to enhance returns on the portfolio- were adjusted. As suggested in the report, over the past several years, “when the cost of hedging currency risk is taken into account, yields on short-dated Japanese investments have generally exceeded those available in the other currencies in the Reserve Bank’s portfolio”. As a result, “the bulk of the foreign currency the Bank obtains from swaps against Australian dollars is Japanese yen”. Moreover, Bradley Jones, Head of RBA’s International Department, noted two weeks ago that “by leaning into a widening basis, reserve managers stand to both harvest additional yield in reserve currencies, and play a constructive role in rebalancing the market, thus encouraging the prudent hedging of cross-border capital flows”. This evidenced that the rising allocation in Japanese yen in global FX reserve has probably be driven by hedging activities, rather than the increase in confidence over the currency.
As US-China trade frictions intensify, one of the “predictions” is that China is going dump US government bonds as retaliation to the White House’ s tariffs. As the biggest foreign holder of US Treasuries, it appears that the move would be disastrous for the US during the time when the country is in need to finance its federal deficits. However, we regard this as a bargaining chip in the upcoming trade negotiation. Indeed, the latest data (http://ticdata.treasury.gov/Publish/mfh.txt) shows that that China has held US$1.17 trillion worth of Us Treasury securities as of January 2018. Despite dropping -1.4% from the prior month, holding marks a +11.1% from the same period last year. As the biggest exporter to the US, China has earned a massive and lucrative amount of foreign currency in USD. The most secure and convenient channel to invest the money is via Treasury securities. As such, the act of dumping US Treasuries is no less than shooting itself in the foot.
*Currency Composition of Official Foreign Exchange Reserves (COFER): http://www.imf.org/en/News/Articles/2017/03/31/pr17108-IMF-Releases-Data-on-the-Currency-Composition-of-Foreign-Exchange-Reserves
Risk Sentiment Boosted By Xi’s Speech, US PPI Due
Here are the latest developments in global markets:
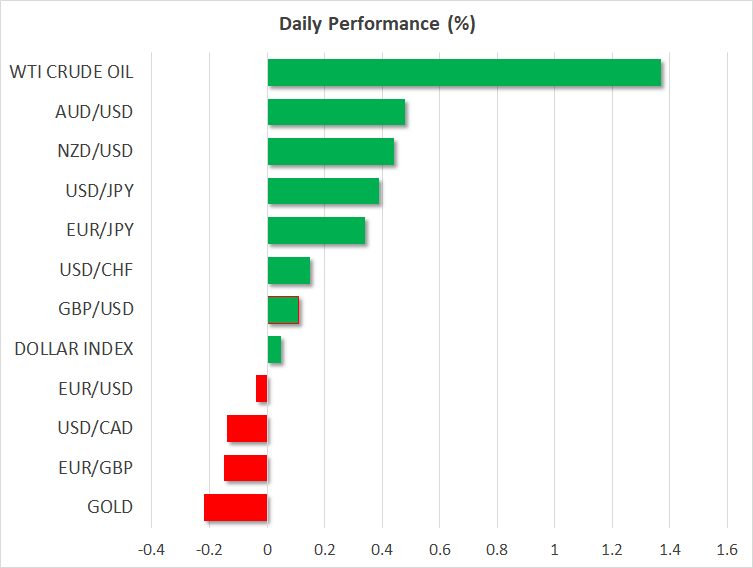
FOREX: The US dollar index, which tracks the greenback's performance against a basket of six major currencies, was practically unchanged on Tuesday. Against the yen, the dollar was nearly 0.4% higher though, after some comments from Chinese President Xi Jinping boosted risk appetite, curbing demand for the safe-haven Japanese currency.
STOCKS: US markets managed to close higher on Monday, but importantly, the major benchmarks gave back most of their earlier gains a few hours before Wall Street closed, following a report that the FBI had raided the offices of President Trump's lawyer. The Nasdaq Composite rose by 0.5%, while the S&P 500 and the Dow Jones advanced by 0.3% and 0.2% respectively. That said, futures tracking the Dow, S&P, and Nasdaq 100 are pointing to a much higher open today, most likely to due to some constructive remarks by Chinese President Xi Jinping earlier. This optimistic sentiment was evident in Asian trading on Tueaday. In Japan, the Nikkei 225 and the Topix gained 0.54% and 0.35% correspondingly, while in Hong Kong, the Hang Seng climbed by 1.8%. In Europe, futures tracking the major benchmarks were flashing green as well.
COMMODITIES: Oil prices rallied on the back of the broader risk-on environment. WTI and Brent crude are both 1.4% higher today, extending significant gains from yesterday, amid speculation that Sino-American trade tensions are set to subside moving forward. Later today, oil traders will turn their sights to the weekly API crude inventory data at 2030 GMT, which will provide a fresh indication on the state of US production. In precious metals, gold prices fell 0.2% as trade fears moderated, diminishing the appeal of the safe-haven metal.
Major movers: Risk appetite recovers after Xi Jinping avoids trade provocations
Overnight, a speech by Chinese President Xi Jinping calmed the nerves of investors regarding any further escalation in the US-China trade spat. Speaking at the Boao Forum for Asia, Xi pledged to open up China's economy further, to lower import tariffs, and to strengthen intellectual property protection. Perhaps most importantly, he avoided any provocative comments about trade and protectionism, all of which helped risk sentiment to recover as the probability of a full-blown trade war was seen as declining.
The trade-sensitive antipodean currencies rallied on the back of these remarks, with aussie/dollar and kiwi/dollar both rising by more than 0.4%. Meanwhile, safe haven assets such as the yen and gold retreated. Dollar/yen and euro/yen rose by 0.4% and 0.35% respectively. Meanwhile, stocks in Asia surged, while US equity futures jumped as well.
US stocks surrendered most of their early gains on Monday, with the S&P 500 closing just 0.3% higher, after advancing nearly 2.0% earlier in the session. The catalyst for the pullback were reports that federal agents had raided the offices of President Trump's lawyer, Michael Cohen. The raid brought political concerns back to the surface, by reminding investors that the Mueller investigation is still ongoing and that numerous risks besides a trade war still loom.
The euro surged yesterday on the back of some optimistic remarks by ECB President Mario Draghi. The ECB chief noted that despite some weakness in recent economic surveys, the Bank expects the pace of economic expansion to remain strong in 2018. The implicit message was that the recent loss of momentum in the economy is unlikely to derail the ECB's tightening plans, unless of course the slowdown intensifies much further.
Day ahead: US producer prices on the agenda
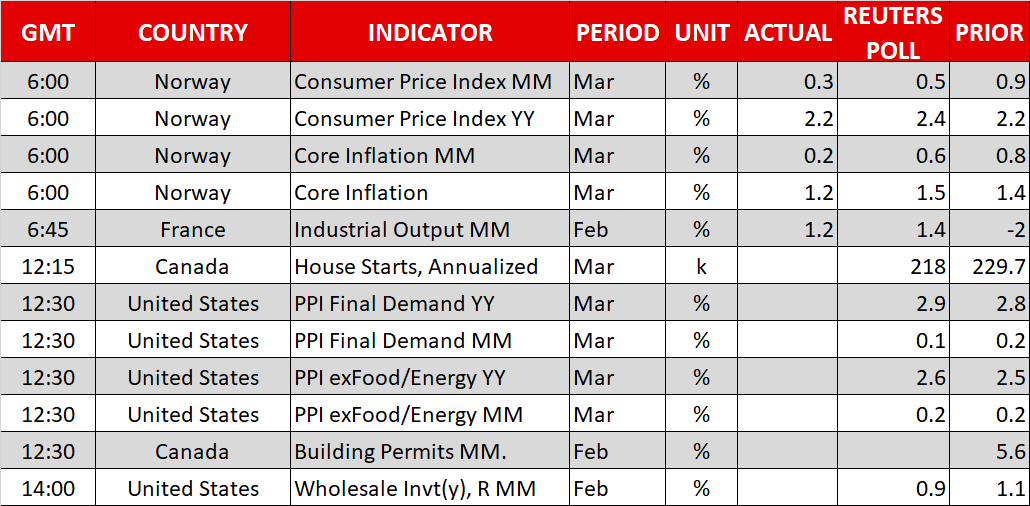
US producer prices for the month of March due out at 1230 GMT will probably generate most attention out of Tuesday's economic calendar, before attention shifts tomorrow to another gauge of inflationary pressures, namely to consumer prices for the same month. Wholesale inventory data for February are also on the agenda on Tuesday out of the world's largest economy, scheduled for release at 1400 GMT.
At the same time as US PPI figures (1230 GMT), Canada will see the release of building permits data for February, while a little earlier (1215 GMT) the print on housing starts for the month of March will be made public.
In oil markets, API data on crude stocks are due at 2030 GMT.
Any developments on global trade can spur positioning in equity markets; it remains to be seen whether positive sentiment will be maintained following the soothing remarks by Chinese President Xi Jinping. Also of interest will be Facebook CEO Mark Zuckerberg's testimony before Congress on Tuesday and Wednesday in relation to data privacy leaks.
Policymakers making appearances include Dallas Fed President Robert Kaplan (non-voter), Bank of England Chief Economist Andy Haldane and European Central Bank policymaker Ewald Nowotny. The former two are scheduled to speak at 0830 GMT, while no specific time was released for the latter whose comments might be of most interest given that he will be talking about the ECB's plans to end its massive stimulus program later this year.
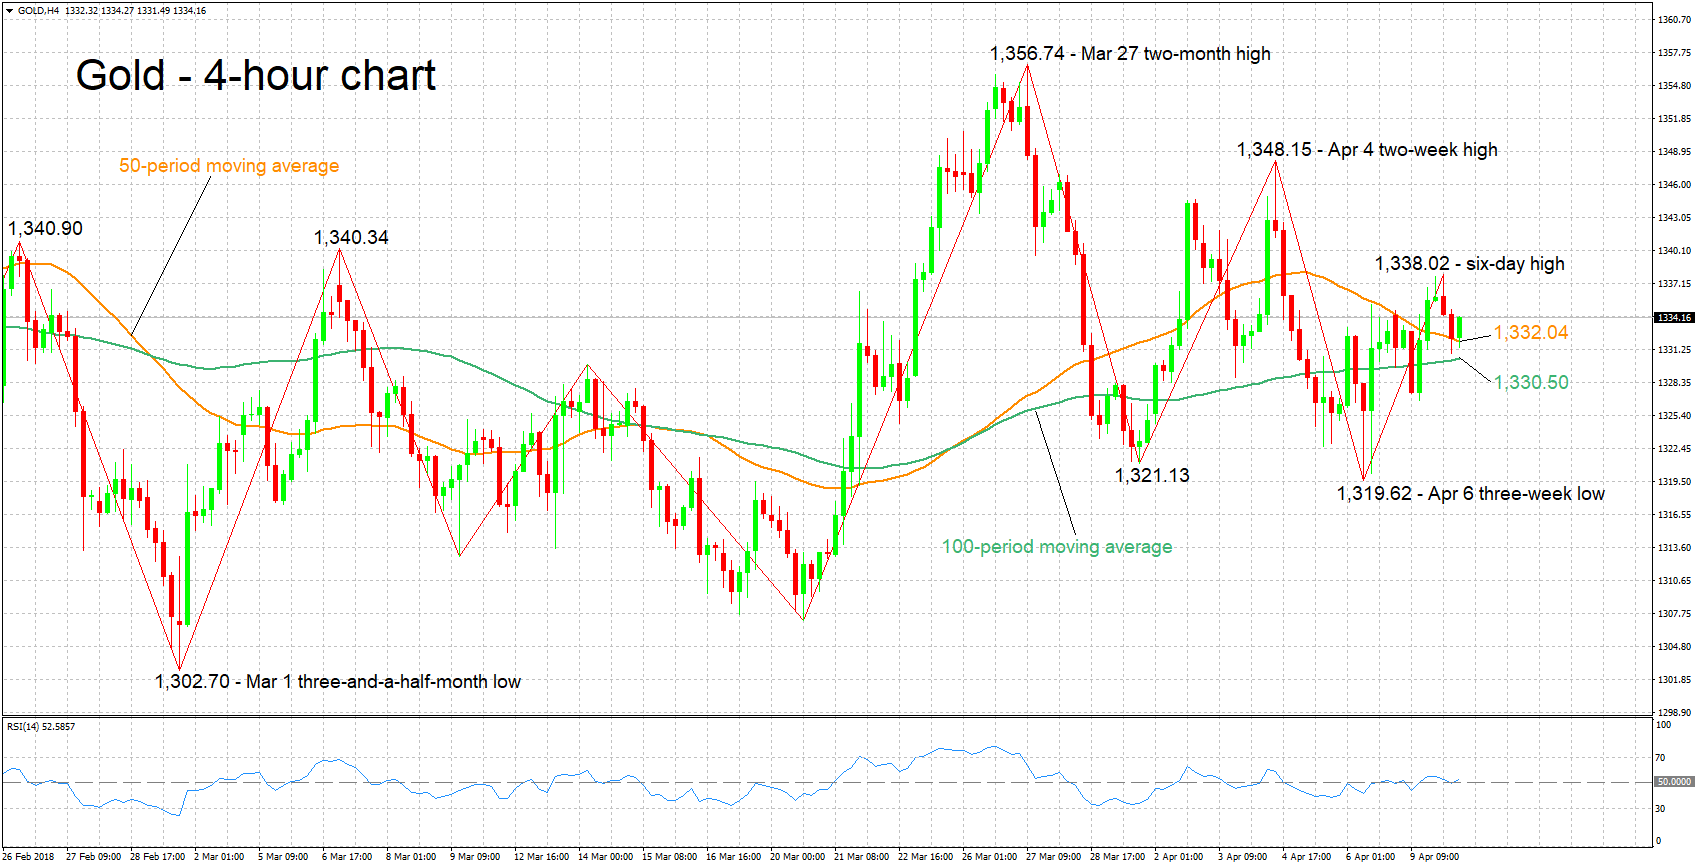
Technical Analysis: Gold looking neutral in the short-term
Gold has retreated somewhat after hitting a six-day high of 1,338.02 earlier on Tuesday. The RSI is hovering around the 50 neutral-perceived level, supporting the absence of momentum in either direction – the upside or the downside – in the short-term.
Rising trade uncertainties could boost the perceived safe-haven asset, with resistance in case of advances potentially coming around the six-day high of 1,338.02 recorded earlier; the area around this level includes a couple of peaks from the recent past as well.
Conversely, receding trade tensions could lead to declines as investors seek riskier assets. Support could be taking place at the moment around the current levels of the 50- and 100-period moving averages at 1,332.04 and 1,330.50 respectively.
A catalyst supporting the greenback also has the capacity to weaken the dollar-denominated metal and vice versa.
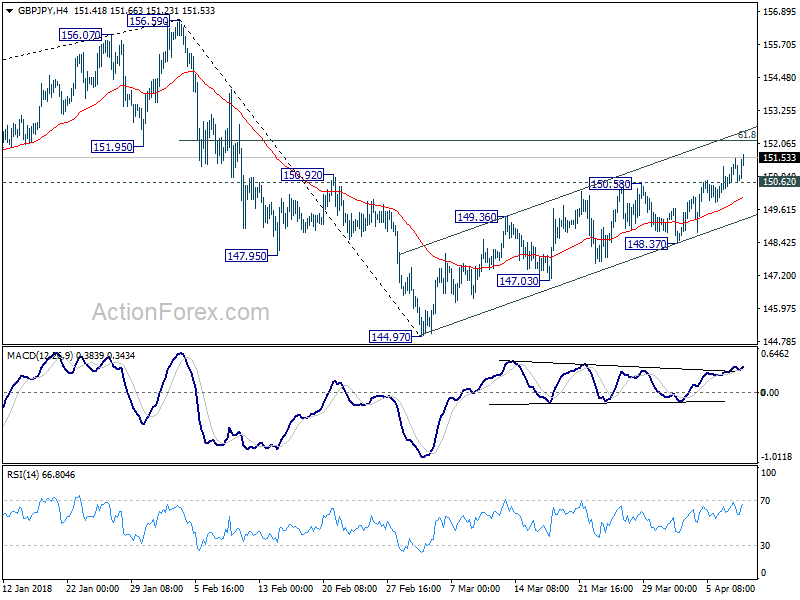
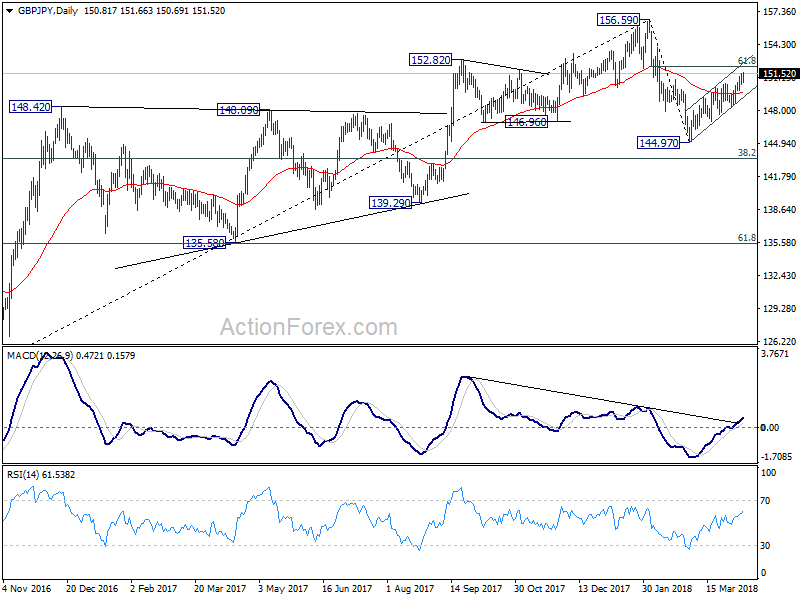
GBP/JPY Daily Outlook
Daily Pivots: (S1) 150.39; (P) 150.94; (R1) 151.39; More...
Intraday bias in GBP/JPY remains on the upside for 61.8% retracement of 156.59 to 144.97 at 152.15 and above. or now, price actions from 144.97 are still seen as corrective looking. Hence, we'll look for sign of loss of upside momentum as it approaches 156.59 high. On the downside, below 150.62 minor support will turn intraday bias neutral first. But break of 148.37 is needed to confirm completion of the rebound. Otherwise, near term outlook will remain cautiously bearish in case of retreat.
In the bigger picture, the outlook is turning mixed again. On the one hand, the cross was rejected by 55 month EMA (now at 154.20) after breaching it briefing. On the other hand, there was no sustainable selling pushing it through 38.2% retracement of 122.36 to 156.59 at 143.51. The most likely scenario is that GBP/JPY is turning into a sideway pattern between 143.51 and 156.59. And more range trading would now be seen before a breakout, possibly on the upside.
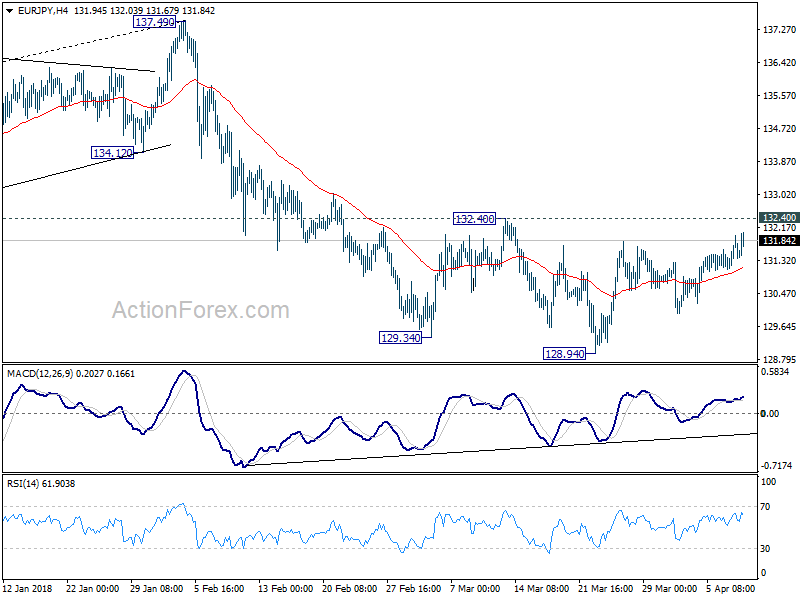
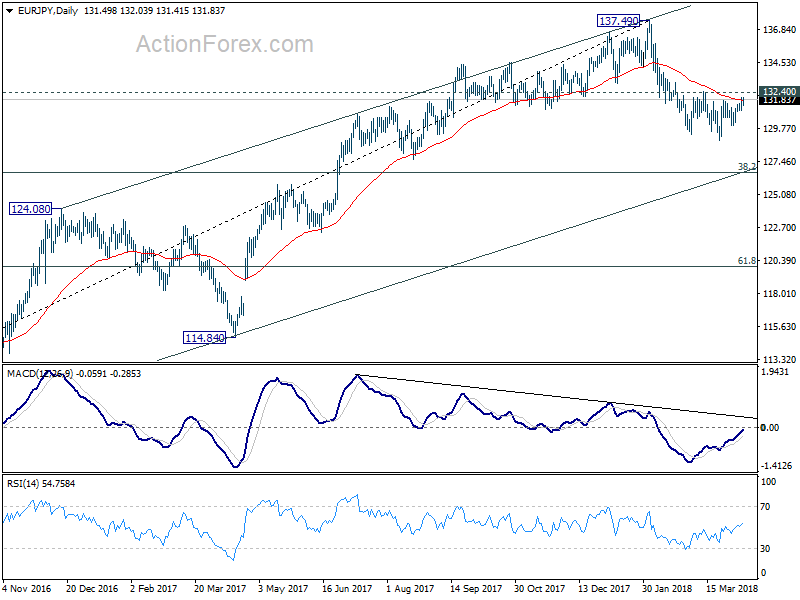
EUR/JPY Daily Outlook
Daily Pivots: (S1) 131.08; (P) 131.53; (R1) 131.97; More....
EUR/JPY is still bounded in range from 128.94 and intraday bias remains neutral. As long as 132.40 holds, near term outlook remains bearish for deeper fall. On the downside, break of 128.94 will extend the whole fall from 137.49 to 126.61 medium term fibonacci level next. Nonetheless, break of 132.40 should confirm short term bottoming and turn bias back to the upside for stronger rebound.
In the bigger picture, current development argues that rise from 109.03 (2016 low) has completed at 137.49, on bearish divergence condition in weekly MACD. Deeper fall should be seen to 38.2% retracement of 109.03 to 137.49 at 126.61 first. Sustained break there would pave the way to 61.8% retracement at 119.90. On the upside, break of 132.40 resistance will indicate that the pull back is completed and bring retest of 137.49. But still, break of 137.49 is needed to confirm medium term rise resumption. Otherwise, outlook is neutral at best for consolidations.
EUR/GBP Daily Outlook
Daily Pivots: (S1) 0.8703; (P) 0.8712; (R1) 0.8727; More...
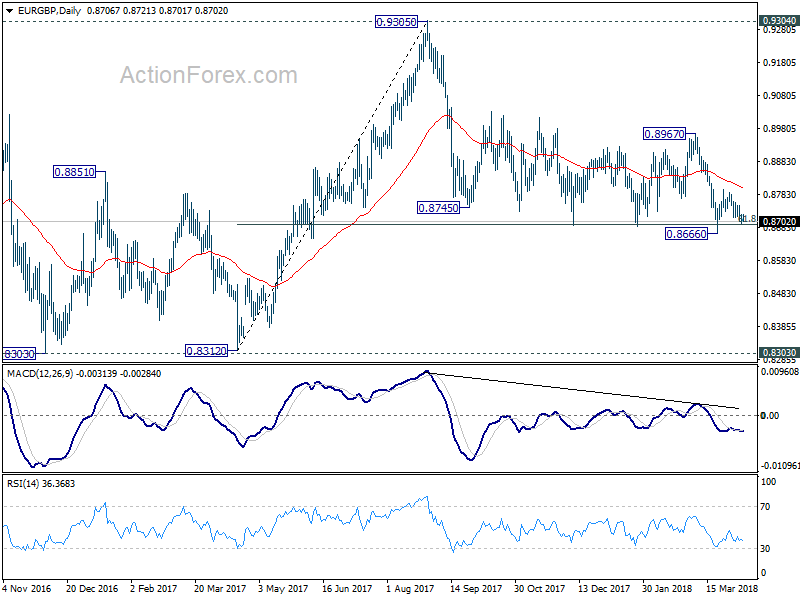
Intraday bias in EUR/GBP remains mildly on the downside for 0.8666 low. Decisive break there will resume whole fall from 0.9305. In that case, EUR/GBP should target 0.8303 key support next. On the upside, above 0.8749 will reaffirm the strong support from 0.8686 and turn bias to the upside for 0.8796. Break there will target 61.8% retracement of 0.8967 to 0.8666 at 0.8852 and above.
In the bigger picture, there are various ways to interpret price actions from 0.9304 high. But after all, firm break of 0.9304/5 is needed to confirm up trend resumption. Otherwise, range trading will continue with risk of deeper fall. And in that case, EUR/GBP could have a retest on 0.8303. But we'd expect strong support from 0.8116 cluster support (50% retracement of 0.6935 to 0.9304 at 0.8120) to contain downside.
EUR/AUD Daily Outlook
Daily Pivots: (S1) 1.5942; (P) 1.6001; (R1) 1.6056; More....
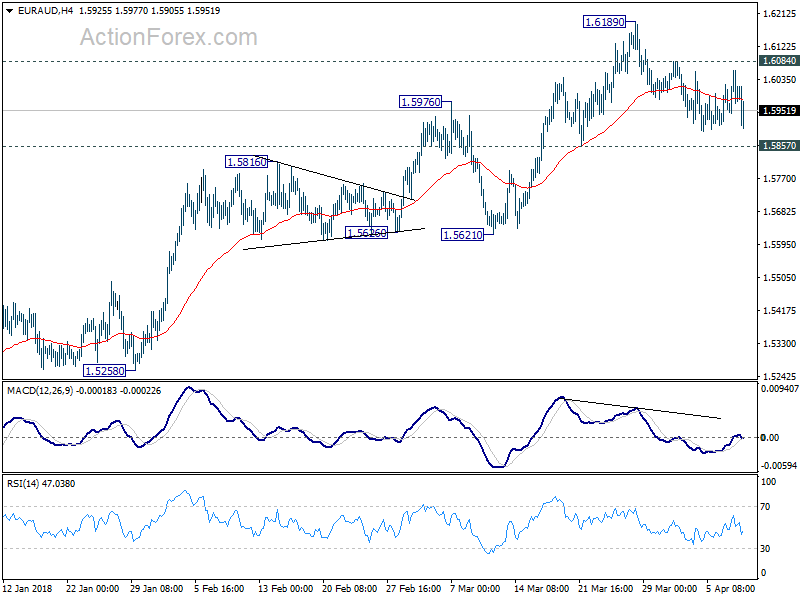
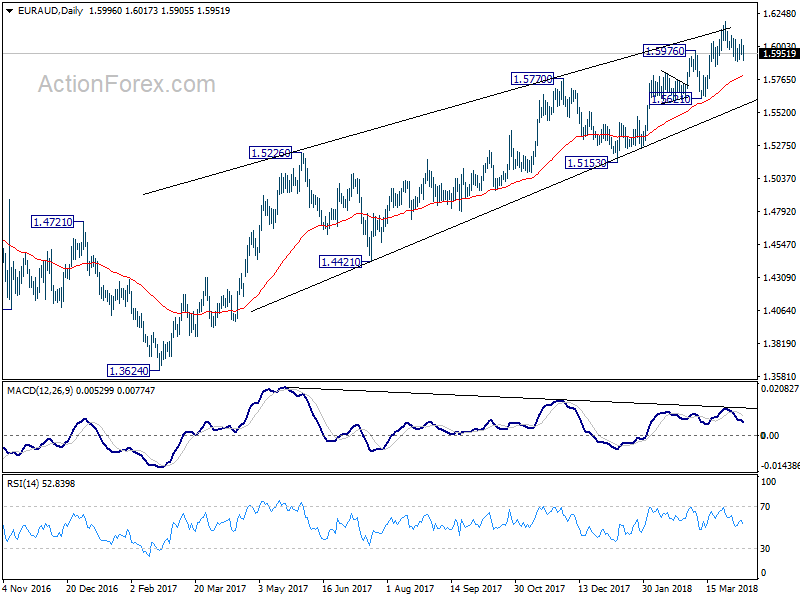
EUR/AUD is stuck in tight range of 1.5852/6084 and intraday bias remains neutral first. As long as 1.5857 minor support holds, further rally is expected in the cross. On the upside, above 1.6084 minor resistance will turn bias to the upside for retesting 1.6189 first. Break will resume larger rally towards 1.6587 key resistance. However, break of 1.5857 will be an early sign of trend reversal and turn bias to the downside for 1.5621 support to confirm.
In the bigger picture,rise from 1.3624 is not completed yet. And it's still in progress for 1.6587 key resistance level. We'd be cautious on strong resistance from there to limit upside, on bearish divergence condition in daily MACD. But for now, break of 1.5621 support is needed to be the first sign of medium term reversal. Otherwise, outlook will stays bullish even in case of deep pull back.
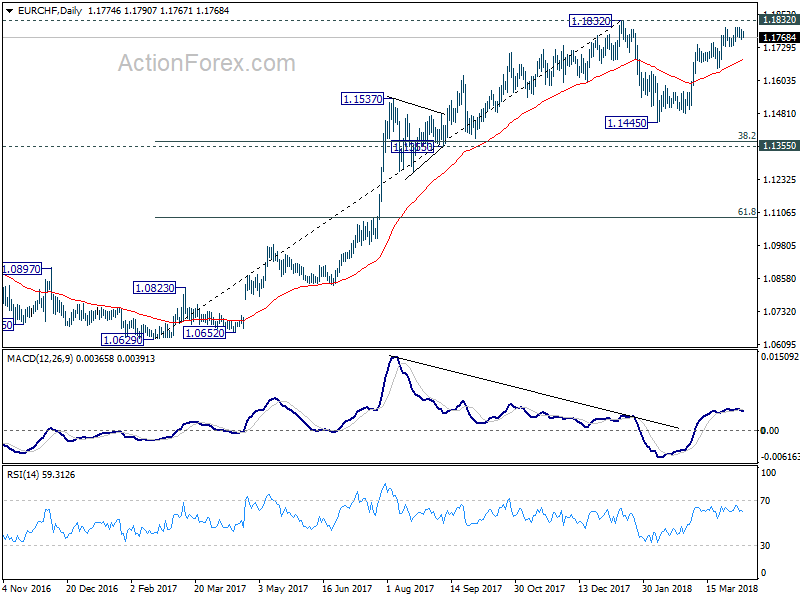
EUR/CHF Daily Outlook
Daily Pivots: (S1) 1.1764; (P) 1.1781; (R1) 1.1797; More...
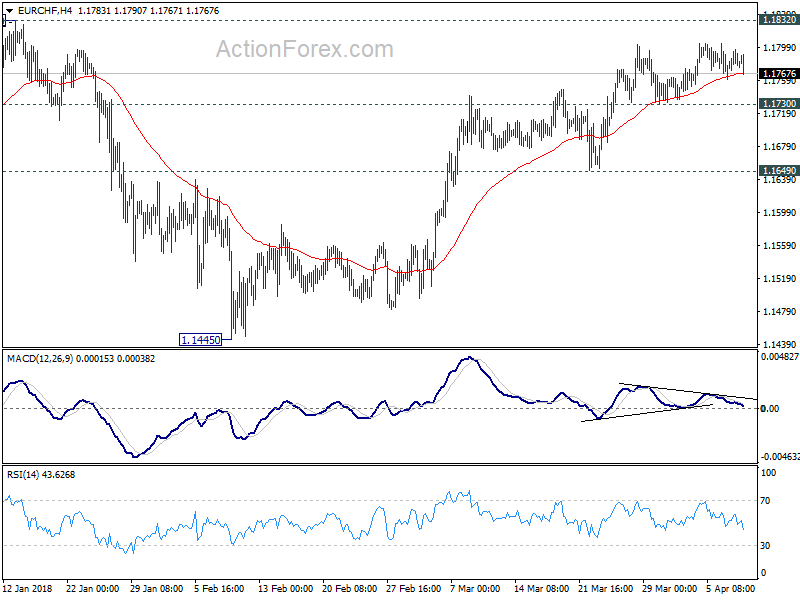
Intraday bias in EUR/CHF stays neutral first. Even in case of another rise, we'll remain cautious on strong resistance from 1.1832 to bring near term reversal. On the downside, below 1.1730 minor support will turn bias to the downside first. Further break of 1.1649 support will indicate completion of rebound form 1.1445. And the corrective pattern from 1.1832 would then have started the third leg to retest 1.1445. However, firm break of 1.1832 will confirm resumption of larger up trend.
In the bigger picture, a medium term top should be in place at 1.1832 on bearish divergence condition in daily MACD. But there is no indication of long term reversal yet. As long as 1.1198 resistance turned support holds, we'd still expect another rise through prior SNB imposed floor at 1.2000.
Forex Technical Analysis: EUR/USD, USD/JPY, GBP/USD
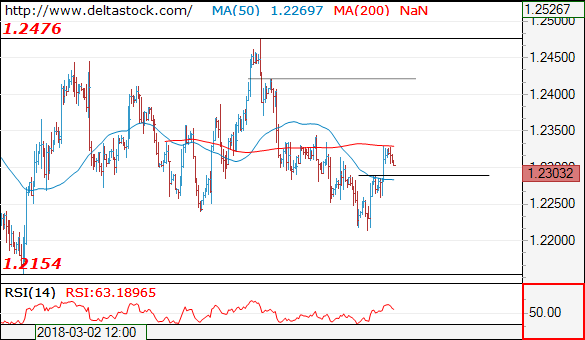
EUR/USD
Current level - 1.2303
The reversal at 1.2210 signals a completion of the slide since 1.4276 peak and the bias is bullish, for a rise towards 1.2420 area. Initial intraday support lies at 1.2290 and crucial on the downside is 1.2260.
| Resistance | Support | ||
| intraday | intraweek | intraday | intraweek |
| 1.2340 | 1.2560 | 1.2240 | 1.2160 |
| 1.2340 | 1.2560 | 1.2160 | 1.2090 |
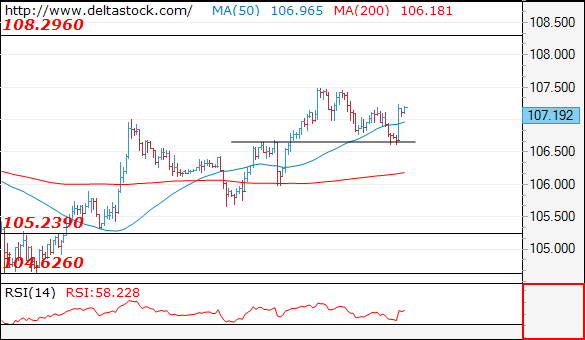
 USD/JPY
Current level - 107.19
My outlook here is positive above 106.60, for a rise towards 108.30 zone.
| Resistance | Support | ||
| intraday | intraweek | intraday | intraweek |
| 107.50 | 108.30 | 106.60 | 105.20 |
| 108.30 | 110.40 | 105.60 | 104.60 |
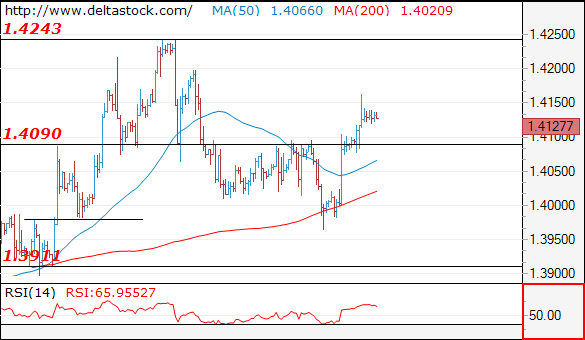
GBP/USD
Current level - 1..4127
The reversal at 1.3960 signals a finale of the whole slide since 1.4240 and the bias is bullish, for a rise towards 1.4200 area. Minor intraday support lies at 1.4120 and crucial on the downside is 1.4075 low.
| Resistance | Support | ||
| intraday | intraweek | intraday | intraweek |
| 1.4200 | 1.4280 | 1.4120 | 1.3910 |
| 1.4240 | 1.4340 | 1.4030 | 1.3710 |
Bank Of America Call Bitcoin The Biggest Bubble In History
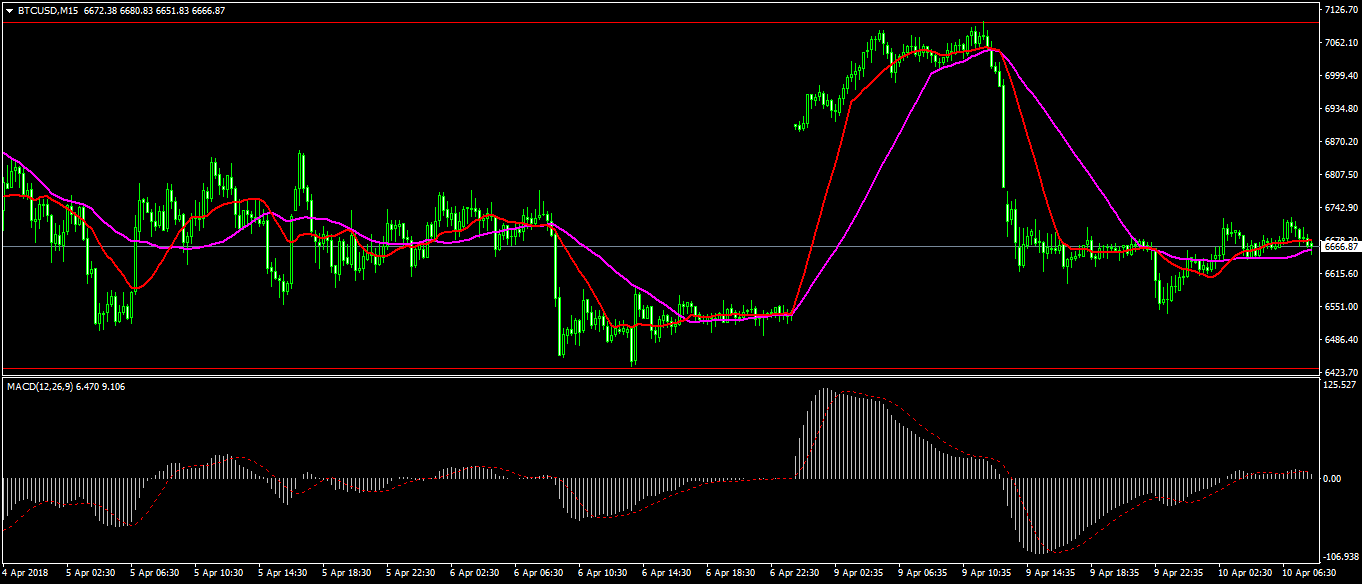
After rising to a high of almost $7,200 yesterday, the price of bitcoin reversed early today after Bank of America (BOA) released a report calling it the biggest bubble in history.
For months, BOA, the second biggest bank in the United States has been a vocal critic of bitcoin. In February, the bank warned that the currencies could pose a risk to its business because of their opaque nature. Later on, it barred clients from using its cards to buy and sell the currencies.
Yesterday's report came a few weeks before the tax filing season starts out. Analysts believe that American investors owe more than $25 billion in capital gains taxes after last year's gains. This selling pressure could have led to the weakness of the currencies in the past few weeks.
However, in reality, while bitcoin would cost investors billions of dollars, it would not match the trillions they lost during the dot com bubble and during the real estate bubble of 2018. Today, the total market capitalization of cryptocurrencies is about $259 billion. During the dot com bubble, investors lost more than $1.5 trillion.
Bitcoin is now trading at $6660, which is within the range it has been trading recently. The downward momentum the BTC/USD pair started has fizzled out and the pair is now in consolidation. With no major positive news, there is a likelihood that bitcoin will remain under pressure.