Sample Category Title
Trade War Anxiety and NFP Miss Sink US dollar
The US dollar is mixed against major pairs after the U.S. non farm payrolls (NFP) headline jobs number failed to meet expectations. The US added 103,000 jobs short of the 193,000 jobs forecast. Wage growth came in as anticipated at 0.3 percent to keep the pressure on the U.S. Federal Reserve to raise interest rates. Fed Chairman Jerome Powell spoke on Friday and reassured investors the central bank would be gradually increasing borrowing costs in the US. Chair Powell did not directly address trade tensions and its possible impact on the economic outlook as he deemed it is too early to quantify the impact.
- Despite the NFP headline number miss, US wages came in as expected
- Bank of Canada (BoC) Business Outlook Survey to give insights into rate path
- US inflation data to showcase lack of pressure on Fed
Fed Chief Maintains Gradual Rate Hike Speed Despite Jobs Miss
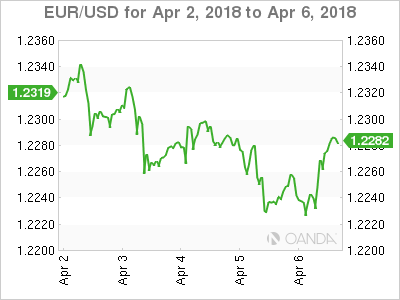
The EUR/USD lost 0.31 percent in the last five days. The single currency is trading at 1.2283 after gaining 0.36 percent on Friday, but not enough to offset the earlier gains of the USD. Trade tariffs have been a hot topic between the US and China. The White House issued a statement after market close on Thursday that asked the US Trade Representative to identify an additional $100 billion goods to be subject to tariffs. This comes after the initial $50 billion proposed tariffs by the US were met by China retaliating with a similar amount. Both nations have started World Trade Organization complaints.
 US fundamental data has been in the background as the White House has increased the protectionist rhetoric. The steel and aluminum tariffs were a shot across the bow that put exporting nations on alert. China has been singled out and have retaliated in kind to tariffs. The trade spat is expected to escalate as no party is giving ground in the dispute.
While the employment report came short of lifting the USD, next week will prove pivotal for the currency as inflation data will be released on Wednesday, April 11 at 8:30 am EDT. That same day at 2:00 pm the Fed will publish the minutes from its March meeting where it raised interest rates by 25 basis points.
Business Outlook Survey to Guide Bank of Canada
The USD/CAD lost 0.97 percent during the week. The currency pair is trading at 1.2777 after a strong Canadian employment report boosted the loonie against the greenback. Statistics Canada published a 32,000 job gain in March. Forecasts were around 20,000 positions and wages grew 3.1 percent year-over-year. The Bank of Canada (BoC) will be paying close attention to inflationary pressures, even as the unemployment rate remains steady.
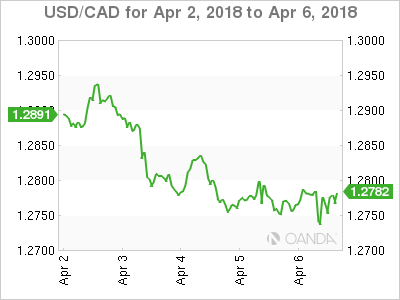 Canadian dollar weekly graph April 2, 2018
The central bank is not expected to hike until July given the slowdown in economic growth that started in the fourth quarter of 2017. Next week’s Business Outlook Survey by the BoC . The previous quarterly survey pointed to a positive outlook of the economy despite some moderation. There has been strong employment data over the first three months of the year but there might be some pessimism on trade, given the fact the NAFTA renegotiation was supposed to have been wrapped up by now. The BoC Business Outlook survey will be released on Monday, April 9 at 10:30 am EDT.
The BoC will meet on April 18, with the market not pricing in a rate hike until July despite the positive rumours on NAFTA. The Trump administration has put in a May 1st deadline and softened the tone on its demands. On the other hand the US has engaged in a war of words with China regarding trade. Canadian and Mexican officials have met in Washington and have not discarded a quick resolution even if most of the more contentious chapters of the trade agreement remain open.
Market Events to Watch this Week
Monday, April 9
- 10:30am CAD BOC Business Outlook Survey
Tuesday, April 10
- 8:30am USD PPI m/m
- 11:05pm AUD RBA Gov Lowe Speaks
Wednesday, April 11
- 4:30am GBP Manufacturing Production m/m
- 8:30am USD CPI m/m
- 8:30am USD Core CPI m/m
- 10:30am USD Crude Oil Inventories
- 2:00pm USD FOMC Meeting Minutes
- 8:30pm JPY BOJ Gov Kuroda Speaks
Thursday, April 12
- 3:00pm GBP BOE Gov Carney Speaks
*All times EDT
Australia & New Zealand Weekly: Gradual Decline in the AUD Expected to Continue through 2018
Week beginning 9 April 2018
- Gradual decline in the AUD expected to continue through 2018 as USD stabilises; commodity prices fall; and interest margins widen.
- RBA: Governor Lowe speaks, Financial Stability Review.
- Australia: Westpac-MI consumer sentiment, housing finance.
- NZ: retail card spending, house sales and prices.
- China: President Xi speaks, new loans, trade balance.
- Euro Area: industrial production, trade balance.
- US: CPI, FOMC meeting minutes.
- Key economic & financial forecasts.
Information contained in this report current as at 6 April 2018.
Gradual decline in the AUD expected to continue through 2018 as USD stabilises; commodity prices fall; and interest margins widen
Over the last few months the AUD has been generally weaker starting in early February at around USD0.80 and reaching USD0.765 during March. It is now hovering around USD 0.77.
This is broadly in line with Westpac's view that AUD will gradually weaken over the course of 2018 and 2019.
We retain our "targets" of USD 0.77 by June; USD 0.74 by December and USD 0.70 by end 2019.
It appears that AUD's 2018 peak will prove to be in late January.
At that time AUD was valued at USD 0.81 and the Trade Weighted Index was around 65.7. Since then the trade weighted index has fallen to 62.5 (down around 5%) while against the USD the AUD has fallen by 5.2%. This weakness in the AUD has coincided with some stability in the US Dollar with the USD Index (DXY) increasing by a modest 1%.
That stability in the USD over the last few months contrasts with 2017 when the Index fell by around 13.5%; while the AUD lifted from USD 0.72 to USD 0.81 or 12.5%.
Over the same period the Trade Weighted Index was relatively steady rising a modest 2.5% emphasising that most of the AUD's "strength " against the USD in 2017 was explained by USD weakness.
That period of excessive USD weakness reflected a solid boost in optimism around the world economy. "Risk on" was the catch cry and the "safe haven" USD was out of favour.
That boost in global optimism can be encapsulated in the movement in manufacturing PMI's over that period. Recently that positive euphoria around global growth appears to be fading.
Manufacturing PMI's stood out in 2017 as signalling strong contemporaneous global growth. However, movements in these PMI's have been less encouraging in 2018. The PMI's are estimated to have bottomed out around September 2016. The global manufacturing PMI lifted from 50.4 (September 2016) to 54 (December 2017 but has fallen) back to 53.2 (March). Respectively Europe (52.6; 60.6; 56.6); US (51.5; 55.5; 55.7); Japan (50.4; 54; 53.1) ; Korea (47.6; 49.9; 49.1)) and China (50.1; 51.5; 51.0) indicate that only the US PMI appears to be continuing the upswing we saw through 2017.
Trade tensions must be impacting confidence although there remains considerable uncertainty over the extent and timing of President Trump's trade policies. The 25% and 10% tariffs on steel and aluminium announced at the beginning of March were initially imposed on all countries, but subsequently rolled back to only a few nations, including China , although excluding Europe; Brazil; and Canada (among others). This exemption has been enough to hold the EU back from retaliating to date.
China has quickly become the sole focus of the trade debate with tariffs to be imposed on around $50bn of imports from China. Less than 24 hours after this announcement, China retaliated with planned tariffs on $3bn of US imports across 128 products. Further bi-lateral responses have followed. China can be patient and play "the long game" whereas the US, with mid-term elections rapidly approaching, is likely to "blink" before China needs to step back.
Recent developments in global financial markets also point to less of an appetite for the "risk on" trade. LIBOR and BBSW are rising; credit spreads are widening. Equity markets are falling – US down 9%; Europe down 8%; Japan down 12%; and Australia down 5.2% since late January.
One important explanation is the recent US tax changes which allow US corporates (in particular the cash rich technology companies) to direct funds (mainly US dollars) back to the US from foreign sources (total funds estimated at around $1.5 trillion without paying the onerous 35% tax rate). Foreign banks, including Australia, which had relied on this USD funding, have had to switch demand for funds to local markets, intensifying rate pressures. The "shortage" of USD offshore funds has boosted USD funding costs – LIBOR by around 25 basis points.
Most business borrowers will be affected by this increase in BBSW. One small bank even slightly raised its variable mortgage rate to reflect this 25 basis point increase in short term funding costs. Australian banks have also recently suffered increases in their funding costs in longer maturities with bank 5 year paper lifting by around 15 basis points compared to the risk free rate.
Credit growth has slowed to 3.8% annualised over the three months to February compared with 4.9% growth for 2017. This includes a slowing in housing credit growth from 6.3% in 2017 to 6.0% annualised over the past three months. Business credit stalled over the past three months, with 0.4% annualised growth, in contrast to a 3.2% increase in 2017.
Our core reasons for the further expected falls in the AUD centre around expected interest rate differentials and a downswing in commodity prices. We expect to see the cash rate differential between Australia and the US to widen to 112 basis points (from the current 12.5 basis points) by mid-2019; while the 10 year differential is expected to increase from the current 16 basis points to 40 basis points. These forces are also playing out in commodities. The iron ore price has fallen by around 20% since early February while the coking coal price is down by 15%.
A key issue here relates to the slowing in the growth of the shadow banking system in China (asset growth in the first two months of 2018 is down around 65% on 2017). Non-banks have been key financiers of local government (around 80% of infrastructure investment in China); property developers; and commodity speculators.
These forces can be expected to weigh directly on the AUD and will be most clearly signalled by movements in the TWI - note the 5.0% fall in the TWI since late January. However, if global sentiment recovers and starts to weigh on the USD these forces will be obscured when assessing the AUD in terms of the USD.
With this change in global sentiment signalling a neutral USD we can expect falls in the TWI and AUD/USD to be broadly in line with each other as has been the case since late January.
The week that was
This week has again been dominated by Sino-US trade frictions.
We started the week with news that China's previously-announced retaliation against the US' steel and aluminium tariffs had come into effect. The US subsequently outlined the 1300 or so Chinese goods that will be affected by their second tariff plan from late March (on $50bn of imports) to which China then responded by announcing their own second package of tariffs (on 108 US imports whose trade also totals $50bn). This additional package was crafted to show China's might – covering a key selection of US exports to China, from automobiles and planes to soya beans and beef – but also their restraint. On the latter, China again called for negotiations by stating that the new tariffs would only come into effect if the US continued with its plans.
As we have noted repeatedly, there is definitely scope for a positive outcome to this ruction. However, it requires the US to agree to negotiate and compromise. US authorities have generally sounded willing to do so over the past month. But a fresh request today by President Trump to consider tariffs on another $100bn of Chinese imports casts doubts on the intent of the administration. The more rounds of one-upmanship that occur between the US and China, the harder negotiations and resolution will become.
Turning back to Australia's economy, this week the RBA met, and we also received updates on retail sales; housing; and trade.
Starting with the RBA, in recent communications, the language used to describe the outlook for growth has been adjusted, from "averaging a bit above 3% over the next couple of years" in February to "faster in 2018 than it did 2017" in March. That second statement was then qualified in the March meeting minutes, with growth in 2018 still seen as exceeding potential (typically regarded as 2.75%). Come April, the decision statement again referred to the central forecast being for faster growth in 2018 than 2017; however, by then the 2017 outcome had been reported at just 2.4%. As noted by Chief Economist Bill Evans this week, with "this change in stance around the growth outlook, it is reasonable to assume that the next set of growth forecasts for 2018, which will be released on May 6 with the May Statement on Monetary Policy, will be for a lower forecast than the 3.25% we saw in February". This accords well with our view that growth will be near trend in 2018 and hence that the RBA will remain on the sidelines through 2018 and 2019. Another important point to note from the RBA statement is the reference to the tightening in financial conditions associated with the increase in USD short-term interest rates, which the Governor noted has flowed through to higher short-term rates in some other countries, including Australia. Whether this is a temporary or permanent phenomenon was not assessed, nor its eventual impact on the economy. See the previous page's essay for more detail.
On to the Australian data, retail sales for February provided a positive surprise this week. In the month, retail sales rose 0.6% against expectations of a 0.3% rise. The January outcome was also edged up from 0.1% to 0.2%. At 3.0%yr, annual growth is now the strongest it has been since July last year – albeit still well below its historic average. Discretionary spending drove the February result, and online retail continued its strong run. Looking ahead, the January/ February outcomes suggest growth in Q1 will be a step down from Q4 and also well below long-run average levels.
For housing, this week we received CoreLogic house price data for March and dwelling approvals for February. House prices continued to edged lower in March, leaving the national measure 1.4% lower than the October 2017 peak. By city, price weakness remains concentrated in Sydney, –2.1%yr. As for the nation, Sydney house prices have been harder hit, –3.8%yr, particularly at the top end – the top 25% of properties by value have fallen 6.5%yr after a period of outperformance. Elsewhere: Melbourne is still the strongest performer, 5%yr; price growth in Adelaide and Brisbane is negligible, and in Perth, it remains negative, –2%yr. Dwelling approvals meanwhile remain consistent with our expectation of further weakness over the coming year, declining 6.2% in the month of February to be down 3.1%yr. That said, conditions across the states continue to diverge, with Vic up 10–15%yr; NSW up 3%yr; Qld flat; and WA down 8–10%yr. This is also true by dwelling type, with high-rise approvals continuing to dominate the headline measure.
Finally on trade, February saw a second consecutive surplus of $0.8bn, a touch below January's $1.0bn. The key point from this release is that the Q1 trade position looks as though it will be a marked improvement from Q4, with net exports set to be broadly neutral for growth – as opposed to a material detractor. Related to the trade outlook, recent PMI's for the Asian region show China holding on to the gains of 2017/18, and many nations in the rest of Asia also faring well – most notably Japan. That said, there is a degree of fragility in these reports. China's PMI employment indexes have clearly turned down after underperforming the activity measures during the upswing. More broadly, export orders are also showing evidence of weakness across the region.
Chart of the week: Govt issuance and central bank purchases
In our April Market Outlook, we examine how recent changes in US policy will affect the current account imbalance.
A key dynamic set to weigh on the US trade deficit is the Fed's balance sheet normalisation. Asset purchases from the Fed have been a contributor to federal financing over the post-GFC period. Treasury purchases will now turn to redemptions with the Fed indicating that $230bn will roll off in 2018 and $270bn in 2019. This equates to a lower US supply of loanable funds and will need to be offset by a rise in US net saving or more likely a foreign capital inflow.
Attracting capital from overseas is likely to become more difficult given other major central banks are reducing their purchases. The ECB is expected to halt purchases in 2019, while the BoJ's increased share of the JGB market (46%) means they need fewer purchases to control the 10yr JGB yield - purchases in 2017 fell to ¥30tn from 2016's ¥80tn.
New Zealand: week ahead & data wrap
It was a relatively quiet week on the NZ data calendar. Broadbased strength in NZ export commodity prices supported another lift in the commodity price index, while whole milk powder prices unexpectedly ticked higher in the latest GlobalDairyTrade auction. Looking ahead to next week, we will get a read on how businesses sentiment is faring as the dust settles following the change of Government. Anecdotally, changes to labour laws and challenges finding the right staff remain key concerns for firms.
Commodity prices rose 1.2% in March, bringing prices to their highest level since 2014. For the rural sector, and the New Zealand economy more broadly, the real positive is probably the widespread nature of the strength in prices. Beef, lamb, seafood, horticulture and forestry prices are all at robust levels. And while dairy prices aren't at the front of the pack, recent dairy auctions have shown a lift in whole milk powder prices (a key determinant of the farmgate milk price). This week's result was a little stronger than we had pencilled in, pushing whole milk powder prices to the highest level since January, and supporting the firm $6.55 payout forecast for the current season.
The highlight for next week is likely to be the release of NZIER's latest Quarterly Survey of Business Opinion (QSBO). This is probably the most comprehensive read we get on the mood of New Zealand businesses. It's a useful indicator of how economic activity is shaping up in the first quarter of the year, and also gives us a read on demand for labour and capacity pressures both in the broader economy and the labour market.
Business confidence plunged in the wake of last year's election and change of government. Although monthly surveys of business confidence have shown some improvement, the level of confidence certainly remains well below levels seen prior to the election. When asked about the outlook for their own businesses however, firms are more upbeat. While the own activity measures in business confidence have also eased since the election, the fall has not been nearly as dramatic. Evidently, firms are much more confident in their own ability to continue to operate given the new political backdrop, than they are in the economy more broadly to adapt to the change.
Our view is that the more pessimistic outlook for the broader economy will lead firms to think twice about their forthcoming investment and hiring decisions. Anecdotally, the cloud of uncertainty surrounding how some of the Government's policies will be implemented has been relatively slow to clear. For example, firms cite the slow passage of the Employment Relations Amendment Bill (which amongst other things abolishes the 90 day trial period for workers at firms with more than 20 employees and introduces measures designed to allow unions better access to workers) as one source of lingering uncertainty. Questions over just what industry-wide fair pay agreements will entail also remain unresolved for some.
As a consequence of the drop in business confidence, our macroeconomic forecasts incorporate both a lull in business investment and slower growth in employment over the course of 2018 as firms wait for some of this uncertainty to dissipate. Workers seem to agree, with a slight drop in the Employment Expectations component of the latest Westpac McDermott Miller Employment Confidence Survey.
Of course changes to labour laws and the Government's policy of targeting a $20/hr minimum wage also come at a point in the economic cycle when firms are reporting significant challenges in sourcing both skilled and unskilled labour. In the QSBO these measures of difficulty finding labour have been trending into 'tighter' territory, most notably since around 2015, and we will be keeping a close eye on how these measures evolve in next week's release. Generally, the more difficult it becomes for firms to find the right person for the job, the more pressure we eventually expect to see on wage rates as firms are forced to pay up to attract the staff they need.
Aside from these standard market forces that play a role in setting wages, the government also plays its part by setting the minimum wage. The new Government's policy is to target a minimum wage of $20/hour by April 2021 (economic conditions permitting). The first step down the pathway to achieving this goal came through on 1 April, when the minimum wage rose from $15.75/hr to $16.50.
Increases to minimum wages have generally outpaced inflation over time. And this year's 4.8% increase is not that much bigger than we've seen in recent years. However, the planned increases over the coming three years are more significant. We expect around 18% of the workforce will be captured by the minimum wage by the time it reaches $20/hr in 2021. Anecdotally firms' concerns about minimum wage increases extend beyond simply the headline figure. Other workers who are paid a little above the minimum wage are likely to also get an increase in order to maintain relative wage differentials. Compared to other countries, New Zealand's minimum wage is high relative to the average wage, meaning changes to the minimum wage impact a relatively large share of the workforce (a share which will increase even more as the minimum wage heads towards $20).
The flow on effect on inflation of changes to the minimum wage will depend on the extent to which firms can pass on cost increases. This will vary across industries and with the state of the labour market more generally. A minimum wage hike is unlikely to spark a wage-price spiral on its own, but it could exacerbate one that had already developed. To this end, next week's QSBO will give us an update on how firms' cost pressures and pricing intentions have evolved over the last three months.
Data Previews
Aus Apr Westpac-MI Consumer Sentiment
Apr 11, Last: 103.0
The Westpac-Melbourne Institute Consumer Sentiment Index rose 0.2% to 103.0 in March from 102.7 in February. The index remains in net optimistic territory above the 100 mark but below January's reading of 105.1. The survey detail suggests the negative impact of market volatility on sentiment in February eased but has been partially offset by new concerns about longer term prospects for the economy.
The April survey is in the field over the week ended April 8. Financial markets have again been unsettled, the ASX200 down 2.9% since the March survey and US-China trade relations deteriorating further. Continued house price declines locally are also likely to be weighing on sentiment.
 Aus Feb housing finance (no.)
Apr 12, Last: –1.1%, WBC f/c: –1.0%
Mkt f/c: -0.4%, Range: -1.2%% to 1.5%
Australian housing finance approvals had a mixed month in Jan, the number of owner occupier approvals dipping 1.1% but the value of investor loans firming 1.1%. As always, housing data should be treated with extra caution around the summer holiday low period.
Industry figures suggest Feb saw a similar dip in owner occupier approvals – we expect a 1.0% decline. It's difficult to envisage further gains in the value of investor loans although that would help explain the recent firming in total housing credit growth (i.e. the stock of debt outstanding, changes in which relate to both new loans and repayment behaviour).
 NZ Q1 Survey of Business Opinion
Apr 10, Domestic trading activity - Last: +18
Business confidence fell sharply in the December quarter as firms became more nervous about the outlook for the broader economy in the wake of the change of Government. Firms' outlook for their own activity also fell albeit not as sharply.
Since then, monthly measures of business sentiment have improved off their lows. However, confidence continues to linger well below pre-election levels. We will be looking to see if this trend rings true for the QSBO as well.
Of interest will be how the survey's key inflation gauges are tracking. We'll also take note of how capacity pressures in the construction sector are evolving and any further tightening in labour market indicators.
 NZ Mar retail card spending
Apr 12, Last: -0.3%, WBC f/c: +0.6%
Retail spending fell 0.3% in February. However, this followed a large 1.4% gain in January, and still left us with a fairly healthy picture of spending growth over the past year. The softness in February's spending figures was centred on two categories. The first was consumables, which Stats NZ suggested may have been affected by poor weather through the month. The other was fuel spending, which was weighed down by a fall in prices.
We're expecting to see a 0.6% gain in retail spending in March, underpinned by a 0.7% lift in core categories. In part, this is a recovery from earlier weather related disruptions. In addition, we expect to see solid increases in categories such as hospitality through the Easter holiday period. Such gains are only partially offset by falls in fuel prices.
 NZ Mar REINZ house sales and prices
Apr 9-13 (tbc), Sales last: +1.5%, Prices last: 3.9%yr
After slowing in early to mid-2017, the New Zealand housing market has been more positive in recent months. House prices lifted 1.5% over the three months to February - slightly less in Auckland and Canterbury, slightly more elsewhere. Market turnover has also picked up, albeit less emphatically.
March will probably be another relatively buoyant month. Banks have been reducing mortgage rates and lending more freely.
However, later in 2018 we expect a marked housing market slowdown. The bright-line test for taxing capital gains on resold properties will be extended from two to five years from April 1, foreign buyers will be restricted from mid-year, and further tax changes designed to cool house prices can be expected. At the same time, population growth is slowing and fixed mortgage rates will soon stop falling.
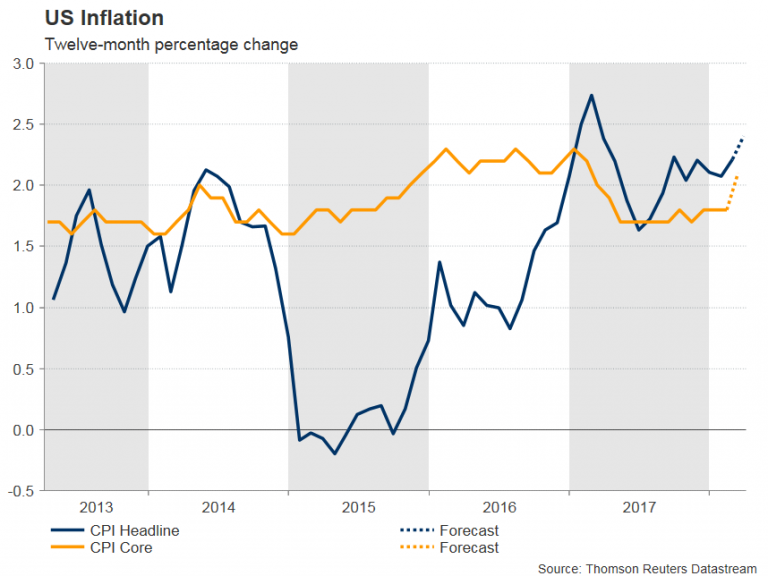
 US Mar CPI
Apr 11, last 0.2%, WBC 0.0%
Headline CPI inflation has settled a little above 2.0%yr in recent months.
Come March, the monthly gain for core prices is likely to again be circa 0.2%; however, for headline inflation, this will be offset by weaker energy prices, leaving total prices little changed for the month.
There will be more movement in the annual rates however, particularly for core inflation. This is because the first of the weak outcomes from 2017 is set to drop out of the annual calculation, March's –0.1%
Annual core inflation is expected to jump from 1.8%yr to 2.1%yr in the month. Because of the weight of energy prices in the month, annual headline inflation is likely to only edge up 0.1ppt to 2.3%yr.
Week Ahead – Trade Data in Focus Amid Rising American Protectionism; US Inflation also Eyed
Trade numbers out of China look set to attract some headlines next week as trade tensions between the United States and China heat up and show no sign of deescalating. Germany and the United Kingdom will also publish monthly trade figures, while inflation data out of the US will be another closely watched indicator in a week where the Federal Reserve will be releasing the minutes of its March policy meeting.
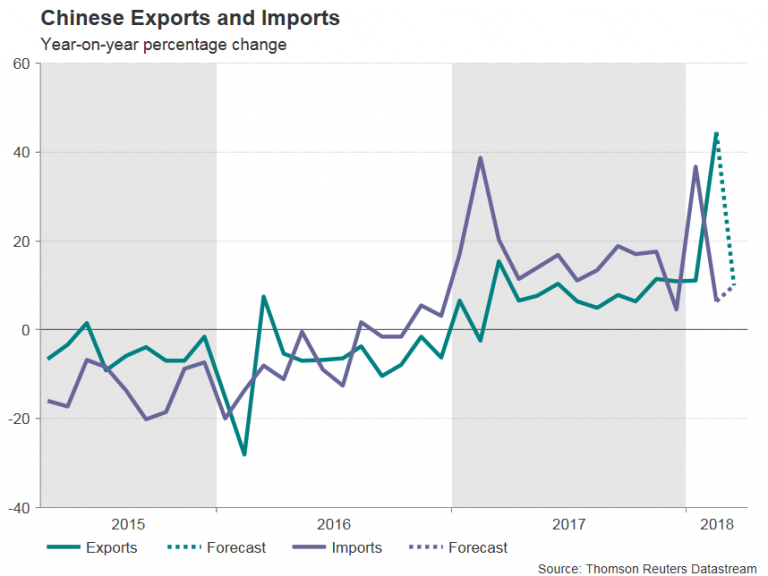
China exports to moderate in March
After China responded to the US tariffs with tit-for-tat measures, it might find itself on the defensive if the latest trade balance figure due on Friday shows another large surplus with the US. Adding to the timing sensitivity is the US Treasury Department’s latest semi-annual currency report, which is expected sometime this month. The US has so far refrained from calling China a currency manipulator but may choose to step up the rhetoric again given recent developments. However, China’s overall trade balance in March is expected to shrink from $33.7 billion to $27.2 billion. Export growth is also forecast to moderate, to 10% year-on-year, following the 44.5% surge in February, but import growth is expected to accelerate from 6.3% to 10%.
Ahead of the trade data, consumer and producer prices will be watched on Wednesday. Annual CPI is forecast to ease by 0.3 percentage points to 2.6% and PPI by 0.5 percentage points to 3.2%.
 Japan machinery orders to dip again
Data out of Japan next week may add to concerns that economic growth in the country is running out of steam following two consecutive months of declines in both the manufacturing and services PMIs. Machinery orders, which are seen as an indication of future business spending, are expected to post a drop in February after an 8.2% jump in January. The core measure is forecast to fall by 2.5% month-on-month in February when released on Tuesday. Also out the same day are corporate goods prices (Japan’s equivalent of producer prices). Corporate goods prices are forecast to increase by 2.0% on an annual basis versus 2.5% in January. Prior to Tuesday’s data, current account figures are published on Monday.
Like most Japanese data, the numbers are unlikely to see much reaction in forex markets as the Japanese yen remains mainly driven by risk sentiment and safe-haven flows, especially under the current climate of heightened trade risks.
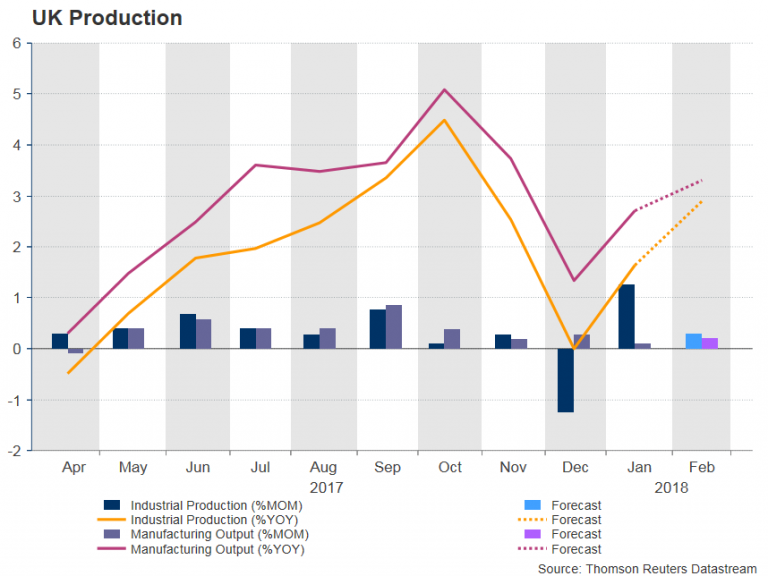
UK manufacturing growth to remain positive
As firming rate hike expectations for May hold sterling above the $1.40 level, UK manufacturers are unlikely to be happy about the newly emerged bullishness for the British currency. Manufacturing PMI data released by IHS Markit this week pointed to a notable slowdown in output in the first quarter of the year from the prior period. Data due on Wednesday is likely to show manufacturing production expanding for the 10th straight month, rising by 0.2% m/m in February. Wider industrial output, which includes the utilities and energy sectors, is expected to ease to 0.3% growth from a 1.3% surge in the prior month. Also released on Wednesday are trade numbers for February.
 German trade figures and ECB minutes eyed
The euro has been drifting lower after forming a top at $1.2476 at the end of March as recent Eurozone data has been surprising mostly to the downside. Next week’s data is unlikely to be significant enough to lift the currency out of its short-term doldrums, but the account of the ECB’s March meeting could provide some cause for volatility. In particular, the discussion around the removal of the bank’s easing bias in the March statement and views about the timing of the ECB’s exit from its stimulus program will be watched by investors on Thursday. In terms of data, industrial output figures for the euro area are also due on Thursday, and ahead of that, the Eurozone sentix index and German trade numbers are published on Monday. German exports are expected to rise by 0.2% m/m in February, while the trade surplus is forecast to grow slightly to €21.4 billion. Along with China and Japan, Germany’s massive trade surplus is becoming an increasingly contentious issue with the Trump administration and a wider surplus in February could give President Trump a stronger argument in his shift towards more protectionism. On the other hand, a weaker export performance could raise further doubts about the strength of the Eurozone economy during the first quarter of the year.
US inflation back in limelight
Price gauges will be the primary focus of the US economic calendar next week. Producer prices for March are released on Tuesday and will be followed by the consumer price index on Wednesday. The annual rate of CPI is expected to accelerate from 2.2% to 2.4% in March to what would be a one-year high. The core rate is also forecast to edge up, from 1.8% to 2.1%. A stronger reading could help the US dollar extend its gains above the 107 level versus the yen. Another potential mover for the greenback on Wednesday will be the minutes of the Fed’s March policy meeting. The Fed raised the target range of its benchmark rate by 25 basis points at its meeting on March 13-14 but maintained a median forecast of two more rate hikes in 2018. If the minutes point to slightly more hawkish views by FOMC members than suggested in the meeting statement, the dollar could get an additional lift.
Other data to watch out of the US next week include March import prices on Thursday, followed by the JOLTS job openings for February and the University of Michigan’s preliminary reading of the consumer sentiment index for April, both due on Friday.
Weekly Focus: From Trade War to Central Bank Minutes
Market movers ahead
- The US-China trade conflict will be the most important thing to follow in China next week. We believe we have entered a crucial phase and that we may be past the worst.
- CPI core numbers will be in focus in the US next week, as well as the FOMC minutes from the March meeting.
- In the euro area, the most interesting release is the ECB minutes from the March meeting.
- In the Nordic region, we are due to get consumer price data.
Global macro and market themes
- Trade war round two is over and the next step is the US hearing period (lasting until 15 May). However, it is not impossible that we have seen the worst on the trade front for now so keep an eye on this.
- Growth momentum is peaking according to our MacroScope monitor, amid recent soft indications that data could delay the next step in the ECB announcement. Current PMI levels are consistent with 2.1% y/y growth, compared with the ECB's 2.4% estimate. A revision of its forecast and slower normalisation could be warranted.
- Markets have traded range bound recently, despite the 'trade war'. We still expect EUR/USD to be 1.28 on a 12M horizon.
US: Seasonality Issues, Weather Limits Headline Jobs, Fed Still On
Although below the recent trend, the job gain of 103,000 in March supports the case for continued consumer spending. Job gains plus the 4.1 percent unemployment rate corroborate the call for a June rate hike.
Job Gains Broad-Based with March Jobs at 103,000
Nonfarm payrolls rose 103,000 in March with the three-month average at a solid 202,000 jobs. Consistent with 2.5-3.0 percent economic growth in the first half of 2018, job gains come with a likely FOMC June rate hike, soon followed by two more in the second half of 2018.
Jobs gains appeared broad-based, with most sectors experiencing gains over the month (top graph). Manufacturing jobs continue to show forward momentum—up 22,000 in March and up an average of 25,000 over the past three months. Construction jobs took a hit, down 15,000, as weather showed its force here. Over the past three months, aggregate hours worked are up 2.0 percent, annualized, which very solid and consistent with continued growth in personal income and consumption.
Wage Growth Awaits Uptick in Inflation
The theory that workers and employers respond to higher inflation is confirmed through Granger causality tests, which reveal that inflation leads wages (middle graph). That is, workers respond to higher inflation by trying to negotiate higher nominal wages to maintain a real wage standard. Similarly, higher inflation fosters more flexibility for employers to raise wages while maintaining profit margins.
Nominal average hourly earnings rose 0.3 percent in March and are up 2.7 percent over the year—a touch higher than February at 2.6 percent. The gradual rise in earnings over the past six months signals higher incomes, but also greater pressure on profits as firms continue to have modest top-line pricing power. Longer term, subdued inflation readings and weak productivity numbers suggest limited gains in nominal wage growth.
Unemployment Stuck, but Underlying Improvement Continues The unemployment rate was unchanged in March, sticking at 4.1 percent for a sixth consecutive month. The late winter storms that hit the northeast appear to have had only a small impact on unemployment last month; 159,000 workers reported they were unable to work last month due weather, which is only modestly above the 143,000 average for March over the past 41 years.
After going on a tear the past two months, labor force participation edged down in March. Beyond the month to month volatility, however, we see encouraging signs from the household survey that point to continued tightening in the labor market. The broadest measure of unemployment, which includes part-time workers who want full time jobs and workers marginally attached to the labor force, is on par with the lows of the previous expansion. Labor force participation among workers ages 25-54 has risen 0.4 points over the past year. Although the prime participation rate has only recovered about half the ground lost since the recession, total employment among this group is closer to making a full recovery (bottom graph).
U.S. March Employment Rises Less than Expected
Highlights:
- Payroll employment rose a smaller-than-expected 103K following increases of 326K and 176K in February and January, respectively, that were revised from 313K and 239k previously.
- The unemployment rate held steady at February’s rate of 4.1% rather than dropping to 4.0% as had been expected going into the report.
- The annual increase in wages picked up to 2.7% in March from 2.6% in February.
Our Take:
Payroll employment growth slowed more than expected in March to 103K. Some moderation was widely expected going into the report given the outsized 326k surge in February (originally reported as up 313k) though expectations were centered around a stronger 185k increase. More robust employment gains were also expected to be reflected in the unemployment rate dropping to 4.0% from February’s rate of 4.1% though today’s report indicated that this rate remained unchanged. That said, the current unemployment rate still remains below the Fed’s assumed long-run range of 4.3% to 4.7%. Providing further confirmation of tight labour markets, the annual increase in wages rose to 2.7% in March from 2.6% in February and a 2017 average of 2.5%. The likelihood of labour markets operating beyond capacity is possibly starting to limit firms’ ability to find new workers particularly after outsized gains in recent months.
Canada’s Unemployment Rate – Lowest Since Mid-1970s in Q1 2018
Highlights:
- March employment gain of 32K, more than expected, though job losses of 40K were recorded in Q1
- Full-time employment rose by 78K in the first quarter while part-time job losses totaled 118K
- The unemployment rate was 5.8% in March and averaged the same in Q1—lowest since the mid-1970s. The broadest measure of unemployment (seasonally adjusted) averaged 8.3% in Q1 matching the record low.
Our Take:
Despite the 32K rise in job creation in March, the economy posted its first quarterly decline in employment since Q3 2010. While disappointing, the details show the number of people employed full-time continued to rise (up 78K) in the first three months of 2018. Part-time employment posted a hefty 118K drop however this was mainly due to January’s 137K plunge. The unemployment rate and a broader measure that includes those who are underemployed fell again in the first quarter. The unemployment rate averaged 5.8% in Q1, the lowest since the mid-1970s and the broader U8 measure matched the lowest on record at 8.3%.
Wage growth also firmed up in the first quarter pushed along by the jump in Ontario’s minimum wage. Even ex-Ontario, average wage inched higher to 3.0% from 2.9% in Q4. The Bank of Canada acknowledged the pickup in wages in their March statement though posited that the rate of increase remained below what “typically” occurs when there is no slack in the labour market. The combination of historically low levels of unemployment and steady acceleration in the pace of wage gains is testing the Bank’s argument that slack in the labour market remains. On Monday, the bank’s Business Outlook Survey will be released. In the previous report, a growing number of companies reported labour shortages with the intensity of these shortages up relative to a year earlier. The bank will no doubt be watching to see if these trends persisted in early 2018. When you layer on the stealth increase in core inflation, the case for the Bank to delay pulling back on the currently highly stimulative monetary conditions until the second half of the year is weakening.
Sunset Market Commentary
Markets:
US President Trump surprised markets overnight just when trade dust seemed to have settled. He ordered his administration to consider tariffs on an additional $100 bn in Chinese imports, initially causing a new collapse in US stock market futures (-2%), an uptick in the US Note future and minor losses for the dollar. US equity futures retraced half of the initial spike lower ahead of the payrolls, while the Note future and the dollar retraced the complete move. The greenback tested first intermediate resistance levels (EUR/USD 1.2240, USD/JPY 107.29 and DXY 90.45). Payrolls disappointed (apart from wage data) and caused quite some volatility. Investors didn’t know which card to play, but got support from a hastily planned press conference by the Chinese Ministry of Finance. They reiterated readiness to strike back and contradicted US official talk that both parties entered a negotiation phase. The latter was probably determinant for sending US stocks, the US dollar and US rates lower. Tonight’s speech on the economic outlook by Fed chair Powell probably won’t be able to counter that move. On the contrary, mentioning the trade conflict now risks provoking and amplification of the current trades. US yields decline by 2.4 bps (2-yr) to 3.7 bps (10-yr) with the belly of the curve outperforming. German yields drop by 0.8 bps (2-yr) to 1.9 bps (10-yr). EUR/USD bounced back from the 1.2220 area to above 1.2270 and US stock markets opened more than 0.5% lower. EUR/GBP moved from 0.8745 to 0.8725 in uneventful, technically-inspired trading.
News Headlines:
The Chinese Ministry of Finance (Mofcom) called an unplanned press conference in the three-day national holiday to respond to US President Trump’s request to his administration for possible tariffs on $100 bn worth of imported Chinese goods. Spokesman Gao Feng condemned the move and said that China will immediately retaliate if the US releases a $100bn list. The Mofcom added that the US has been refusing to negotiate with China, contrary to what several high rank US officials indicated earlier this week. Investors will now look out for next week’s keynote speech by president Xi Jingping on Tuesday at the Boao forum (Chinese Davos).
US payrolls disappointed. The US economy added 103k jobs in March, way below 185k consensus. We’re talking about a 132k miss taking into account the cumulative 50k downward revision to the previous 2 months’ figures. The unemployment rate stabilized at a cycle low of 4.1% while consensus forecast a drop to 4%. The participation rate declined from 63% to 62.9%. Average hourly earnings for once turned out to be the bright spot of the report. They increased by a good 0.3% M/M and 2.7% Y/Y, which was in line with expectations. Canadian payrolls showed the opposite picture. March net job growth (+32.3k) beat expectations (+20.0k) and was mainly driven by a surge in full time employment (+68.3k). The unemployment rate stabilized at 5.8% as did earnings at 3.1% Y/Y (below 3.4% Y/Y consensus though). The loonie nevertheless profited with USD/CAD dropping from 1.2790 to 1.2740.
ECB Coeuré said that a trade war triggered by US tariffs would cause a global recession - and the mere fear of one is already hurting the economy. The ECB currently doesn’t take it into account in its deliberations. He added that discussions about adjusting the current mix of monetary policy instruments is under way as EMU inflation shows signs of improvement.
German industrial output fell by the most in more than two years in February (-1.6% M/M from 0.1% M/M vs 0.2% M/M consensus) and the sector is losing momentum, the Economy Ministry said, as factories in Europe's largest economy throttle back in the face of the rising threat of protectionism.
DOW quickly pares losses, GBP leads Europeans higher
DOW opened lower as Trump chose escalation rather than negotiation with China. The Chinese Global Times reported that there was no negotiation taken place. White House economic advisor Larry Kudlow also said negotiations have not really begun yet. So, without starting negotiations, the US has already fired three shots (the 232 steel tariff, 301 tariffs and triple up 301 tariffs). Is there really any intention for talks?
Anyway, DOW drops to as low as 24245.02 initial trading but quickly recovers. It's not back pressing 24400 handle, down just around -100 pts. Technically, we maintain the firstly, price actions 23360.29 are forming a corrective pattern. Rejection from trend line resistance (now at 24838) will make it a triangle. Break of the trend line will push DOW to 25449.25/25800.35 zone to make it a rectangle. Despite today's retreat, we'd expect more upside in the near term for at least a take on the trend line.
In the forex markets, European majors are generally strong, led by GBP today. CAD is only up against USD and NZD despite some solid job data. NZD and USD are the weakest ones. In particular, after initial hesitation, traders finally decide to sell USD after the weaker than expected NFP report.
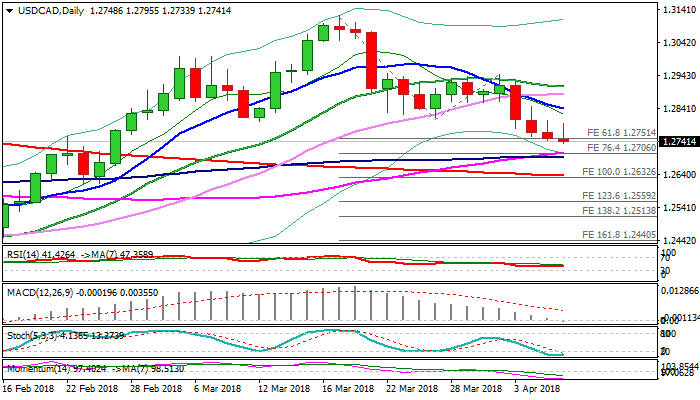
USDCAD – Loonie Rises Further on Strong Canadian and Disappointing US Jobs Data
The pair fell after data and hit new nearly six-weeks low at 1.2733 after US NFP disappointed at 103K in March, showing the lowest creation of jobs in six months, while unemployment rate remained unchanged at 4.1%, missing forecast at 4.0%. Negative impact was partially offset by earnings data coming in line with forecast (0.3%), up from Feb's 0.1% which shows that pickup in wage gains helps tightening labor market. On the other side, Canadian jobs data showed strong rise in employment in March, with 32.3 K new jobs created, heavily beating forecast at 18.8K and previous month's release at 15.4K. Divergence from US/Canada data helped loonie to extend gains against its US counterpart. The USDCAD pair is in near-term downtrend from 1.3124 (9 Mar high), currently riding on the third wave of five-wave sequence, which eyes its 76.4% Fibonacci expansion at 1.2706 (reinforced by 55SMA). Stronger bearish acceleration on persisting negative sentiment for greenback could extend to key supports at 1.2658/32 (top of rising daily cloud/FE 100%/200SMA). Daily MA's (10/20/30) are in firm bearish setup and helped with negative momentum studies, favoring further weakness. However, immediate bears could be delayed for extended consolidation as slow stochastic is strongly oversold on daily chart, but without firmer bullish signal for now. Falling 10SMA tracks descend (currently at 1.2840) and should keep the upside protected.
Res: 1.2795; 1.2840; 1.2887; 1.2908
Sup: 1.2733; 1.2706; 1.2658; 1.2632