Sample Category Title
USD/CAD Weekly Outlook
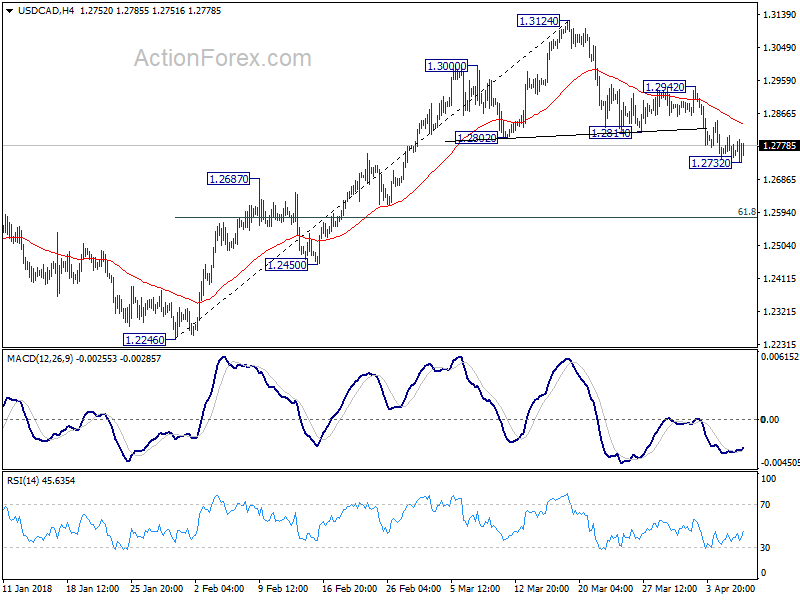
USD/CAD dropped to 1.2732 last week but formed a temporary low there and recovered. Initial bias is neutral this week. Overall development suggests near term reversal, with head and shoulder top pattern (ls: 1.3000; h: 1.3124; rs: 1.2942). Hence, deeper decline is expected as long as 1.2942 resistance holds. Below 1.2732 will target 61.8% retracement of 1.2246 to 1.3124 at 1.2581 next. However, break of 1.2942 will invalidate this bearish view and turn bias back to the upside for 1.3214 high.
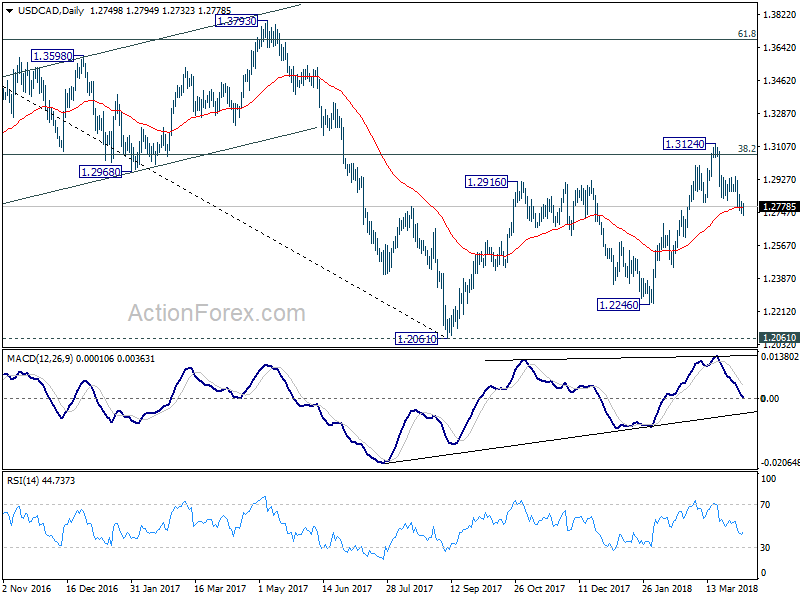
 In the bigger picture, current development turns favors to the case that rise from 1.2061 is a corrective three wave pattern. It could have completed at 1.3124 after hitting 38.2% retracement of 1.4689 to 1.2061 at 1.3065. Focus is now back on 1.2061 and 50% retracement of 0.9406 (2011 low) to 1.4689 (2015 high) at 1.2048.
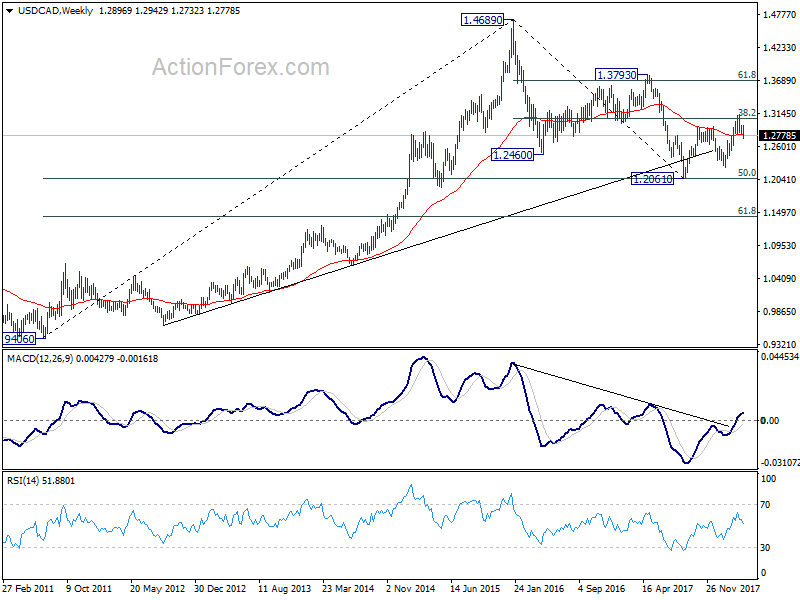
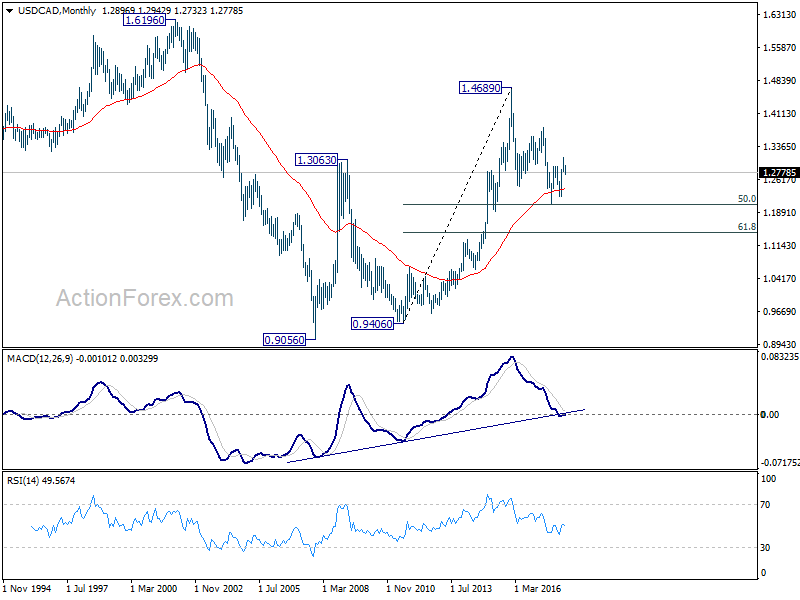
 In the longer term picture, 50% retracement of 0.9406 (2011 low) to 1.4689 (2015 high) at 1.2048 remains a key support level to watch. As long as this level holds, we'll treat fall from 1.4689 as a correction and expect another rally through this level. However, sustained break of 1.2048 will turn favors to the case that rise from 0.9056 (2007 low) is a three wave corrective move that's completed at 1.4689. And retest of 0.9056/9406 support zone could be seen in medium to long term.
GBP/JPY Weekly Outlook
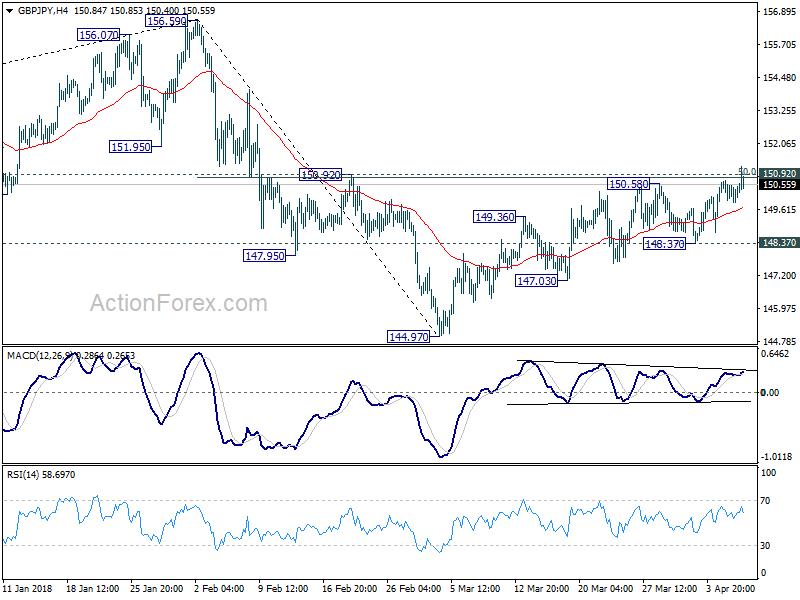
GBP/JPY's choppy rebound from extended to 151.21 last week but breached 150.92 resistance briefly. But it couldn't sustain above 150.92 (50% retracement of 156.59 to 144.97 at 150.78) yet. Initial bias stays neutral this week first. We'd still expect strong resistance from 150.78/92 to limit upside. Break of 148.37 will turn bias to the downside for retesting 144.97 first. However, sustained break of 150.92 will indicate near term reversal and pave the way back to retest 156.69 high.
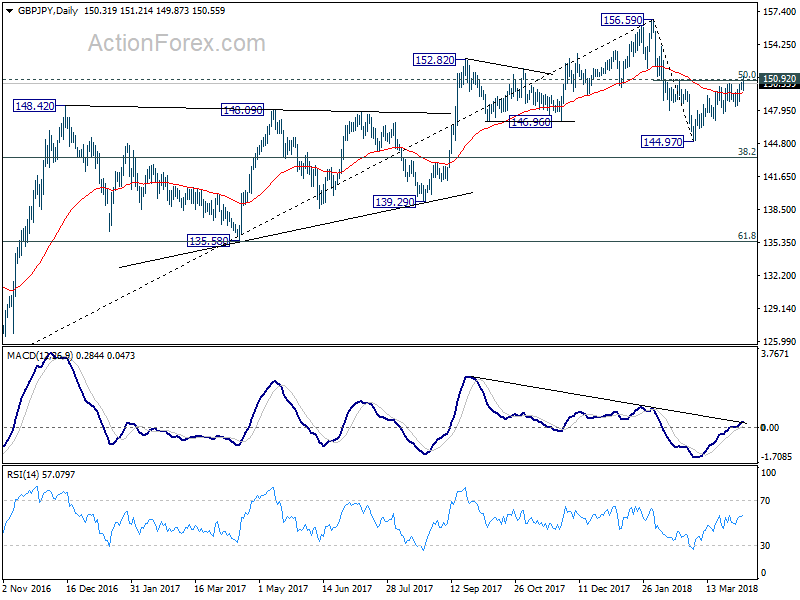
 In the bigger picture, the case for medium term reversal has been building up. There is bearish divergence condition in daily MACD. 146.96 support was taken out. And GBP/JPY was rejected by 55 month EMA. Break of 38.2% retracement of 122.36 to 156.59 at 143.51 will pave the way to 61.8% retracement at 135.43 and below. This will now be the preferred case as long as 150.92 resistance holds. However, sustained trading above 150.92 will argue that the larger rise from 122.36 might still be in progress for another high above 156.59.
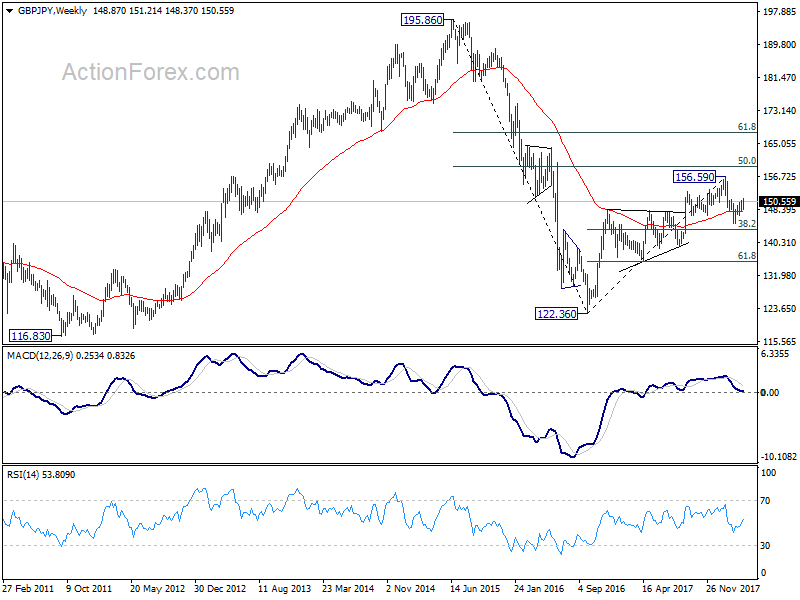
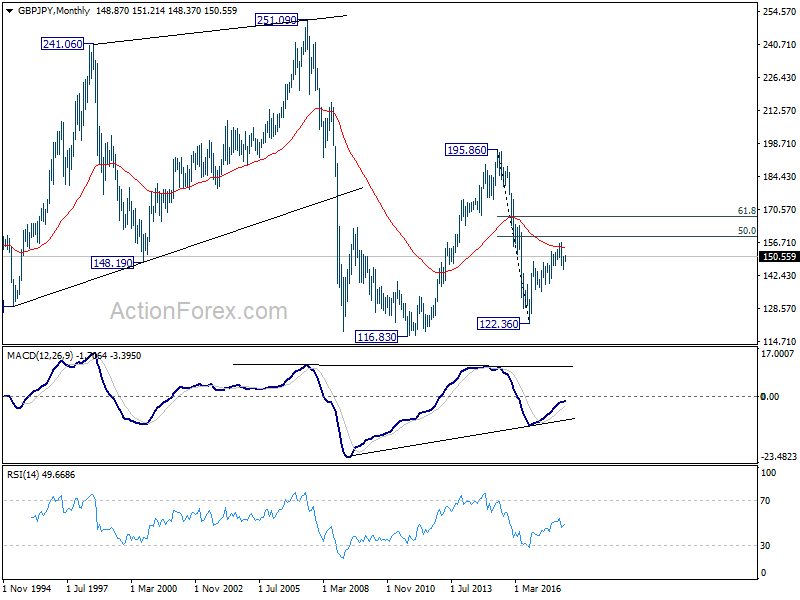
. In the longer term picture, rejection from 55 month EEMA (now at 154.18) argues that medium term rebound from 122.36 might be completed. And, the corrective structure also carries some bearish implication today. Sustained break of 135.58 key support will likely bring retest of 122.36 low, with prospect of resuming the long term down trend from 195.86 (2015 high).
EUR/JPY Weekly Outlook
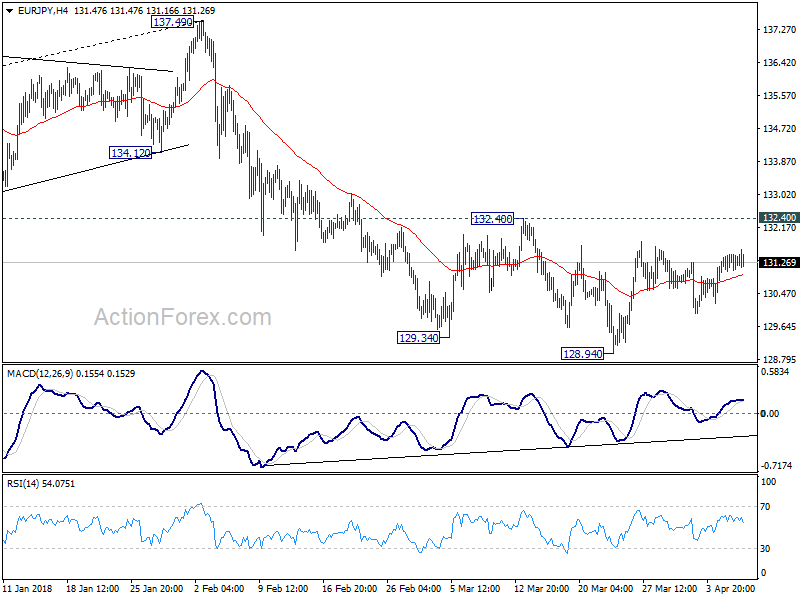
No change in EUR/JPY's outlook as it continued to stay in consolidative trading between 128.94/132.40 last week. Initial bias remains neutral this week first. Also, as long as 132.40 holds, near term outlook remains bearish for deeper fall. On the downside, break of 128.94 will extend the whole fall from 137.49 to 126.61 medium term fibonacci level next. Nonetheless, break of 132.40 should confirm short term bottoming and turn bias back to the upside for stronger rebound.
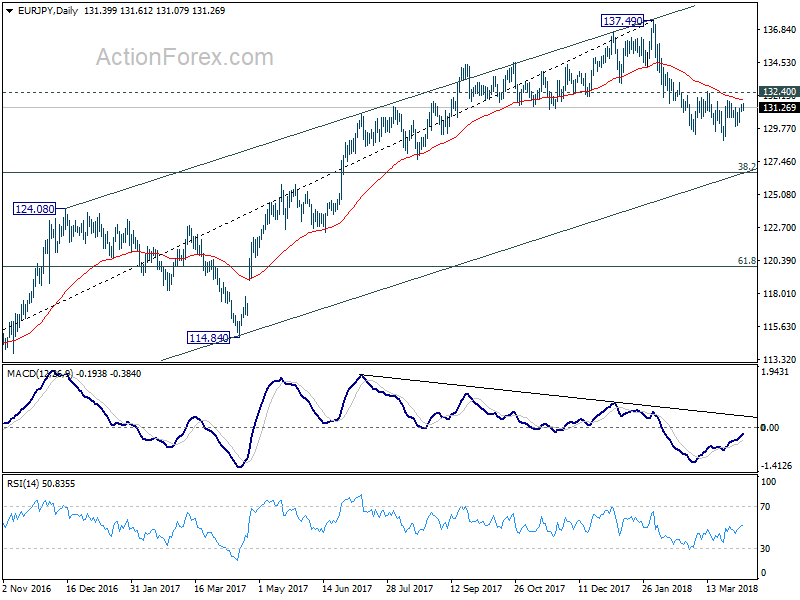
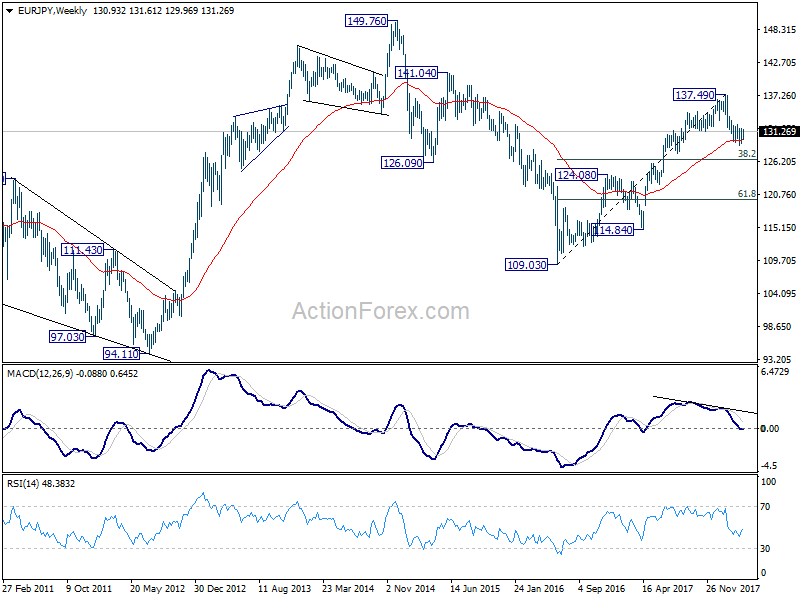
In the bigger picture, current development argues that rise from 109.03 (2016 low) has completed at 137.49, on bearish divergence condition in weekly MACD. Deeper fall should be seen to 38.2% retracement of 109.03 to 137.49 at 126.61 first. Sustained break there would pave the way to 61.8% retracement at 119.90. On the upside, break of 132.40 resistance will indicate that the pull back is completed and bring retest of 137.49. But still, break of 137.49 is needed to confirm medium term rise resumption. Otherwise, outlook is neutral at best for consolidations.
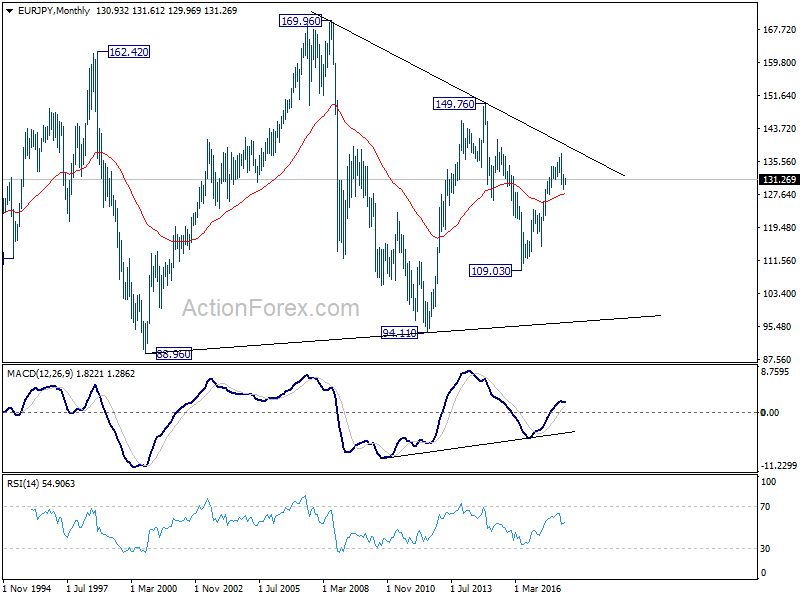
In the long term picture, at this point, EUR/JPY is staying in long term sideway pattern. established since 2000. Rise from 109.03 is seen as a leg inside the pattern. As long as 124.08 support holds, further rally is in favor in medium to long term through 149.76 high. However, break of 124.08 could extend the fall through 109.03 low instead.
EUR/GBP Weekly Outlook
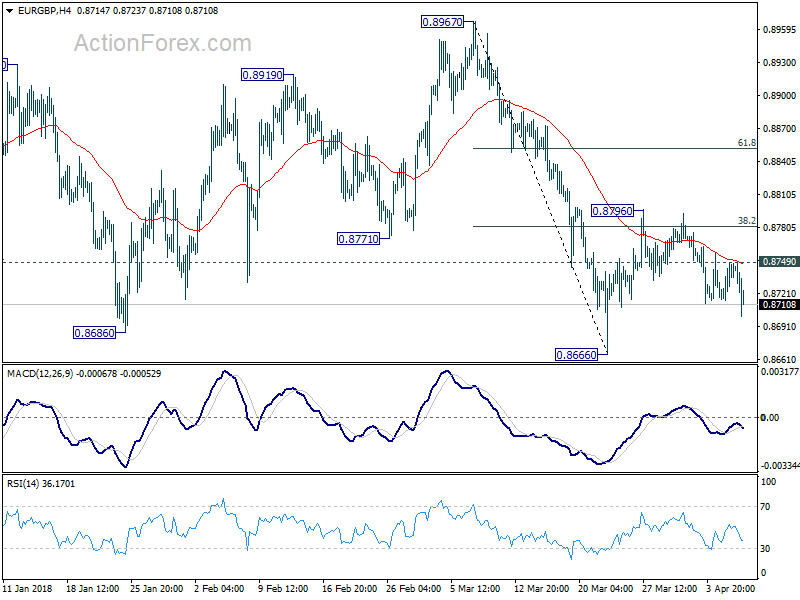
EUR/GBP's decline from 0.8796 extended lower last week but the cross is staying in range above 0.8666. Initial bias remains neutral this week first. On the downside, decisive break of 0.8666/86 support zone will resume whole fall from 0.9305. In that case, EUR/GBP should target 0.8303 key support next. On the upside, above 0.8749 will reaffirm the strong support from 0.8686 and turn bias to the upside for 0.8796. Break there will target 61.8% retracement of 0.8967 to 0.8666 at 0.8852 and above.
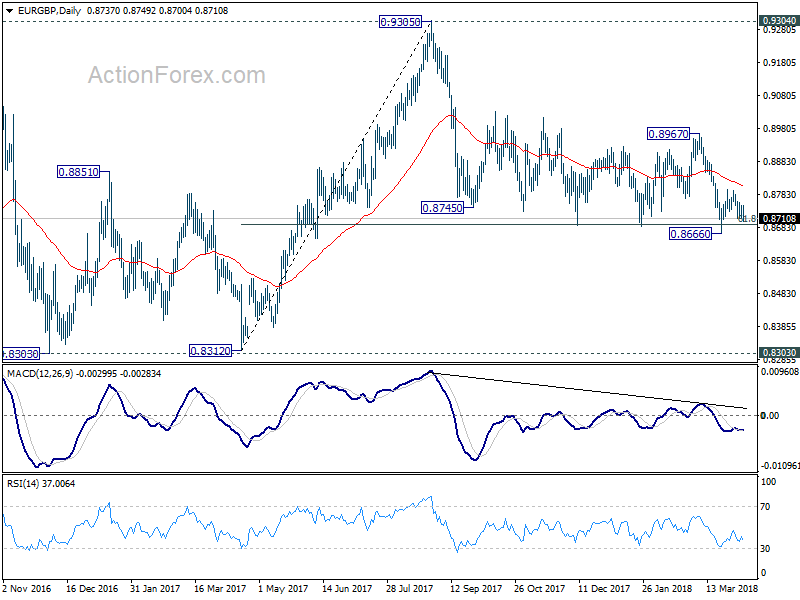
 In the bigger picture, there are various ways to interpret price actions from 0.9304 high. But after all, firm break of 0.9304/5 is needed to confirm up trend resumption. Otherwise, range trading will continue with risk of deeper fall. And in that case, EUR/GBP could have a retest on 0.8303. But we'd expect strong support from 0.8116 cluster support (50% retracement of 0.6935 to 0.9304 at 0.8120) to contain downside.
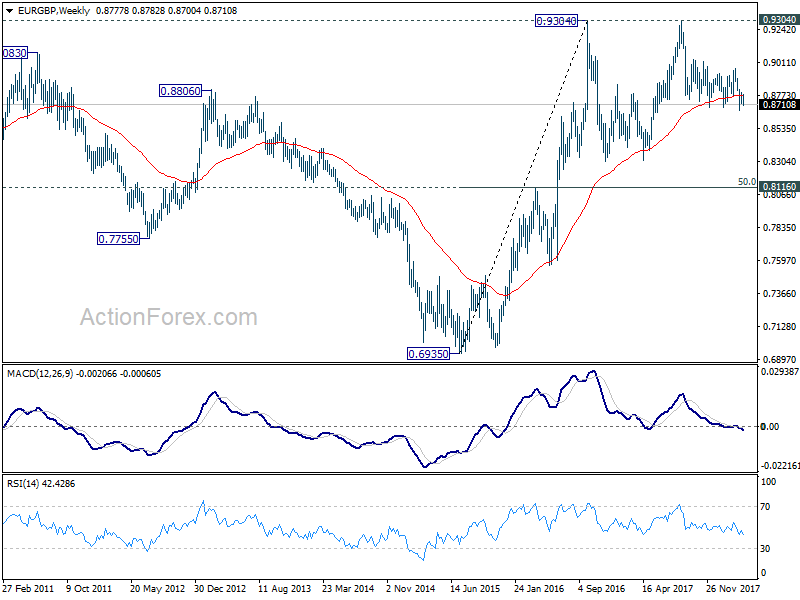
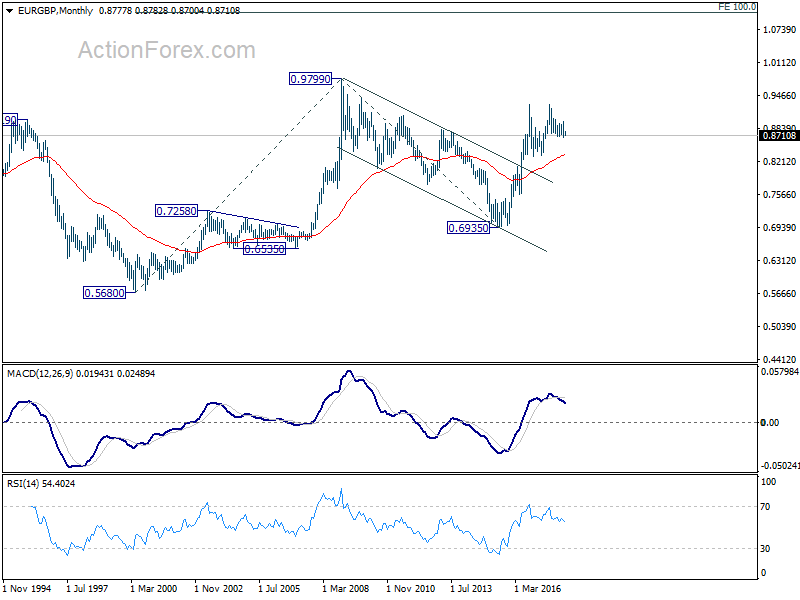
 In the long term picture, we're holding on to the view that rise from 0.6935 (2015 low) is resuming the up trend from 0.5680 (2000 low). Hence, after the consolidation from 0.9304 completes, we'd expect another medium term up trend through 0.9799 to 100% projection of 0.5680 to 0.9799 from 0.6935 at 1.1054.
EUR/AUD Weekly Outlook
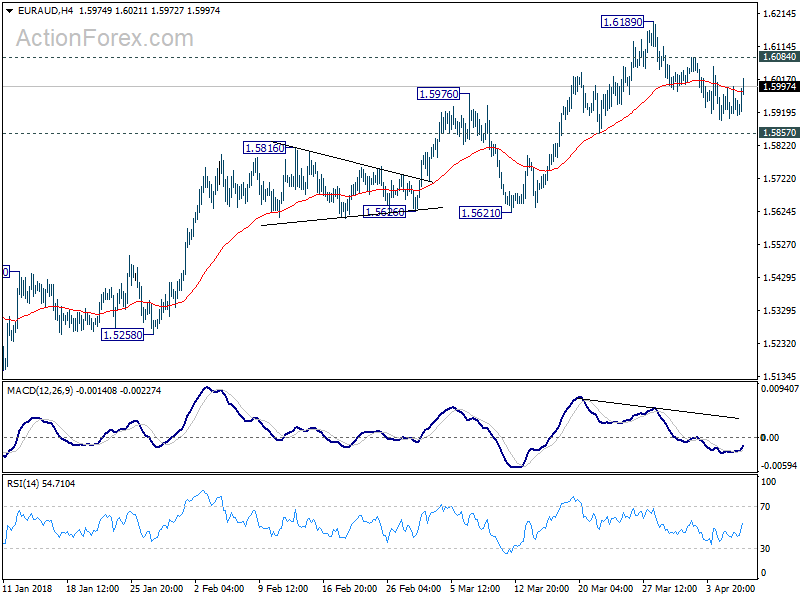
EUR/AUD stayed in consolidation below 1.6189 last week and outlook is unchanged. Initial bias remains neutral this week first. As long as 1.5857 minor support holds, further rally is expected in the cross. On the upside, above 1.6084 minor resistance will turn bias to the upside for retesting 1.6189 first. Break will resume larger rally towards 1.6587 key resistance. However, break of 1.5857 will be an early sign of trend reversal and turn bias to the downside for 1.5621 support to confirm.
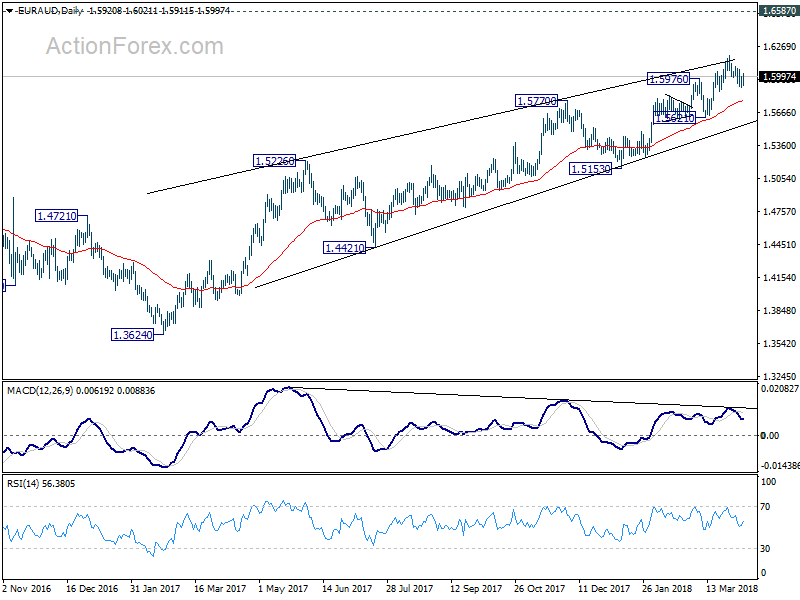
 In the bigger picture,rise from 1.3624 is not completed yet. And it's still in progress for 1.6587 key resistance level. We'd be cautious on strong resistance from there to limit upside, on bearish divergence condition in daily MACD. But for now, break of 1.5621 support is needed to be the first sign of medium term reversal. Otherwise, outlook will stays bullish even in case of deep pull back.
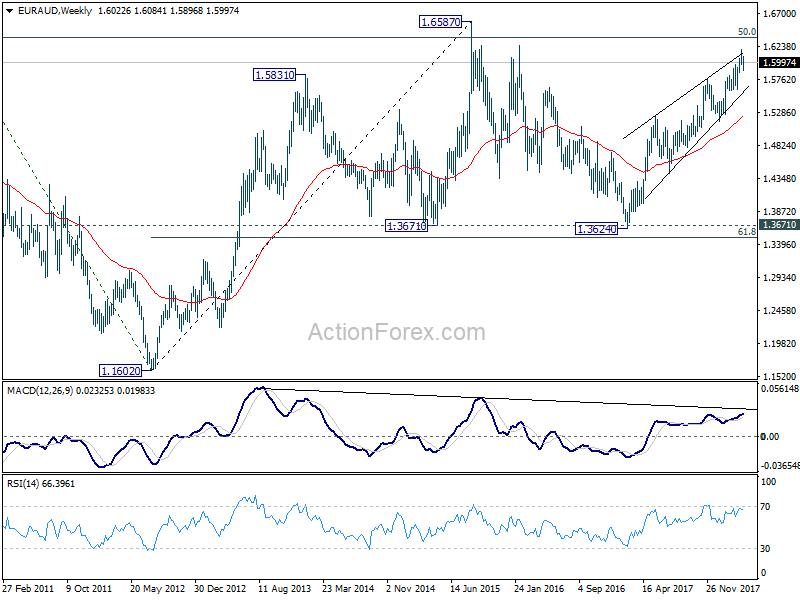
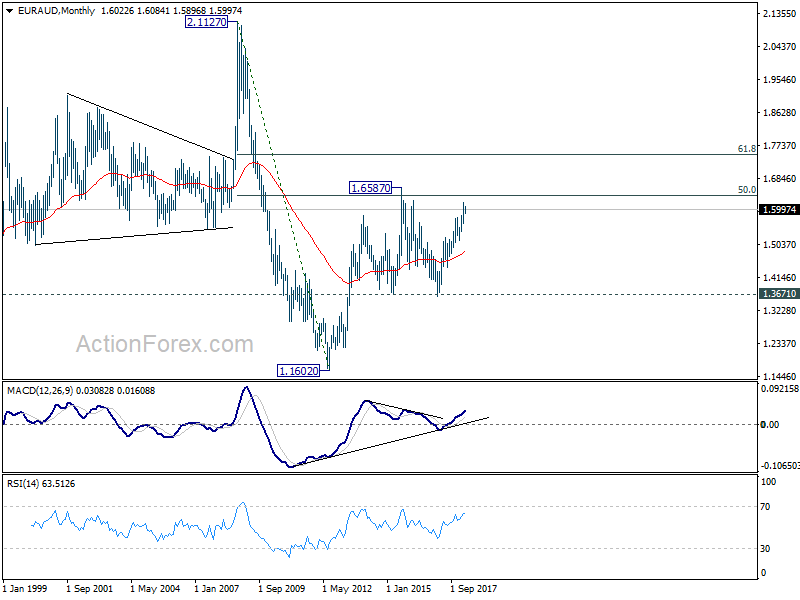
 In the longer term picture, the rise from 1.1602 long term bottom (2012 low) isn't over yet. We'll keep monitoring the development but there is prospect of extending the rise to 61.8% retracement of 2.1127 to 1.1602 at 1.7488 and above. However, sustained trading below 1.3671 should indicate long term reversal and target 1.1602 long term bottom again.
EUR/CHF Weekly Outlook
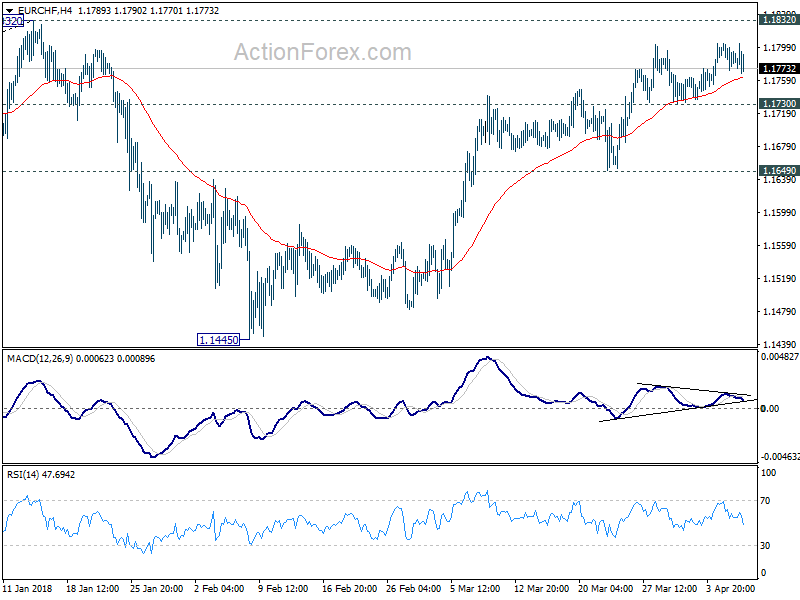
EUR/CHF edged higher to 1.1804 last week but quickly lost momentum. Outlook is unchanged. While rebound from 1.1445 might extend, we'd stay cautious on strong resistance from 1.1832 to bring near term reversal. On the downside, below 1.1730 minor support will turn bias to the downside first. Further break of 1.1649 support will indicate completion of rebound form 1.1445. And the corrective pattern from 1.1832 would then extend with another decline to retest 1.1445. However, firm break of 1.1832 will confirm resumption of larger up trend.
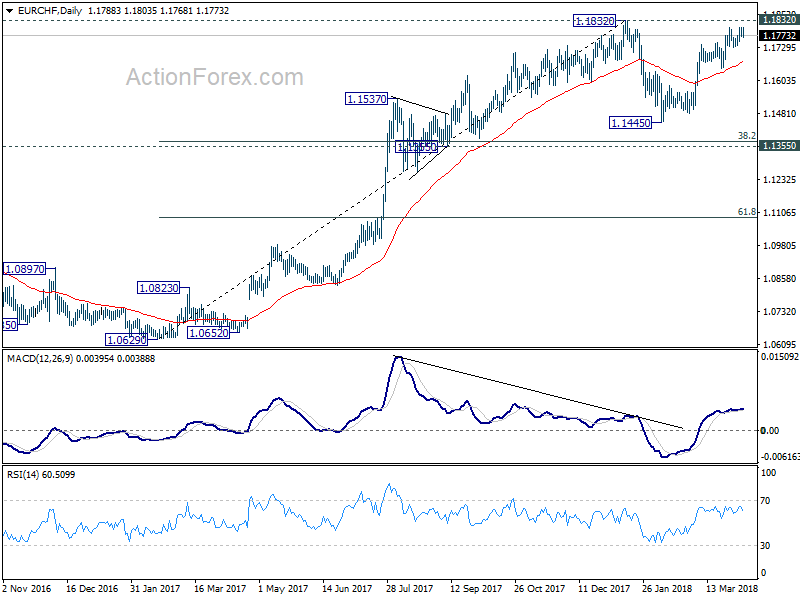
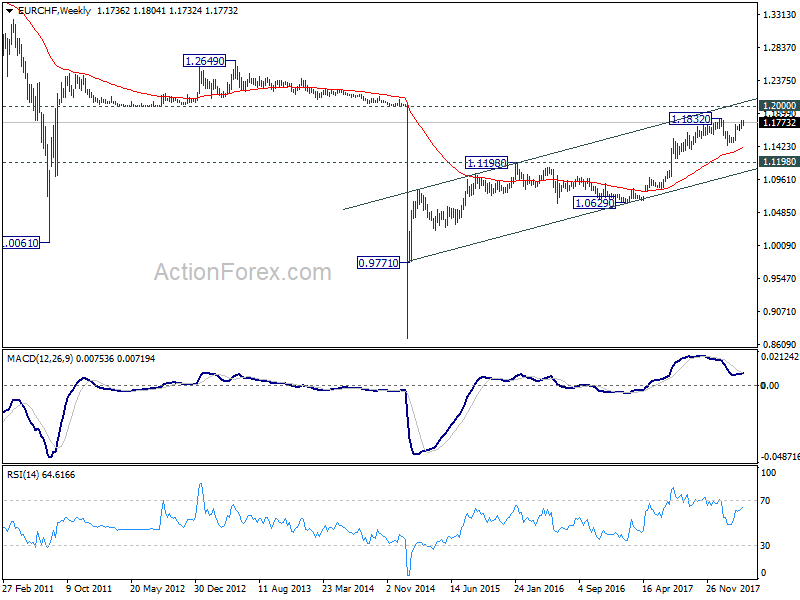
 In the bigger picture, a medium term top should be in place at 1.1832 on bearish divergence condition in daily MACD. But there is no indication of long term reversal yet. As long as 1.1198 resistance turned support holds, we'd still expect another rise through prior SNB imposed floor at 1.2000.
Dollar Mixed as Markets Pared Back Expectations of Fed Hikes Slightly, after NFP and on Trade War
US-China trade war was the dominant theme in the financial markets last week. US started by announcing the list of 1300 product lines to be tariffed under Section 301 actions. China quickly responded by announcing 25% retaliation tariffs to US imports, matching the size of USD 50b product values. US President Donald Trump then escalated the tension by ordering the Trade Representative to come up with an additional list of USD 100b in products for tariff imposition. Then China came back with verbal response, since the new list is not published yet. DOW had a roller-coaster ride last week with 1278 pts swing before closing at 23932.76, down 170 pts from the prior week.
Responses in the currency markets were much milder tough. Dollar ended the week mixed, up against Euro, Yen, Swiss Franc and Aussie, down against Sterling, Canadian and New Zealand land. Canadian Dollar was the strongest one as supported by positive NAFTA news. It's believed that Trump is rushing to sign something regarding NAFTA next week at the Summit of Americas, even if it's just symbolic. Sterling followed as the second strongest with no apparent reason. Perhaps no news is good news for the Pound. Or as some cited, it's seasonality that drove the Pound up. On the other hand, Yen and Swiss Franc ended as the weakest ones despite risk aversion.
US-China in war of words, not trade war yet
It should be repeated here again that all about US-China trade war now are words only. There is no implementation date for any new tariffs, except the US 232 steel tariffs, and the Chinese retaliation tariffs on USD 3b of US goods. The US will at least have to go through public input regarding the Section 301 tariffs on USD 50b of Chinese imports till May 22. The product lists and actual total amount could then be finalized afterwards, with an implementation date added. Trump's intention to triple down and raise stakes on USD 100b of Chinese products is still his own proposal. It's even unsure how many percent of work regarding this issue has the Trade Representative completed.
So, why would the markets bother? Wednesday's selloff in stocks could be attributed to China's speedy and firm response, with intensity that target Trump and Republican base with tariffs on soybean and agricultural products, as well as aircrafts. But it should be reminded that DOW staged a massive 700pts come back to close higher on Wednesday. That means, this round of verbal exchange, the US tariff of USD 50b of Chinese imports and China's equal sized retaliation, just triggered knee jerk reactions.
But enough is enough on Trump created confusions
Friday's selloff in US stocks, on the other hand, revealed that investors in the US were getting increasingly impatient with Trump and the confusion that he created. White House economic advisor Larry Kudlow wasn't aware of the proposal of new tariffs on USD 100b of Chinese imports before Trump's statement late Thursday. Kudlow tried to calm the markets that "we are not in a trade war". But Treasury Secretary Steven Mnuchin said "there is the potential of a trade war". Mnuchin said the US is in "communications" with China, but Kudlow said trade negotiations "have not really begun yet". And Trump also said "we're not in a trade war with China" but he kept raising the stakes even before negotiation starts. So, what do they want? Do they want to talk or not? Does Trump want negotiation or escalation?
On the other hand, the messages from China have been very clear and consistent (note that we're just saying they're consistent, not approving that these messages are correct and truthful). The Chinese government denied of intellectual property theft. And they tried to shape the situation as result of US unilaterialism and protectionism (this is to a certain extent true based on what US is doing with NAFTA and the 232 steel tariffs). China pledged to fight back at any costs. And what China has been doing consistently is, let the US figure out what they want to do first, then quickly hit the ball back. There is no need to rush into put a date on the tariffs on USD 50b of goods yet. And there isn't a need to tell the US how they're going to respond to the tariffs on USD 100b of goods right now. But China seems to be ready to hit fire any time.
Going forward? Under normal circumstances, it's great time from now till May 22 for some adult diplomats from the two countries to come to the table to sort things out. It should be peace between now and then. But as Nader Naeimi, Sydney-based head of dynamic markets at AMP Capital Investors Ltd said, "it's becoming childish". With adults like Gary Cohn and Rex Tillerson gone, it's unsure what Trump would do next. So, let's see.
Here are some analysis reports on US-China trade war for reading:
- Uncertainty Goes Up as Trump Chooses Escalation Over Negotiation
- How Costly Would a Full-Blown Trade War Be?
- The Most Important Chapter in the Trade Saga is the Upcoming One
- China Announced Tariff on US Soybean Exports. What Next?
- Two Scenarios for the US-China Trade Conflict
Markets paring bets on Fed hikes due to trade war and NFP
An important development to note is that the markets pared back some of expectation for Fed rate hikes ahead. Fed fund futures are now pricing in 80.3% change of a 25bps hike to 1.75-2.00% (or more) at June's meeting. A week ago, Fed fund futures priced in 85.6% chance of one or more June hike. That's around 5.3% less chance since a week ago. Looking deeper into the details, a week ago, there was 82.11% change of 25bps hike, 3.51% chance of 50bps hike. A day ago, there was 84.28% chance of 25bps hike, 0.88% chance of 50bps hike. And, currently, it's 79.07% chance of 25bps hike, 1.24% chance of 50bps hike. That means, firstly, markets pared back aggressive pricing of 50bps hike on trade war developments. Then, secondly, some further gave up on a June hike after NFP.  By September, fed funds futures are now pricing in only 48.9% chance of a total of two 25bps hikes. A day ago, that was 54.0% chance of two 25bps hikes by September. A week ago, that was 57.13% chance. For now, there is no change in the expectation that Fed is going to have two more hikes this year. Fed chair Jerome Powell's comments also affirmed this. But recent developments are starting to lower the chance of one more before the end of the year.
 DOW's triangle pattern in shape
DOW's rejection from 55 day EMA, below the near term trend line, and Friday's selloff set up the pattern from 23360.29 to be a triangle consolidation pattern. Immediate focus will be back on 23360.29 this week. Overall, price actions from 26616.71 record high are seen as correcting the up trend from 2016 low at 15450.56. We'd expect deeper decline before the correction completes. And break of 23360.29 will target 38.2% retracement of 15450.56 to 26616.71 at 22351.24.
 Dollar index breakout imminent
Dollar index stayed in range of 88.25/91.01 last week as sideway trading continued. It's now approaching medium term trend line resistance, and a breakout is likely imminent. For now, there is no sign of a trend reversal yet. And the fall from 103.82 (2017 high) is more likely to extend than not. Break of 88.25 will pave the way to 61.8% retracement of 72.69 to 130.82 at 84.58. We maintain the view that fall from 103.82 is a corrective move. And strong support is expected from 84.58/75 to contain downside and bring sustainable rebound finally.
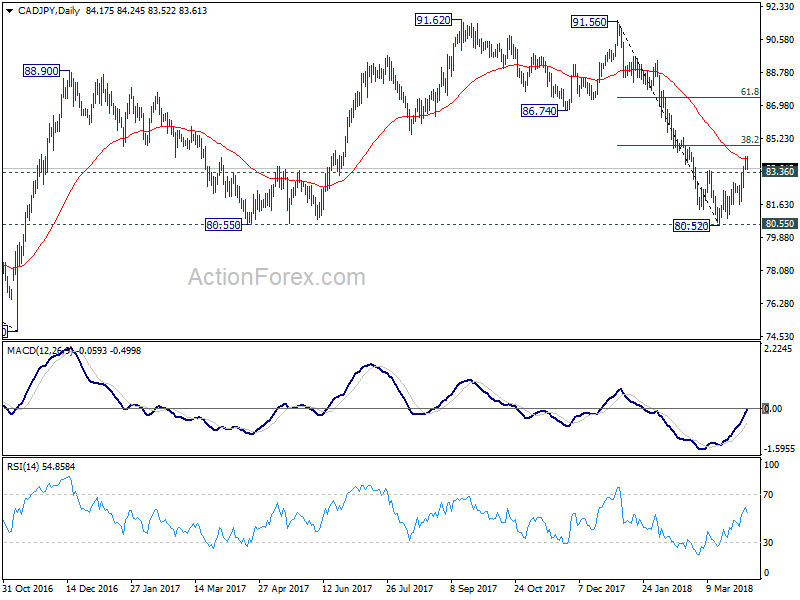
 CAD/JPY might face sell-on-NAFTA-news risk
CAD/JPY was the biggest mover last week, gaining 1.59% or 131 pips. We've pointed out in quick comments that the cross had some solid upside momentum. However, despite solid Canadian job data, the cross couldn't extend gain as Yen was lifted by risk aversion again on Friday. Another problem is that while Canadian Dollar was lifted by positive NAFTA news, there could be sell-on-news decline next week when that anticipated symbolic NAFTA draft is delievered.
Technically, it's also unsure whether rebound from 80.52 is a corrective rebound after drawing support from 80.55, or it's reversing the trend from 91.56. For now, for quick trading, as long as 80.36 minor support holds, long position could still be carried to 38.2% retracement of 91.56 to 80.52 at 84.73 for profit. For position trading, we'd better wait to see if the subsequent pull-back is impulsive or corrective in nature first.
GBP/USD Weekly Outlook
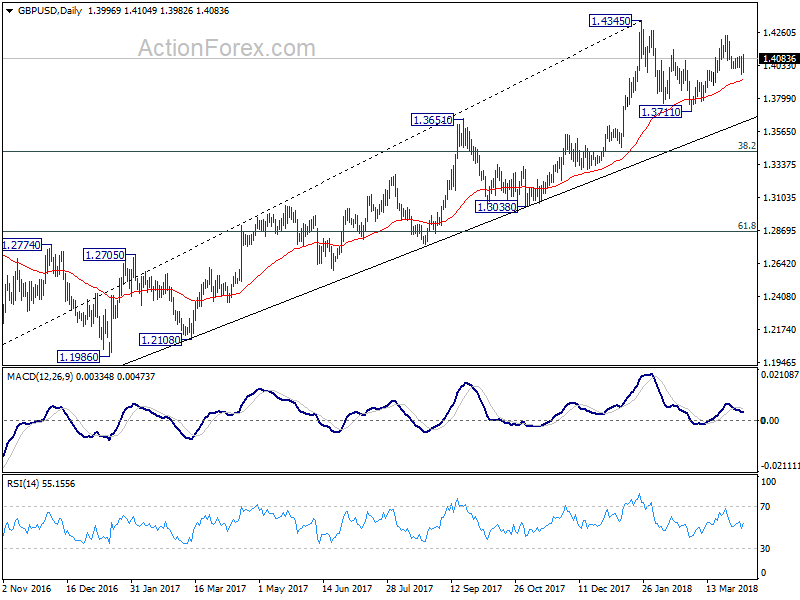
Despite dipping to 1.3964 initially last week, GBP/USD drew solid support from 1.3982 and rebounded. The break of 1.4096 minor resistance suggests that pull back from 1.4243 has completed already. Initial bias is turned back to the upside for 1.4243 first. Break will target a test on 1.4345 high next. On the downside, however, sustained break of 1.3964/82 will indicate completion of the rise from 1.3711. In that case, deeper decline should be seen back to retest 1.3711.
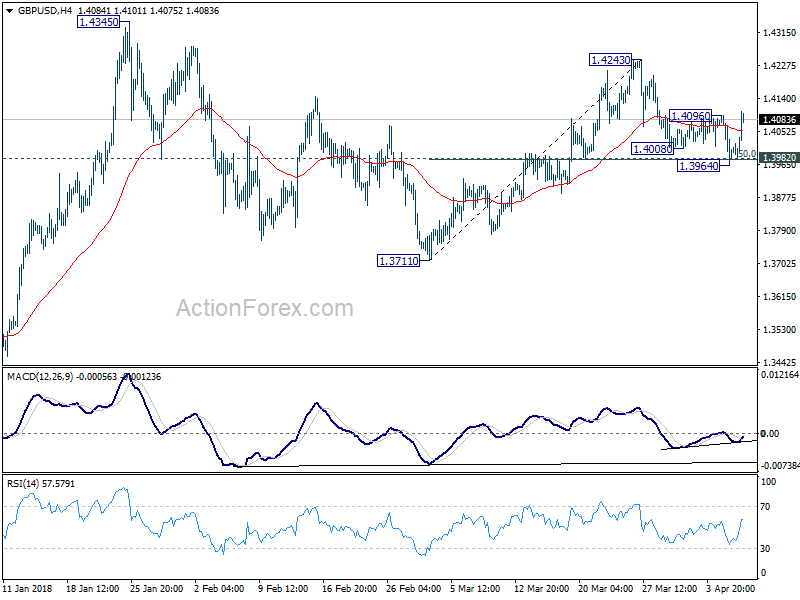 In the bigger picture, as long as 1.3651 resistance turned support holds, medium term outlook in GBP/USD will remain bullish. Rise from 1.1946 is at least correcting the long term down trend from 2007 high at 2.1161. Further rally would be seen back to 38.2% retracement of 2.1161 (2007 high) to 1.1946 (2016 low) at 1.5466. However, GBP/USD fails to sustain above 55 month EMA (now at 1.4267) so far. Break of 1.3651 will be the first sign of medium term reversal and turn focus to 1.3038 support for confirmation.
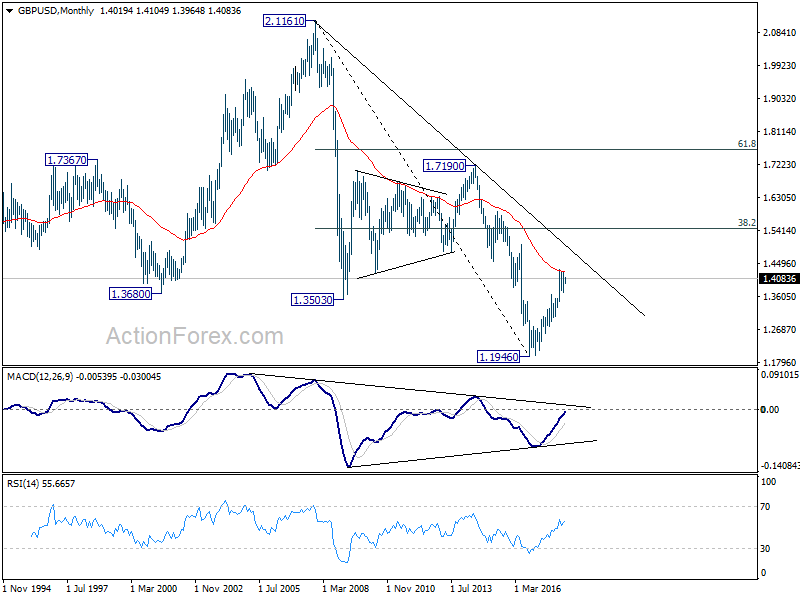
 In the longer term picture, rise from 1.1946 should at least be correcting the whole long term down trend from 2.1161 and should target 38.2% retracement of 2.1161 (2007 high) to 1.1946 (2016 low) at 1.5466. It too early to tell if it's developing into a long term up trend. We'll monitor the upside momentum and reaction to 1.5466 to decide later.
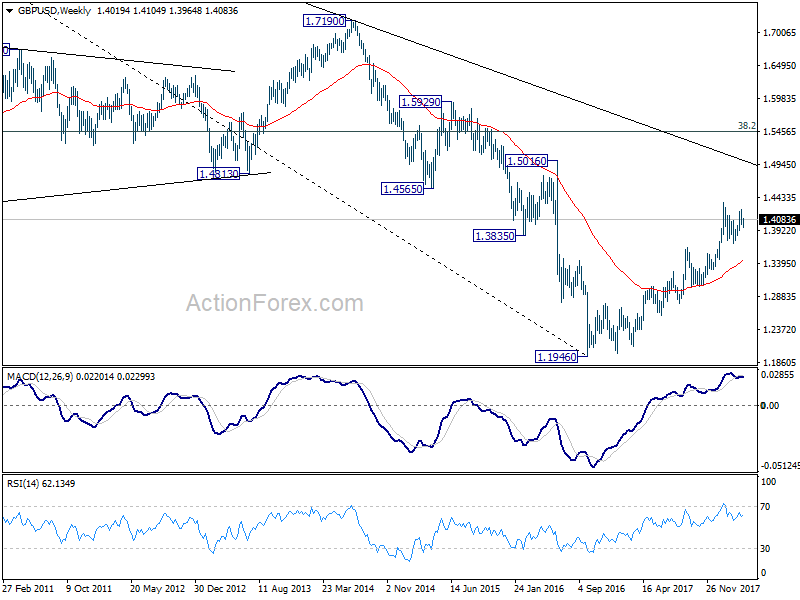
Summary 4/9 – 4/13
Monday, Apr 9, 2018
[php_everywhere instance="1"]
Tuesday, Apr 10, 2018
[php_everywhere instance="2"]
Wednesday, Apr 11, 2018
[php_everywhere instance="3"]
Thursday, Apr 12, 2018
[php_everywhere instance="4"]
Friday, Apr 13, 2018
[php_everywhere instance="5"]
Weekly Economic and Financial Commentary: Solid Momentum Beneath the Headlines
U.S. Review
Solid Momentum Beneath the Headlines
- Swings in winter weather appear to be behind most of the below-consensus 103,000-job rise in March nonfarm payrolls. Job growth averaged 202,000 per month during the first quarter.
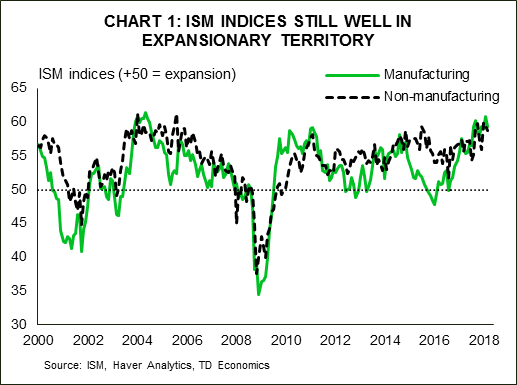
- Both the ISM manufacturing and non-manufacturing indices eased in March but both remain at levels consistent with real GDP growth in the 3 percent range or better.
- Motor vehicle sales came in slightly stronger than expected, suggesting that March may see a bit of a bounce back in consumer spending.
March Data Ease Back a Notch
Early reports for March suggest we will see some pullback from the exceptionally strong data reported earlier this year. The more moderate numbers do not likely reflect a change in the economy's underlying momentum, however. The economy appears to be growing quite solidly on an overall basis and any sting from March's below-consensus 103,000-job gain is easily offset by the 202,000 jobs added on average during the first quarter. The unemployment rate was unchanged at 4.1 percent, although the prior month's number was rounded down to 4.1 percent and the March figure was rounded up.
Beneath the headlines, the March employment report marks another solid month of gains. The shortfall in employment growth was mostly due to swings in construction and retail payrolls. Construction payrolls added 65,000 jobs in February, which was driven by unseasonably mild weather, particularly in California. March saw the return of winter weather in the Northeast and a subsequent 15,000-job pullback in construction jobs. For the quarter as a whole, builders added 78,000 jobs, which seems consistent with the improvement we are seeing in single-family home construction.
The other big swing was in retail trade, which reportedly added 47,000 jobs in February but then cut 4,000 positions in March. Even with all the turmoil in retailing these swings likely exaggerate the swing in retail employment, which has huge seasonal moves around Christmas and Easter.
Aside from these swings, the employment data look fairly solid. Two of the indicators we like to focus on are the diffusion index, which measures the share of industries adding jobs over the past month, and total hours worked, which combines the changes in employment with changes in weekly hours. Both remain exceptionally strong. The diffusion index for private sector employers fell from an astounding 71.1 in February to a still outstanding 62.6. The average for the past two months is well above the average for the past few years and is consistent with what we are seeing in the ISM surveys, which are also diffusion indices.
Both ISM indices edged back in March. The ISM manufacturing index fell 1.5 points to 59.3. Any reading above 50 means that more manufacturers are seeing improving conditions than are seeing worsening conditions. Readings around 60 are extraordinary and the string of readings around that level for the past seven months is something seen on only a handful of occasions in the past 35 years. The ISM non-manufacturing index fell 0.7 points to 58.8, again remaining at an extraordinarily high level. Strength in the ISM indices suggests that economic growth has broadened, lifting more industries and more regions than we had seen previously in this recovery. As a result, economic gains should be more durable and better able to withstand the blustering winds emanating from the still-intensifying trade debate with China.
The trade deficit widened in February, rising to $57.6 billion, up from $56.7 billion the prior month. Trade will likely subtract from first quarter real GDP growth.
U.S. Outlook
Producer Price Index • Tuesday
Producer prices have been edging higher. Producer inflation rose 0.2 percent in February to a year-over-year pace of 2.8 percent. Services inflation was the source of the rise in February, as goods prices edged down. Food and energy prices weighed on prices for goods. Trade services prices were also down on the month, but transportation and warehousing costs rose enough to offset that decline.
Input cost growth quickened in February, suggesting producer prices will continue rising in coming months on higher intermediate prices. Still, the pace of price growth appears to be manageable in the near term.
Producer prices will be an important gauge to watch in coming months to determine the impact of recently imposed tariffs on steel and aluminum on final goods prices.
Previous: 0.2% Wells Fargo: 0.1% Consensus: 0.1% (Month-Over-Month)
 Consumer Price Index • Wednesday
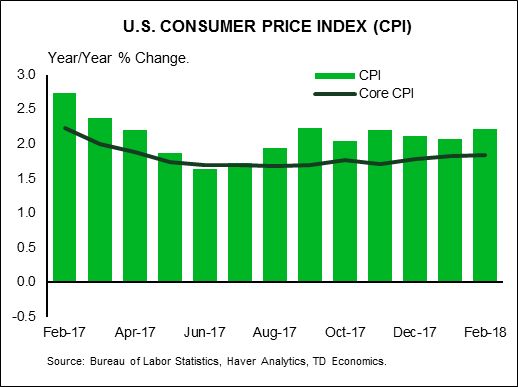
Consumer inflation has strengthened in recent months. On the heels of a strong January increase, the CPI rose 0.2 percent in February and is now up 2.2 percent over the year. Higher energy prices were less of a factor in February. The core CPI also increased 0.2 percent on the month and apparel prices continued to rise solidly, which helped offset declines in medical, commodities and education prices. Food and beverage, recreation and transportation prices were flat on the month while housing costs rose in line with recent readings.
Core CPI is running at 1.8 percent over the year, but that should rise closer to 2 percent in March as year-to-year comparisons will coincide with last year's decline in wireless services. Inflation is firming more broadly as well, with ISM surveys continuing to show businesses paying higher prices. Inflation does not appear set to run out of control, however, giving the Fed space for gradual tightening.
Previous: 0.2% Wells Fargo: 0.1% Consensus: 0.0% (Month-Over-Month)
 Import Prices • Thursday
Import prices continued to climb in February, rising 0.4 percent to extend the streak of monthly gains to seven months. Import prices rose even though petroleum prices declined on the month, as nonfuel import prices rose 0.5 percent for the second straight month. Prices rose most in February for imported foods and beverages. Over the past year, prices for imported industrial supplies have seen the fastest growth along with petroleum.
Export prices continued to rise in February as the global demand picture continued to strengthen, and the dollar has generally been easing. The trade weighted dollar was largely flat in March.
Prior to the March announcement of tariffs on steel and aluminum, prices for both were already rising by double digits over the year. We expect only a marginal effect on final consumer prices from the steel and aluminum tariffs.
Previous: 0.4% Wells Fargo: 0.1% Consensus: 0.1% (Month-Over-Month)
Global Review
Foreign Central Banks Eye U.S. Developments
- Russian GDP growth missed expectations in Q4-2017 but still posted the fastest full-year growth since 2013.
- Purchasing Manager Indices in Europe and the United Kingdom suggest a slower pace of economic growth toward the end of Q1. Construction activity in the United Kingdom posted an especially soft reading in March.
- Both the Reserve Bank of India (RBI) and the Reserve Bank of Australia (RBA) kept their main policy rates unchanged this week. The RBI noted rising global trade tensions as a risk to the outlook, while the RBA cited rising short-term interest rates in Australia due to spillover effects from the United States.
Foreign Central Banks Eye U.S. Developments
Russia is typically one of the last major economies to report its GDP figures for the quarter, and data released this week showed Russian economic growth downshifting in Q4-2017. Household consumption continued to exhibit strength, but a notable deceleration in investment spending and inventories weighed on growth. Even with the miss, the annual GDP growth rate was 1.5 percent, which was the strongest outturn since 2013.
The Russian ruble nosedived in 2014-2016 due to the one-two punch of western sanctions following Russia's annexation of Crimea and the collapse in oil prices. Since then, currency stabilization, a stronger global economic backdrop and more stable oil prices have caused inflation to recede and economic growth to return to positive territory. Consequently, the Central Bank of the Russian Federation has been in rate-cutting mode over the past three years, and most analysts look for it to ease policy further in coming quarters. We look for the economic recovery in Russia to remain intact this year as the decline in inflation boosts real income growth and easier monetary policy shores up interest ratesensitive spending.
To the west, Purchasing Manager Indices (PMIs) portrayed a slightly softer growth environment in the United Kingdom and the Eurozone. The Markit U.K. composite PMI fell to 52.5 in March, a two-point decline from February and the lowest reading since July 2016, when Brexit occurred. A particularly weak reading for the construction sector appeared to be the main culprit. The final March readings for the Eurozone PMIs also confirmed a 1.9 point drop in the composite index, which is now down 3.6 points from its recent high in January. Taken together, the surveys suggest that European economic growth remains firmly in expansion territory, but the pace of growth may be slowing from its recent peak.
Both the Reserve Bank of India and the Reserve Bank of Australia met this week, with neither central bank making a change to their main policy rates. The RBI lowered its inflation outlook relative to its February projections and noted the risks to the outlook from heightened trade tensions, saying that "even as global growth and trade have been strengthening, rising trade protectionism and financial market volatility could derail the ongoing global recovery."
For the RBA, perhaps the most interesting development was that the policy statement noted that the increase in U.S. dollar shortterm interest rates has "flowed through to higher short-term interest rates in a few other countries, including Australia." Thus, there appears to have been some de facto tightening in Australia despite the RBA remaining on hold. High debt levels and slow growth in household income remain a key challenge for the RBA, particularly in an environment of rising interest rates. Our baseline expectation is that the RBA will continue to remain on hold before eventually joining other global central banks in normalizing policy later this year with an eventual rate hike. The key is whether or not the elusive wage growth materializes.
Global Outlook
U.K. Industrial Production • Wednesday
Industrial production (IP) in the United Kingdom more or less flatlined in summer 2016 due, at least in part, to the uncertainty regarding the economic outlook that was imparted by the Brexit referendum. However, uncertainty has subsequently dissipated, at least somewhat, and IP has been trending higher. IP data for February, which will print on Wednesday, will give analysts more insights into the state of the British economy in the first quarter. The consensus forecast anticipates that IP rose 0.4 percent in February following its 1.3 percent rise in January.
Construction data for February will be released on Wednesday. Real construction spending fell 3.2 percent on a year-ago basis in January due in part to weakness in public expenditure on construction. A widely regarded think tank will release its estimate of Q1 GDP growth on Wednesday, which will help us calibrate our own estimate.
Previous: 1.3% Consensus: 0.4% (Month-Over-Month)
Eurozone Industrial Production • Thursday
The industrial sector in the Eurozone accelerated in 2017. Indeed, IP rose 2.9 percent last year, its strongest annual growth rate since 2011. But there are indications that growth in IP may have downshifted so far in 2018. Eurozone IP fell 1.0 percent in January relative to the previous month, and the manufacturing PMI has declined for three consecutive months after climbing to its highest level since 2000 in December. That said, the PMI remains well above the demarcation line separating expansion from contraction, indicating that the upward trend in IP probably remains in place.
IP in the euro area has been boosted in part by solid economic growth in the rest of the world, which has contributed to strong growth in Eurozone exports. Trade balance data for February are on the docket on Friday. These data and the IP data that will be released on Thursday will help analysts refine their GDP growth estimates for Q1.
Previous: -1.0% Consensus: 0.1% (Month-Over-Month)
 Singapore GDP • Friday
Singapore will release its estimate of GDP growth in the first quarter on Friday. Although the Singaporean economy is tiny—it is only 2 percent the size of the U.S. economy—it is an important global bellwether. Historically, Singapore has been the first economy to release GDP data for the recently-completed quarter. Moreover, it is one of the most open economies in the world, and there is a high degree of correlation between Singaporean GDP growth and global economic growth. Consequently, Singaporean GDP data can shed some light on the current state of the global economy.
Global GDP growth strengthened in 2017 following its slowdown in 2015 and 2016, which contributed to the acceleration in the Singaporean economy last year. There are not many forecasters of Singaporean GDP growth, but the consensus looks for the year-overyear growth rate to have picked up further in Q1.
Previous: 3.6% Consensus: 4.4% (Year-Over-Year)
Point of View
Interest Rate Watch
Flatter Yield Curve: Actions and Expectations
As illustrated in the top graph, the spread of the 10-year over the 2-year has narrowed steadily over the past year. We do not expect that this is a signal of recession but rather the tension between actions and expectations in the capital markets. Our outlook is that the spread will narrow into the third quarter of this year to just 35 bps according to our March economic outlook.
FOMC Actions: Up
As illustrated in the middle graph the 2-year yield has risen steadily as the markets have been convinced that the FOMC path of the effective fed funds rate was moving up and likely to continue to move up in the year ahead.
Our outlook is for the FOMC to raise the federal funds rate again in June and likely twice more this year. The market expectation (according to Bloomberg) for a FOMC move to raise the federal funds rate in June is 78.5 percent. The FOMC has upgraded their economic expectations for both growth and inflation, and so we expect the FOMC for now to maintain their commitment to raise the federal funds rate this year and next. As a result, we have the 2-year at 2.70 percent at the end of the third quarter in our latest monthly.
Expectations: Down
Inflation expectations have steadily declined over the past six years as illustrated in the bottom graph. This pattern is counter to the traditional experience (note the pattern in the prior expansion, 2002-2006) of rising inflation and inflationary expectations. As a result, expectations for the 10-year rate have continually been above the actual turnout for the past four years.
So far the rebound in the CPI since 2014 has not yet fed into a rise of inflation expectations. Our expectation is that inflation will rise in the period ahead—we have the PCE deflator at 2.3 percent in the third quarter of this year and that would be consistent with an increase in the 10-year yield, but the increase in the 2-year yield will still generate a flatter yield curve—but no recession.
Credit Market Insights
Positive Today, Wary Tomorrow?
The New York Fed's February Survey of Consumer Expectations showed that respondents remain positive about their current financial situation, yet are slightly wary of future credit conditions. Views on the current outlook are the highest since the survey started in 2013, with 40.2 percent of respondents stating that their financial situation is better off from a year ago. Sustained growth in personal income over the past few months and generally solid credit conditions were likely contributing factors to the jump in sentiment.
While consumers are largely satisfied with the status quo, survey respondents were less optimistic about future credit availability. Both the perceived change in credit availability compared to a year ago and expectations for year-ahead credit availability declined over the month.
These changes likely reflect perceived tightening in credit conditions over the coming quarters – the FOMC raised the fed funds rate 25 bps at its March meeting and we expect it to hike rates three more times this year. Higher interest rates will likely restrain the ramp up in consumer credit seen over the past few months as consumers begin to face higher debt servicing costs. However, the average perceived probability of missing a debt payment declined over the month to 11.6 percent at present, and is a silver lining for consumers amid higher debt servicing costs. Higher incomes have likely better equipped most consumers to handle higher debt payments.
Topic of the Week
How Costly Would a Full-Blown Trade War Be?
The United States and China have announced tariffs on each other's goods in recent weeks, and they have threatened to impose even more. Assuming they take effect, the tariffs that China has announced thus far on American goods will focus on agricultural products, automobiles, aircraft and chemicals. Although exports of these industries to China are sizeable—exports of the agricultural and other primary products industry totaled nearly $20 billion in 2016—they represent a relatively small proportion of total industry output. For example, exports to China are equivalent to less than 5 percent of the output of the agricultural and other primary products industry. In our view, Chinese tariffs on these four broad industries would not a "big deal," at least not from a macroeconomic perspective.
What happens if a full-blown trade war were to develop? Even in a worst-case scenario in which each country were to levy increased tariffs on all of the goods that the other country exports, the overall effect on the U.S. economy should be manageable. We estimate that the value added that is embodied in American exports to China accounts for only 0.5 percent of total value added in the U.S. economy. Looking at things the other way around, China's exports to the United States generate about 2 percent of that country's value added. It appears that China would have more to lose than the United States from an all-out trade war, should one develop.
But there could be other knock-on effects from a trade war that could potentially have deleterious consequences for the U.S. economy. Share prices likely would decline further if a full-blown trade war were to occur, and lower wealth could lead to slower growth in U.S. consumer spending. In addition, bond yields in the United States could rise if China was to unload some of its sizable holdings of U.S. Treasury securities.
The Weekly Bottom Line: Retaliating on Retaliation, Trade War Drums Beating
U.S. Highlights
- Trade developments captured headlines this week. The U.S. disclosure of detailed plans regarding the tariffs on $50bn worth of Chinese imports led Beijing to retaliate with planned tariffs on $50bn of U.S. exports. The hardened Chinese stance led President Trump to threaten additional tariffs on $100bn worth of Chinese goods.
- While the announced tariffs are likely to merely shave off about 0.2pp from annualized GDP growth in the U.S. over the next two years, the potential for the conflict to escalate to a full-scale trade war is much more concerning.
- Economic data came in healthy with the ISMs holding near recent highs while auto sales came in slightly better than expected in March. Payrolls disappointed despite a healthy ADP print, but wage growth accelerated on the month.
Canadian Highlights
- It was a good week for the Canadian dollar despite the pullback in oil prices. The loonie was lifted by improved prospects of a North American trade deal, with a preliminary agreement on NAFTA 2.0 potentially as early as next weekend, when leaders gather for the Summit of the Americas in Peru.
- Economic data was mixed. The trade deficit widened, with the weakness in net exports a drag on Q1 growth.
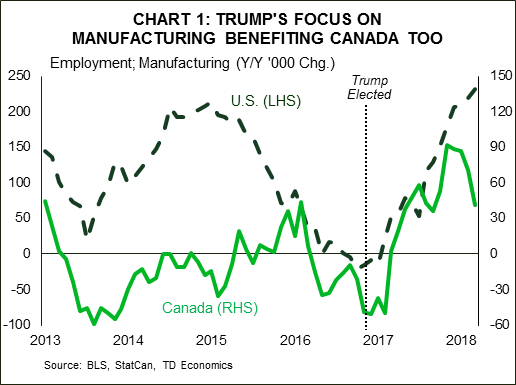
- On the other hand, the Canadian economy added an impressive 32.3 thousand jobs. The jobless rate held steady at 5.8%, with wage growth accelerating to 3.3% y/y. Wages were up a solid 3.1% y/y for permanent employees.
U.S. - Retaliating on Retaliation: Trade War Drums Beating
Equities have been on a rollercoaster ride this week, driven by shifting headlines on U.S.-China trade tensions. Initially, the U.S. announced details on its plans to levy a 25% tariff on $50 bn worth of goods imports from China, targeting some 1,300 items, including aircraft parts, batteries and medical devices. In a tit-for-tat move, China announced it would respond by mirroring the tariffs on American goods imports. The range of products targeted by China however, which included soybeans, cars, aircraft and chemicals, was narrower at 106 products. Later in the week, Pres. Trump instructed the U.S. Trade Representative to consider an added set of tariffs on $100 bn worth of imports. In what's looking like a high-stakes poker game, China's Ministry of Commerce said that China was prepared to "hit back forcefully" - reigniting trade war fears.
It is important to distinguish between tariffs that we already have details on and the latest inflammatory rhetoric. The former are not overly concerning. We estimate that the U.S. tariffs (including enacted tariffs on steel and aluminum) could shave off about 0.1 pp from annual GDP growth over the next few years, and could add up to 0.1 pp annually on inflation. Depending on what's finally enacted following a consultation period, the price and demand impacts could be somewhat more pronounced if the tariffs are applied largely on consumer goods rather than business investment goods. On the other hand, China is targeting roughly 38% of American goods exports to China, which represent only about 0.3% of U.S. GDP. We estimate that these tariffs would reduce U.S. growth by up to 0.1 pp annually for the next two years. In this vein, slightly weaker U.S. demand could also act to offset some of the price pressures from the U.S. import tariffs.
The potential for the conflict to escalate is much more concerning. U.S. exports to China totaled $130 bn last year. This means that if the U.S. went ahead with tariffs on $100 bn of goods on top of what's already being considered, and China reciprocated, the direct impact from exports would be much harsher given that all U.S. goods exports to China would face tariffs. The indirect impacts related to supply chain disruptions and the hit to business confidence and investment would also be more pronounced.
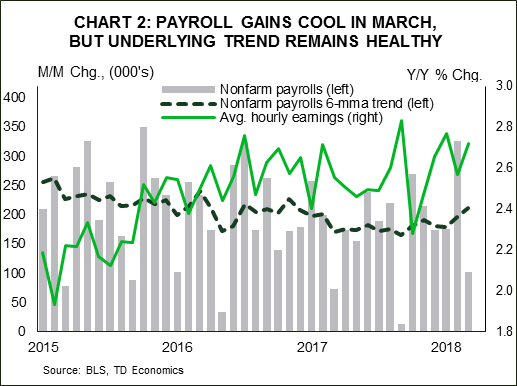
Developments on the trade front overshadowed decent signals from the economy. Auto sales came in slightly better than expected in March, and the ISM indices remained well in expansionary territory, despite easing off slightly (Chart 1). Payrolls gains slowed to 103k on the month, but this came atop of a very strong showing in February at 326k (Chart 2). Looking past the monthly noise, the underlying job market remains healthy, as demonstrated by increased wage gains - up 2.7% y/y.
Tax cuts and increased government spending are expected to add fuel to the labor market and the economy, with the latter expected to run at roughly 3% over the next few quarters. In short, the U.S. economy remains on a solid course, but further escalation in the trade conflict poses a material downside risk. The hope and expectation is for the conflict to be resolved through the 'The Art of the Deal' rather than 'The Art of War'.
Canada - Loonie Lifted on Prospects for NAFTA 2.0
It was a fairly quiet start to the month across Canadian financial markets with little in the way of economic data until late in the week. The data that did come was mixed. International trade disappointed, while the labour market surprised to the upside. Equity markets limped along, dipping through midweek before recovering to end the week where they started. They were pressured lower by oil prices which slipped across major benchmarks on a bearish U.S. inventory report. The loonie strengthened nonetheless, benefiting from improving NAFTA prospects amidst U.S. dollar strength.
The greenback was lifted by another round of protectionist rhetoric out of the White House. President Trump on Thursday night called for a tripling of the value of Chinese exports subject to tariffs, to $150 billion. This was done as a response to a perceived hardening of the stance in Beijing - with Chinese officials suggesting that they will retaliate "at all cost". While this is an unlikely scenario, since China's economy would likely face a near-collapse should Americans stop buying its wares, the more aggressive positioning certainly raises the probability of a disorderly outcome.
Barring a potential global recession, the tougher stance towards China could work in Canada's favour, offering an opportunity to fill some of the demand previously satiated by Chinese products. This is already apparent in the case of aluminum and steel, with more industries likely to be presented with an opportunity not available since the turn of the century - when China joined the WTO. This opportunity will be all the more apparent should a modernized trade pact, or NAFTA 2.0, be signed soon. With rumours of a potential announcement at the Summit of the Americas in Peru on April 13/14th, an agreement in principle may be on offer sooner than anticipated. While details would still need to be ironed out, such an outcome would allow U.S. trade negotiators to concentrate their efforts on levelling the playing field with China.
Canada's trade relationship with the U.S. remains by-and-large balanced. The goods surplus shrank to $2.6 billion in February, according figures released on Thursday, with the figure largely offset by a deficit on the services side of the ledger. NAFTA 2.0 would be positive in removing uncertainty for businesses on both sides of the border but the deal is unlikely to bring back manufacturing jobs to Canada or the U.S. en masse. Still, the sector is faring well currently. The American manufacturing sector added 22 thousand jobs in March, taking the yearlong tally to 242 thousand. And despite the 8 thousand pullback in March, the sector added 41 thousand jobs in Canada over the last twelve-months.
All in all, Canada's economy added 32 thousand jobs in March. This was above expectations but largely in line with the 296 thousand created over the past 12 months. The jobless rate was unchanged, as was wage growth - which remained at a healthy 3.1% y/y. Such performance, while unlikely to put a fire under the Bank of Canada, should provide plenty of comfort for another rate rise in the summer and a couple more next year, with a quicker tightening cycle likely particularly should NAFTA 2.0 be signed soon.
U.S.: Upcoming Key Economic Releases
U.S. Consumer Price Index - March
Release Date: April 11, 2018
Previous Result: 0.2% m/m, core: 0.2% m/m
TD Forecast: 0.0% m/m, 2.4% core 0.2% m/m
Consensus: 0.0% m/m, core 0.2% m/m
We expect headline CPI inflation to accelerate further to 2.4% y/y in March, with prices flat on the month on a seasonally adjusted basis. Gasoline prices were little changed on the month and we expect higher electricity prices to be offset by lower natural gas prices. Excluding food and energy, we expect core CPI to print another 0.2% m/m increase. This assumes a correction in core goods prices, led by apparel and vehicle prices, offset by a rebound in core services, driven by the shelter component. Core inflation should move higher to 2.1% y/y though largely on a base effect. Thus, the strength of the m/m increase will be key to watch.
Canada: Upcoming Key Economic Releases
Bank of Canada Business Outlook Survey
Release Date: April 9, 2018
The Bank of Canada's Business Outlook Survey (BOS) should reinforce the wider slowdown in the Canadian economy with a more cautious assessment of business conditions, but will stop short of sounding outright dovish. Since the previous survey, the economy has been subject to greater uncertainty on trade, a sharp minimum wage hike and a broad slowdown in housing, all the while without any relief on the poor competitive stance worsened by the US fiscal reform. We do not expect the survey to recognize recent progress in NAFTA talks, since consultations preceded the recent optimistic turn. However external demand remains robust, as evidenced by the pickup in US growth, and inflationary pressures continue to build, especially on the wage front or raw materials. This suggests the overall tone will be more mixed than the previous survey, but don't expect to hear firms suggest that growth is stalling.