Sample Category Title
Trade Rhetoric’s Continued To Roll The Markets
Trade war gets traction
The global trade war is moving from myth to reality. Not only is there a lot of talk, tit-for-tat action from the USA, China and EU are on the rise. The US threatened US$100 billion in tariffs and restrictions on Chinese investment, so China retaliated with punitive measures against 128 American goods. Adding fuel to the fire, China said it would respond to any additional US tariffs on Chinese products with countermeasures of the “same proportion”. Hopes are fading that renegotiation between America and China or mediation by the World Trade Organization would heal the rift.
The European Union's has warned it would respond to Trump Tariffs with its own 25% duties on $3.5 billion of American goods. Despite President Trump's tweet that trade wars are “good and easy to win”, this conflict is unlikely to resolve without damage. Broken trade routes threaten global growth. Weak commodity prices depend on free trade: endangering this tightens supply and drives up prices. Cyclical commodities like crude oil and base metals will have a difficult time as rhetoric ramps up. Soybeans will be most vulnerable since China is targeting punitive tariffs on US agricultural products. Gold should improve, given its safe haven status. Bitcoin and other crypto might not be safe havens: they have been losing value lately.
On the surface, there is much froth. Just as markets rallied, a report of US-China trade deadlock smacked them back down. Then yesterday, Trump's Chief Economic Advisor, Larry Kudlow, said he doubted that any concrete tariff action would happen for several months. Equities reacted significantly: energy stocks rebounded while defensive stocks in consumer staples and healthcare dropped. US treasuries rallied as risk appetite improved, 10-year yields jumped 2.80%.
Will job data block the slide?
World markets are set to tumble, after a glimmer of hope revived optimism that the US–China trade conflict would calm. US markets rose yesterday, and European marketplaces also climbed. The Euro Stoxx 50 closed at 3'430 (+2.68%), the DAX surged by 2.90% (12'305) and other European exchanges rose by more than 2%. However, hope was short-lived as President Trump then ordered his US Trade Representative to consider another US$100 billion in tariffs against China. Meanwhile, trade data is disappointing. America's February trade balance is USD -57.6 billion (previously -56.6 billion).
But employment might be a bright spot. March jobless claims were 215'000, down from February's 229'000), and personal income and spending grew in February by 0.40% and 0.20%. March nonfarm payrolls may surprise to the upside of the expected 185'000, suggesting stronger wage growth in the month. The USD remains the strongest currency in morning session, suggesting that the EUR/USD pair at 1.2225 will decline, approaching strong resistance at 1.2167 and headed to 1.2215 in the short-term.
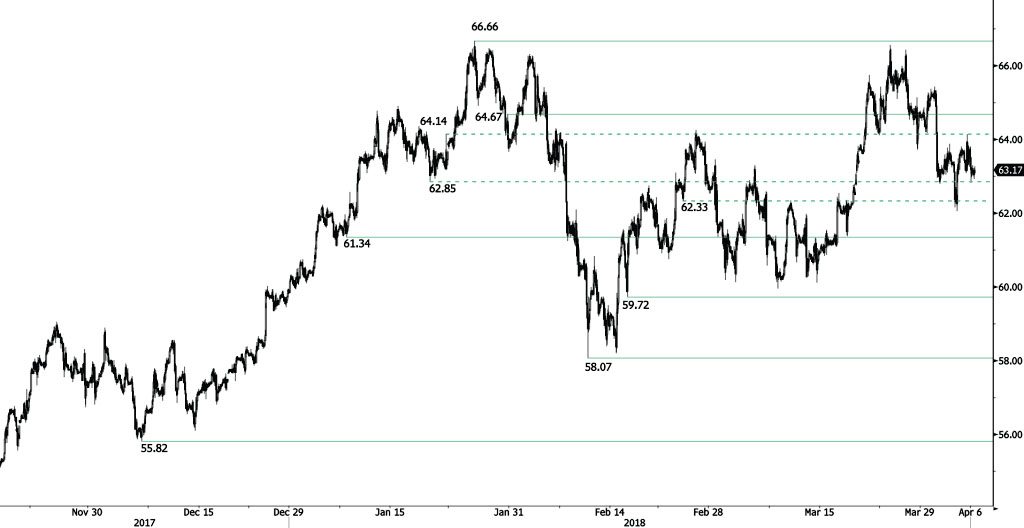
CRUDE OIL Weakening
Crude oil is declining following recent rise at 64.12, heading along the 62.90 range. The bullish pattern started in November 2017 is weakened. Crude oil is now contained between hourly support and resistance at 61.34 (08/01/2018 low) and 64.67 (30/01/2018 high). The technical structure suggests short-term decrease.
In the long-term, crude oil has recovered after its sharp decline last year. However, we consider that further weakness is very likely. For the time being, the pair lies in an upside trend since June 2017. Support lies at 42.20 (16/11/2016) while resistance is located at 77.83 (20/11/2014). Crude oil is trading above its 200 DMA.
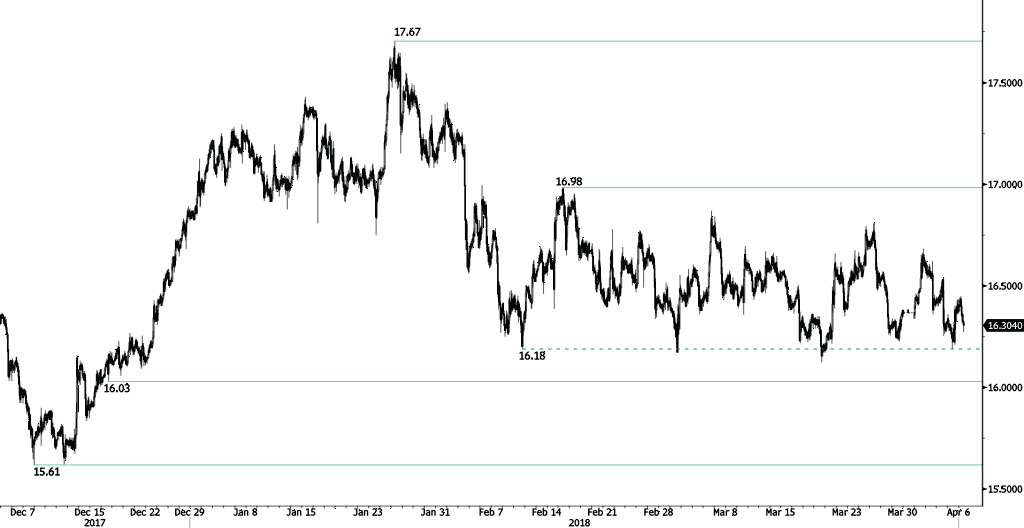
SILVER Bearish Momentum
Silver rising momentum stopped, the pair is now heading along 16.22 following recent rise at 16.45. Silver is currently contained between hourly support and resistance given at 16.03 (18/12/2017 low) and 16.98 (15/02/2018 high). The short-term technical structure suggests short-term downward moves.
In the long-term, the trend remains negative/ sideways. Further downside is very likely. The pair is trading below its 200 DMA. Resistance is located at 21.58 (10/07/2014 high). Strong support can be found at 11.75 (20/04/2009).
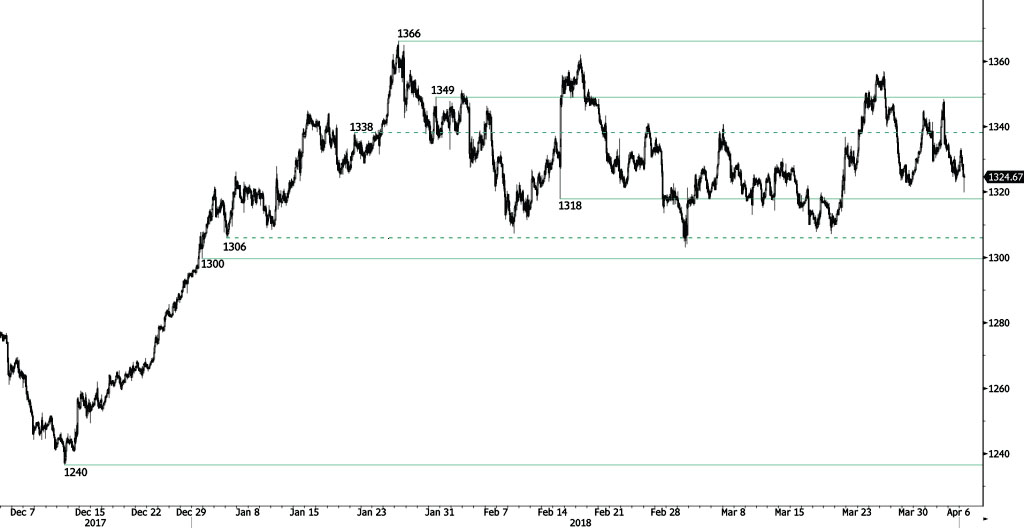
GOLD Testing Support At 1318
Gold strong selling pressures continue, the pair is decreasing from 1333 high, approaching hourly support at 1318 (14/02/2018 low). Hourly resistance at 1349 (30/01/2018 high) is distanced. The technical structure suggests short-term decrease.
In the long-term, the technical structure suggests that there is a growing upside momentum. A break of 1'392 (17/03/2014) is required to confirm it. A major support can be found at 1'045 (05/02/2010 low).
Markets steady as traders await China press briefing on US tariffs
While news that Trump is pushing for additional tariffs on another USD 100b of Chinese imports might raise some eyebrows, markets reactions are so far muted. At the time of writing, DAX is trading down -0.47%, CAC down -0.45% and FTSE down -0.19% only. The forex markets are bounded in yesterday's range in general, except that some weakness is seen in NZD.
 Traders are most likely waiting for a formal response from China. The MOFCOM is going to hold a press briefing at 8pm Beijing time, 1200GMT today, while the country is on holiday.
Separately, South Korea has notified WTO of the plan to suspend tariff concessions on USD 480m of US imports, in response to US measures against the country. The Trade Ministry said it's in equal value to South Korean washing machines and solar panels affected by the US tariffs.
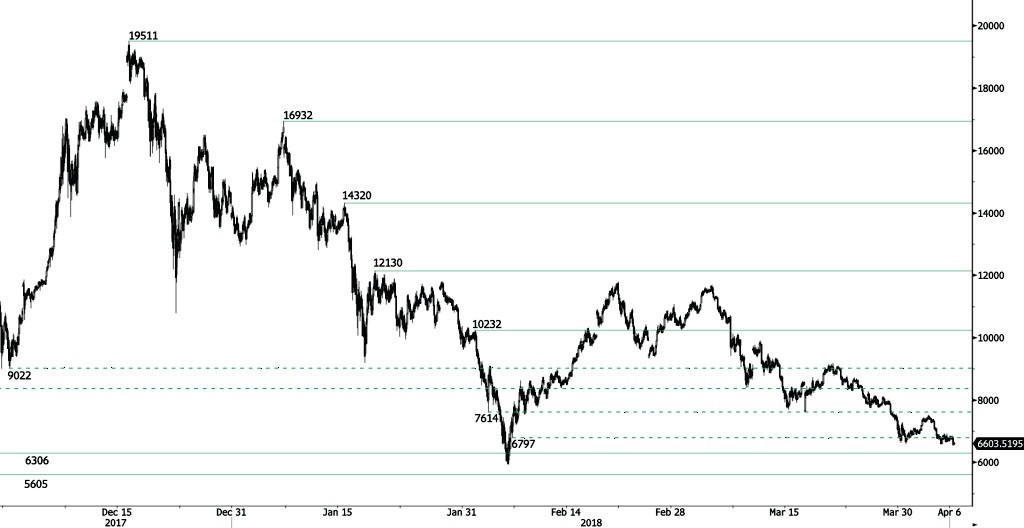
BITCOIN Testing Support At 6306
Bitcoin decline continues, trading below 6700 and approaching the 6500 range. Bitcoin bearish pattern started in March 2018 continues. The pair is contained between hourly support and resistance given at 6306 (13/11/2017 low) and 10232 (01/02/2018 high). The technical structure suggests further short-term sideways trading moves.
In the long-term, the digital currency has had an exponential growth but also presented important downturns. There is decent likelihood that the currency could stabilize between 7'000 - 12'000 in 2018. Bitcoin is trading below its 200 DMA (7700 range).
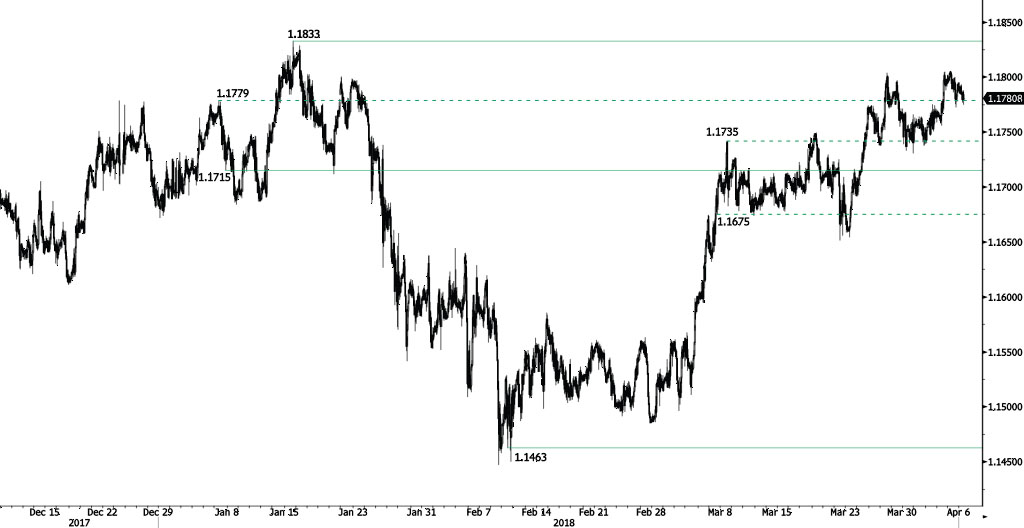
EUR/CHF Continued Decrease
EUR/CHF decline continues, distancing 1.18 and heading along the 1.1775 range. Hourly support and resistance are given at 1.1715 (07/01/2018 low) and 1.1833 (15/01/2018 high). The short-term technical structure suggests short-term downward trading moves.
In the longer term, the technical structure has reversed. Strong resistance is given at 1.20 (level before the unpeg). Yet, the ECB's slowing QE program is likely to cause buying pressures on the euro, which should weigh in favour of the EUR/CHF. Support can be found at 1.0234 (20/04/2015 low).
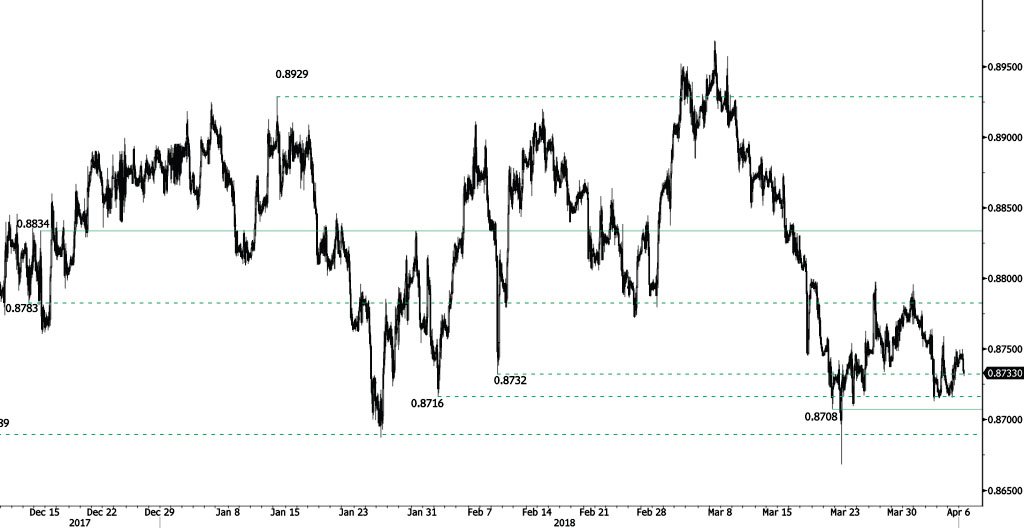
EUR/GBP Decreasing
EUR/GBP is decreasing following recent rise at 0.8750, heading along the 0.8728 range. EUR/ GBP bearish pattern started in March is maintained. Hourly support and resistance are given at 0.8708 (21/03/2018 low) and 0.8834 (14/12/2017 high). The technical structure suggests short-term decrease.
In the long-term, the pair has largely recovered from 2015 lows. The technical structure suggests further upside pressure. Strong resistance can be found at 0.9500 (psychological level) while support remains at 0.8304 (05/12/2016 low). The pair is trading below its 200 DMA.
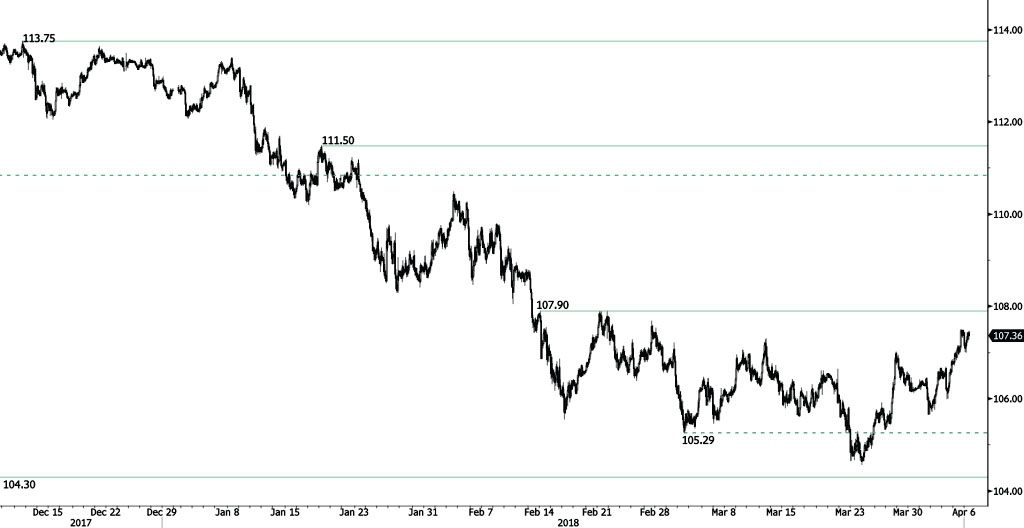
USD/JPY Approaching Resistance At 107.90
USD/JPY bullish momentum continues, trading above 107.40 and approaching hourly resistance at 107.90 (14/02/2018 high). Heading along the 107.65 range. Hourly support remains at 104.30 (08/11/2016 low). The bearish pattern started in January 2018 is maintained. The short-term technical structure suggests further short-term increase.
We favor a long-term bearish bias. Support remains at 101.20 (09/11/2016 low). A gradual rise toward the major resistance at 125.86 (05/06/2015 high) seems unlikely. Expected to decline further support at 101.20 (09/11/2016 low). The pair trades largely below its 200 DMA.
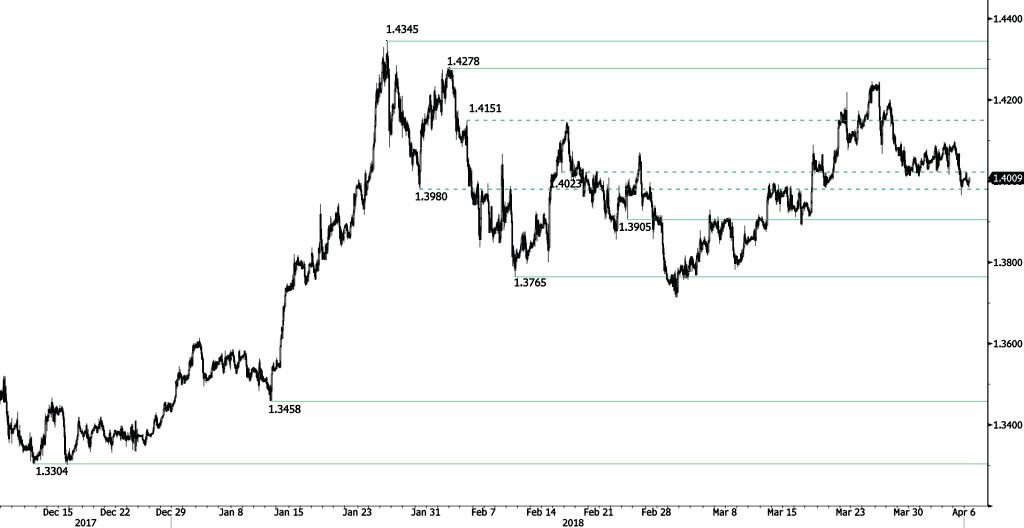
GBP/USD Testing The 1.40 Range
GBP/USD continues declining, breaking hourly support at 1.4023 (30/01/2018 low) and heading along the 1.3980 range. Hourly support and resistance are now given at 1.3905 (23/02/2018 low) and 1.4278 (02/02/2018 high). The technical structure suggests further short-term decrease.
The long-term technical pattern is reversing. The Brexit vote had paved the way for further decline but the pair is moving to 2016 highs. Long-term support and resistance are given at 1.1841 (07/10/2017 low) and 1.5018 (24/06/2016 high).