Sample Category Title
GBP/USD Analysis: Moves In Narrow Channel
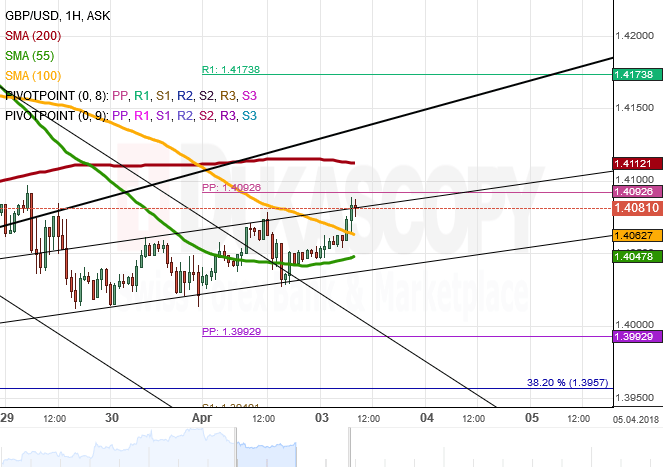
The British Sterling continues to move in a narrow channel against the US Dollar for the third consecutive session.
This short-term pattern was formed when a bullish correction against the general bearish trend began last week. Along the way, the Pound breached the previously-existing steep channel down together with the 55-hour SMA.
It seems that some upside potential still exists in the market in this session that could result in a breakout of the 100-hour moving average. The ultimate high for today should be the 1.4110 area where the 200-hour SMA is located.
In case the 55-hour SMA fails to support the rate today, the rate could struggle to surpass the 1.40 area, as the monthly PP is located nearby.
The general tendency this week is likely to be south down to the senior channel at 1.3950.
EUR/USD Analysis: Faces Strong Resistance
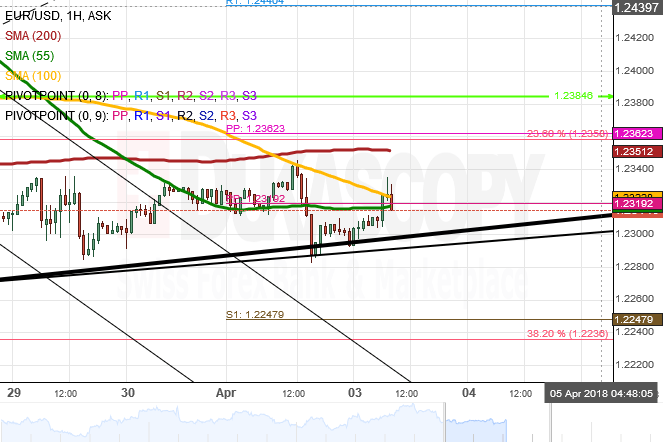
EUR/USD spent the Monday morning calmly in between the bounds of the 55– and 200-hour SMAs. Following a test of the 100-hour moving average mid-day, the pair fell down to the senior channel circa 1.23 where it remained located this morning.
The pair is currently stranded between two strong barriers, namely the senior pattern and the combined resistance of the 55– and 100-hour SMAs and the monthly PP circa 1.2320.
Given that no significant fundamentals are scheduled for today, the pair should lack enough strength to dash through this cluster. However, the US Dollar might still be weakened by US-China trade tensions that could actually put addition upward pressure on the Euro.
Upside potential today is until 1.2365, while a fall should not exceed the 1.2250 mark.
EUR/GBP 4H Chart: Continued To Trade South
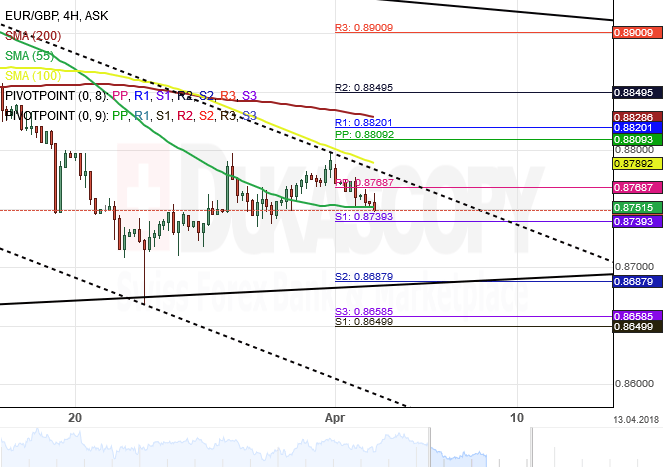
The single European currency has been trading in a downtrend channel against the Pound Sterling since the end of August 2017. The currency pair started to fall after it tested the upper border of the downtrend channel on August 29.
During this decline, the EUR/GBP exchange rate has reached a ten-month low level and has broken all previously drawn patterns. Moreover, a new junior descending channel has been mapped out to trail the market movement. Meanwhile, the 55– hour simple moving average was providing support for the pair near 0.8751 and could hinder the price from falling further.
As for near future, bears are likely to continue dominating the currency exchange rate until it reaches a significant support level set by the combination of the weekly and the monthly PPs at 0.8658.
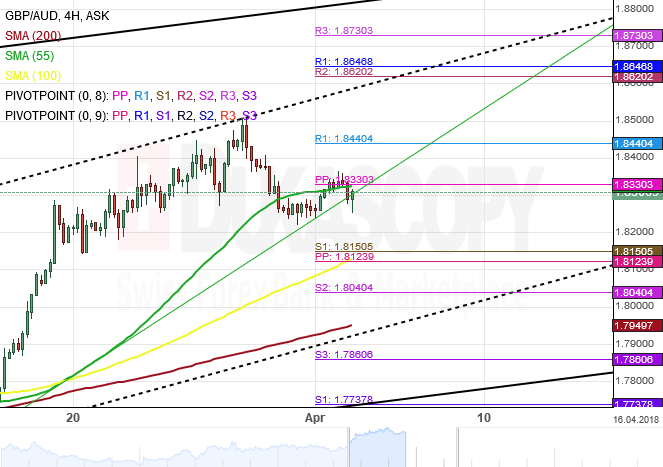
GBP/AUD 4H Chart: Sterling Continues To Strengthen
The GBP/AUD currency pair has been steered in several long and medium-term channel which has guided the price higher since 2017. The most important pattern is the dominant ascending channel which was formed on September 7.
When looking at the pair movement in the short term, the junior pattern is an ascending channel which was formed early March. The British Pound bounced off its lower boundary and has since surged against the Australian Dollar.
Everything being equal, the exchange rate is likely to continue trading north. However, a corrective movement south is a possibility during the following trading sessions. Though, the pair could encounter a massive support cluster set by the combination of the weekly, the monthly and the 100– hour simple moving average near 1.8123.
WTI OIL Trades In Recovery Mode After Suffering Heavy Losses On Monday, API Data Eyed For Fresh Signal
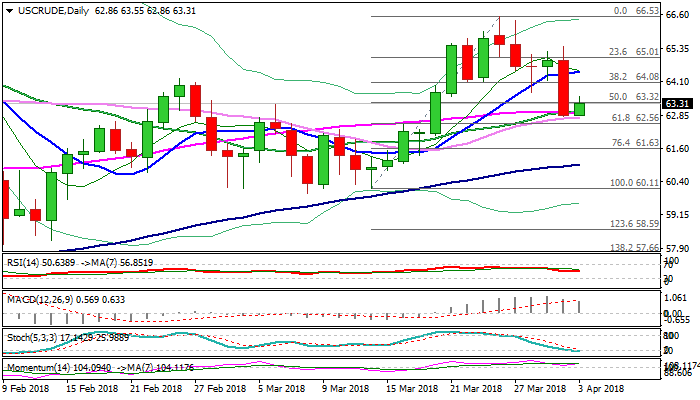
Oil price moved higher on Tuesday, retracing a part of Monday's strong fall (oil price was down 3.2% in the biggest one-day fall since 07 Feb).
Oil price came under pressure on concerns over increased Russian output which offset positive impact from slowdown of US oil production.
Two-legged pullback from $66.53 peak found footstep at $62.80 and was contained by rising 30SMA.
Subsequent bounce was so far mild and limited by thick 4-hr cloud (spanned between $63.32 and $65.15), expected to keep bearish bias while cloud base caps.
Signals of stronger recovery action require penetration of 4-hr cloud and regain of next pivot at $64.22 (Fibo 38.2% of $66.53/$62.80 fall)which would improve near-term picture.
Bearish scenario requires early recovery rejection and fresh weakness through key supports at $62.75 (30SMA) and $62.56 (Fibo 61.8% of $60.11/$66.53 rally) which would generate strong bearish signal.
Focus turns towards release of US API crude stocks report, due later today, which would provide fresh direction signal.
Last week's surprise build of crude inventories put oil price under strong pressure, which could be likely scenario if today's report shows further increase of crude stocks.
Res: 63.68, 64.22, 64.66, 65.11
Sup: 62.75, 62.56, 62.00, 61.63
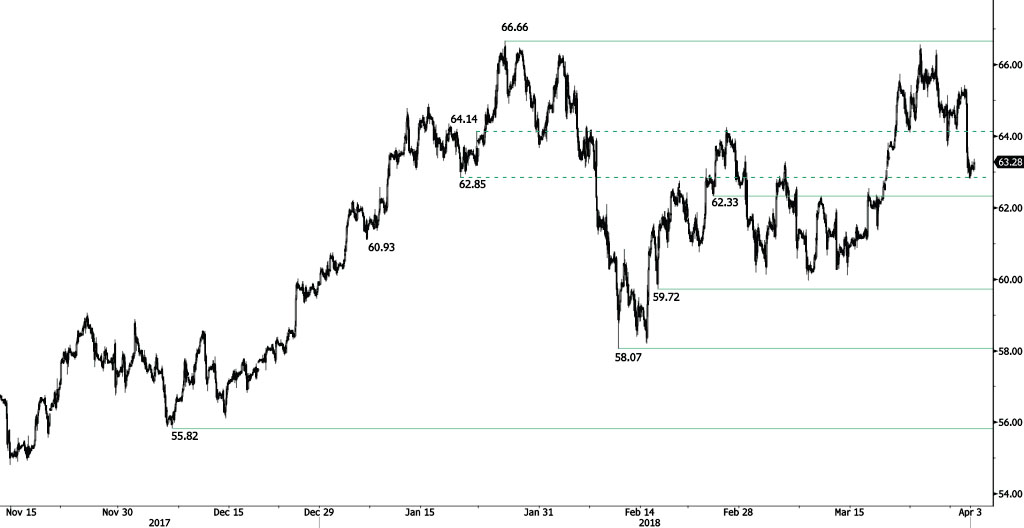
CRUDE OIL Recovery Phase Following Sharp Decline
Crude oil is starting a recovery phase after reaching 62.80 low, breaking hourly support at 62.85 (19/01/2018 low) and currently trading below 64. Heading along the 63.60 range. The bullish pattern started in November 2017 is confirmed. Silver is currently contained between hourly support and resistance at 62.33 (23/02/2018 low) and 66.66 (25/01/2018 high). The technical structure suggests short-term upward moves.
In the long-term, crude oil has recovered after its sharp decline last year. However, we consider that further weakness is very likely. For the time being, the pair lies in an upside trend since June 2017. Support lies at 42.20 (16/11/2016) while resistance is located at 77.83 (20/11/2014). Crude oil is trading largely above its 200 DMA.
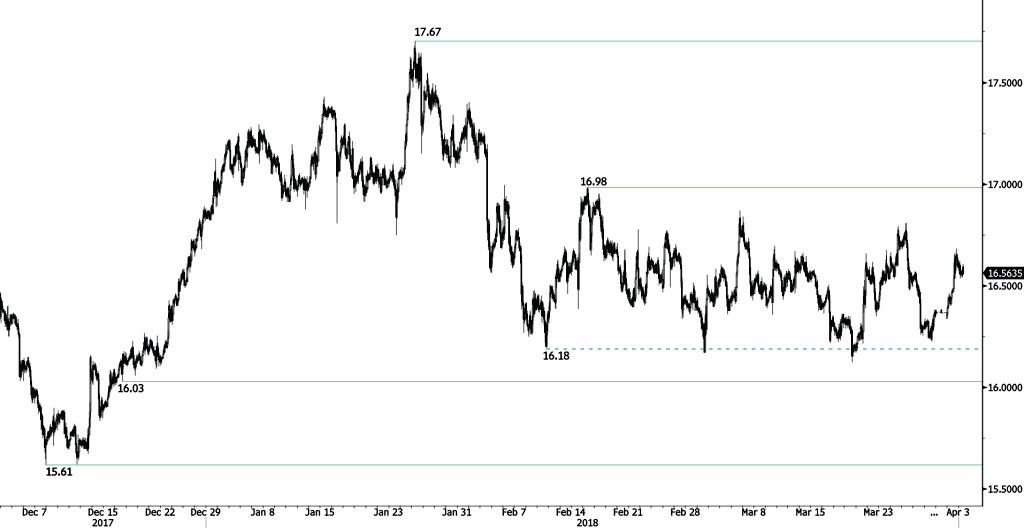
SILVER Trading Above 16.50
Silver selling starts back following recent rise at 16.68, approaching the 16.53 range. Silver is contained between hourly support and resistance given at 16.03 (18/12/2017 low) and 16.98 (15/02/2018 high). The short-term technical structure suggests downward moves.
In the long-term, the trend remains negative/ sideways. Further downside is very likely. The pair is trading below its 200 DMA. Resistance is located at 21.58 (10/07/2014 high). Strong support can be found at 11.75 (20/04/2009)
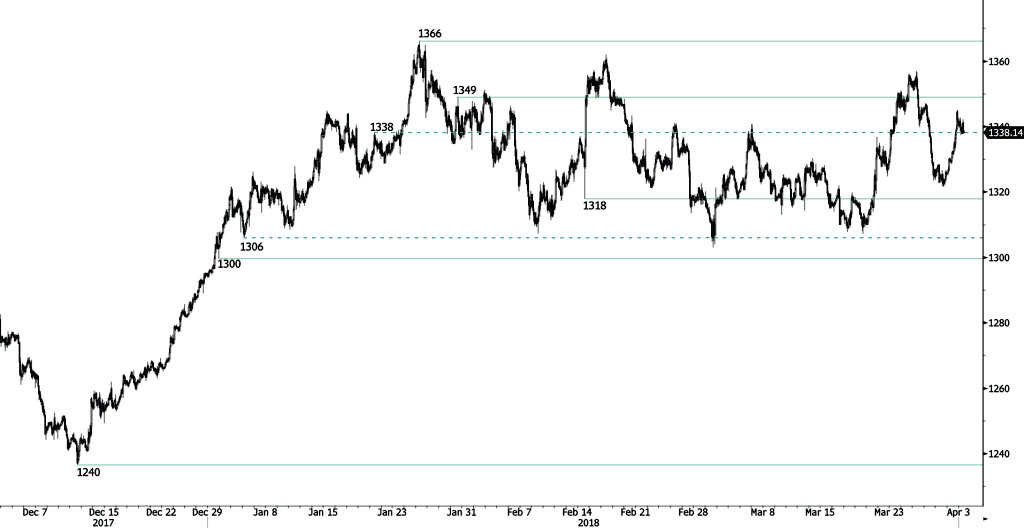
GOLD Profit Taking
Gold is declining following recent rise at 1345, approaching the 1336 range. Hourly support and resistance are given at 1318 (14/02/2018 low) and 1366 (25/01/2018 high) The technical structure suggests short-term decline.
In the long-term, the technical structure suggests that there is a growing upside momentum. A break of 1'392 (17/03/2014) is required to confirm it. A major support can be found at 1'045 (05/02/2010 low).
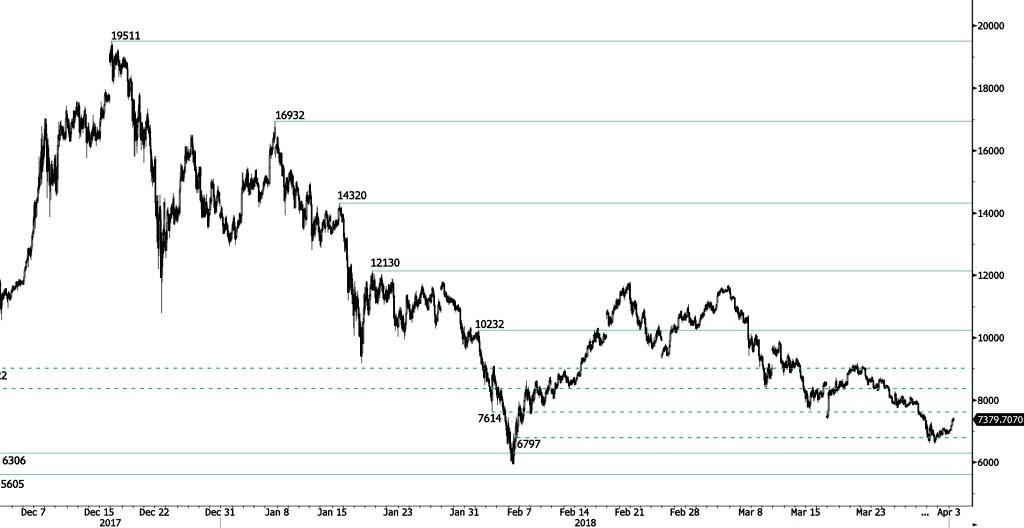
BITCOIN Ready To Bounce
Bitcoin bearish trend stops after breaking hourly support at 6797 (06/02/2018), currently trading at the 7350 range and expected to approach 7460. Bitcoin bearish pattern started in March continues. The pair is now contained between hourly support and resistance given at 6306 (13/11/2017 low) and 10232 (01/02/2018 high). The technical structure suggests shortterm increase.
In the long-term, the digital currency has had an exponential growth but also presented important downturns. There is decent likelihood that the currency could stabilize between 7'000 - 12'000 in 2018. Bitcoin is trading below its 200 DMA (7500 range).
EUR/CHF Bullish Consolidation
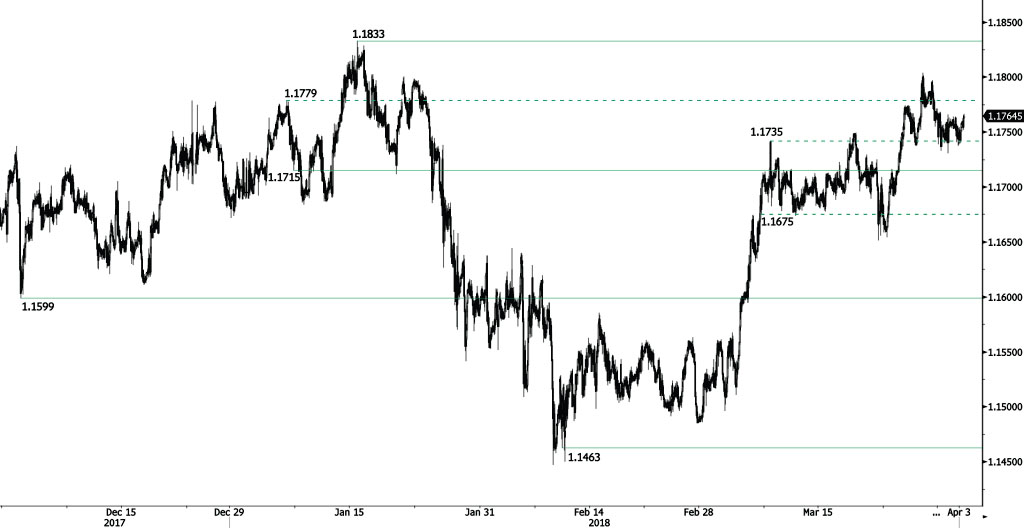
EUR/CHF consolidation phase at 1.1750 continues. Hourly support and resistance are given at 1.1715 (07/01/2018 low) and 1.1833 (15/01/2018 high). The short-term technical structure suggests further short-term sideways trading moves.
In the longer term, the technical structure has reversed. Strong resistance is given at 1.20 (level before the unpeg). Yet, the ECB's slowing QE program is likely to cause buying pressures on the euro, which should weigh in favour of the EUR/CHF. Support can be found at 1.0234 (20/04/2015 low).