Sample Category Title
USD/JPY Mid-Day Outlook
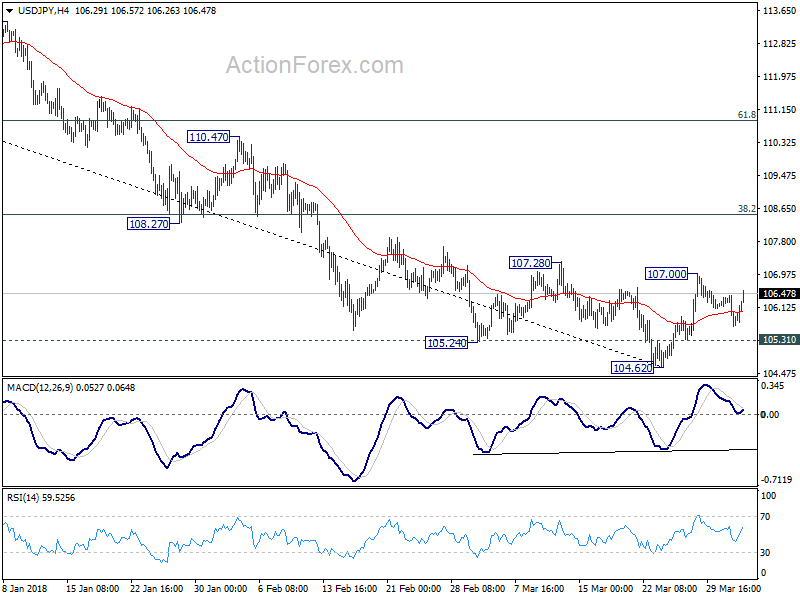
Daily Pivots: (S1) 105.55; (P) 105.99; (R1) 106.34; More...
Intraday bias in USD/JPY remains neutral first. Another rise is mildly in favor as long as 105.31 minor support holds. Above 107.00 will target 38.2% retracement of 114.73 to 104.62 at 108.48. At this point, there is no confirmation of trend reversal yet. Hence, we'll look at the reaction from 108.48 (which is close to 108.12 too) to assess the chance. On the downside, below 105.31 minor support will indicate that the rebound is completed and turn bias back to the downside for 104.62 and below.
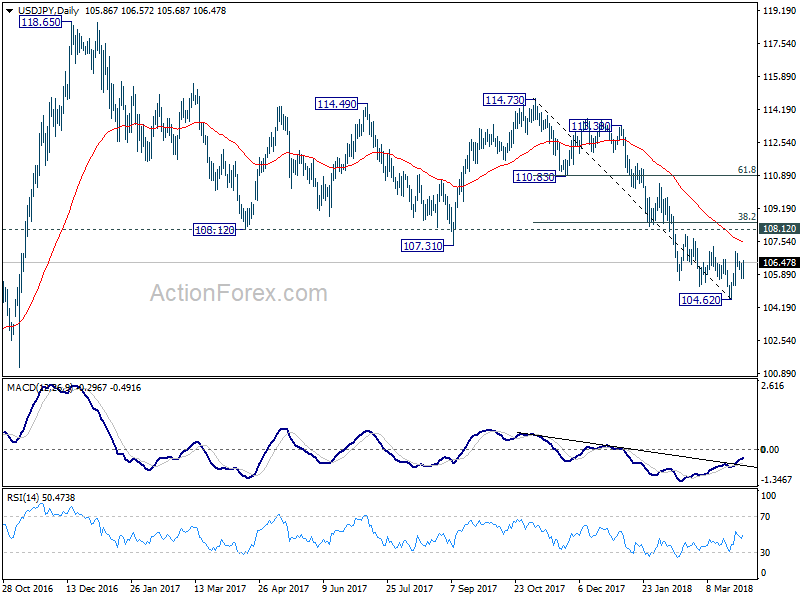
In the bigger picture, medium term down trend from 118.65 (2016 high) is still in progress and extending. Build up in downside momentum argues that it might be extending the whole corrective pattern from 125.85 (2015 high). 100% projection of 118.65 to 108.12 from 114.73 at 104.20 will be a key level to watch as firm break there could bring downside acceleration. And in that case, 98.97 key support level (2016 low) would at least be breached. This bearish case will now be favored as long as 108.12 support turned resistance holds.
USD/CHF Mid-Day Outlook
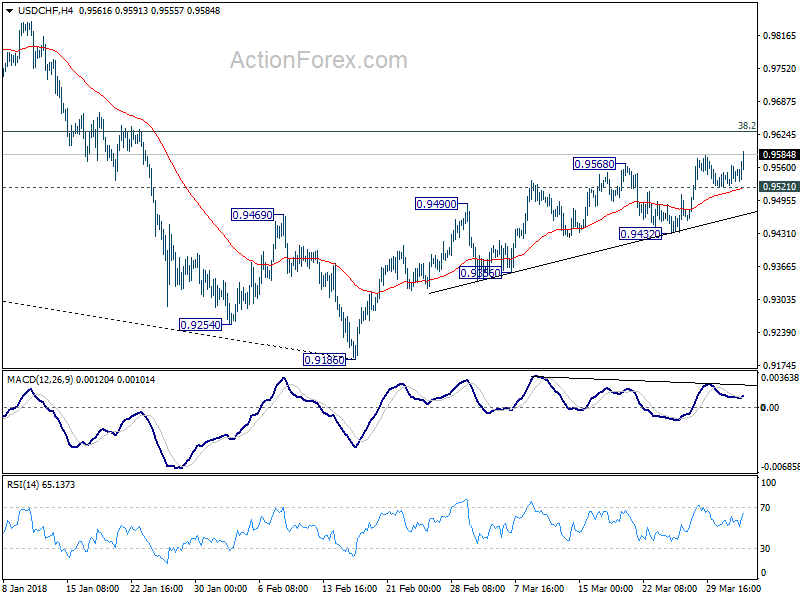
Daily Pivots: (S1) 0.9527; (P) 0.9546; (R1) 0.9570; More...
USD/CHF's rebound from 0.9186 resumes and reaches as high as 0.9591 so far. Intraday bias is back on the upside for further rally. At this point, we'd be cautious on strong resistance from 0.9626 key fibonacci level to limit upside. On the downside, below 0.9521 will turn intraday bias back to the downside for 0.9432 support. Break there will indicate near term reversal and completion of rebound from 0.9186. However, sustained break of 0.9626 will be another evidence of larger reversal. In this case, further rise would be seen to next fibonacci level at 0.9900.
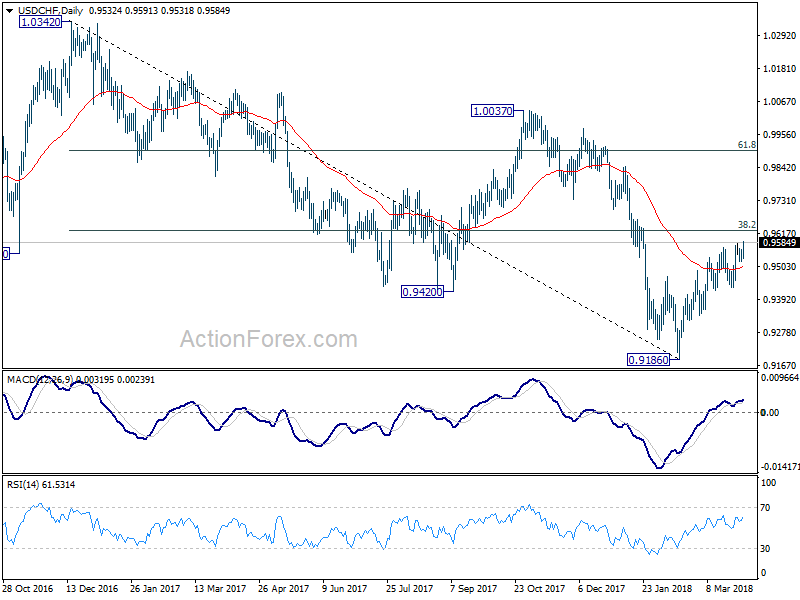
In the bigger picture, fall from 1.0342 is seen as a medium term down trend. Main focus is on 38.2% retracement of 1.0342 (2016 high) to 0.9186 (2018 low) at 0.9626. Sustained break there will add to the case of trend reversal and target 61.8% retracement at 0.9900 and above). However, rejection from 0.9626 will maintain medium term bearishness for another low below 0.9186.
GBP/USD Mid-Day Outlook
Daily Pivots: (S1) 1.4014; (P) 1.4046; (R1) 1.4074; More....
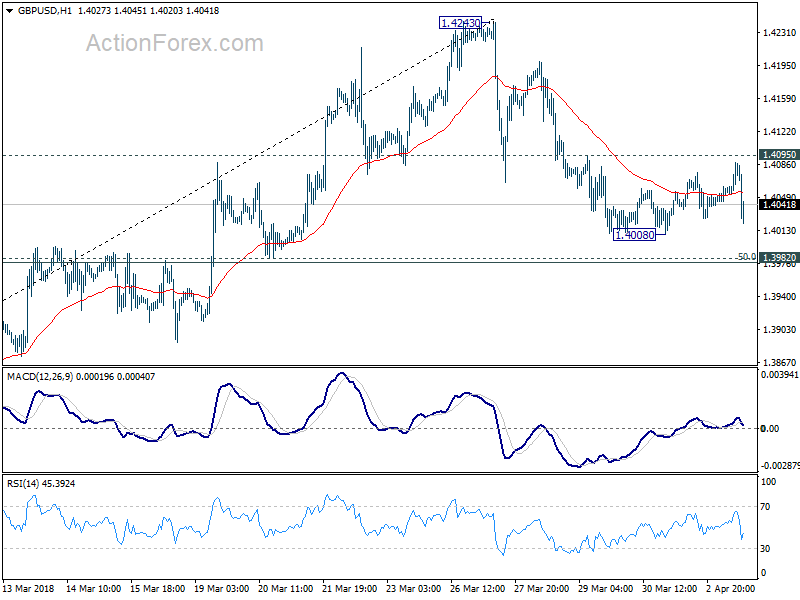
Intraday bias in GBP/USD remains neutral as it's bounded in right range above 1.4008 temporary low. On the downside, firm break of 1.3982 will indicate completion of the rise from 1.3711. In that case, intraday bias will be turned back to the downside for retesting 1.3711. Nonetheless, strong rebound from 1.3982, followed by break of 1.4243 will target 1.4345 resistance. Decisive break there will resume larger up trend and target 61.8% projection of 1.3038 to 1.4345 from 1.3711 at 1.4519 next
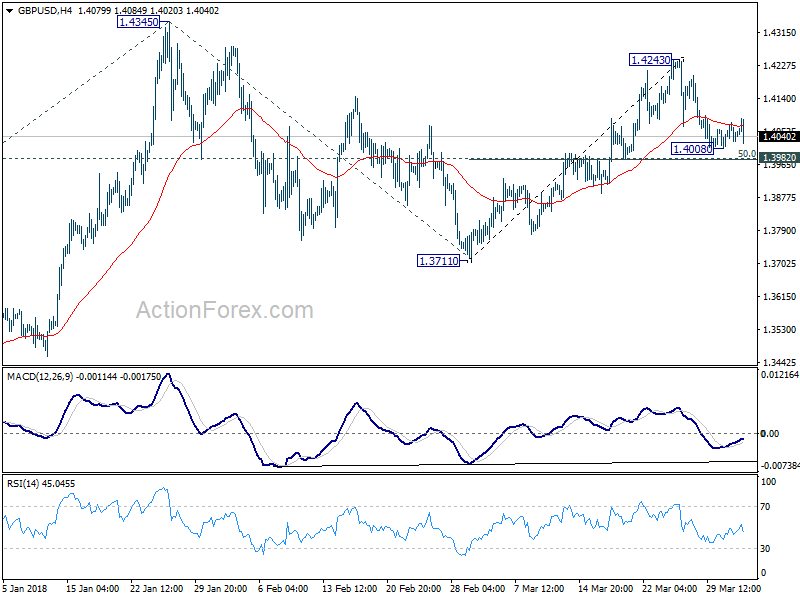
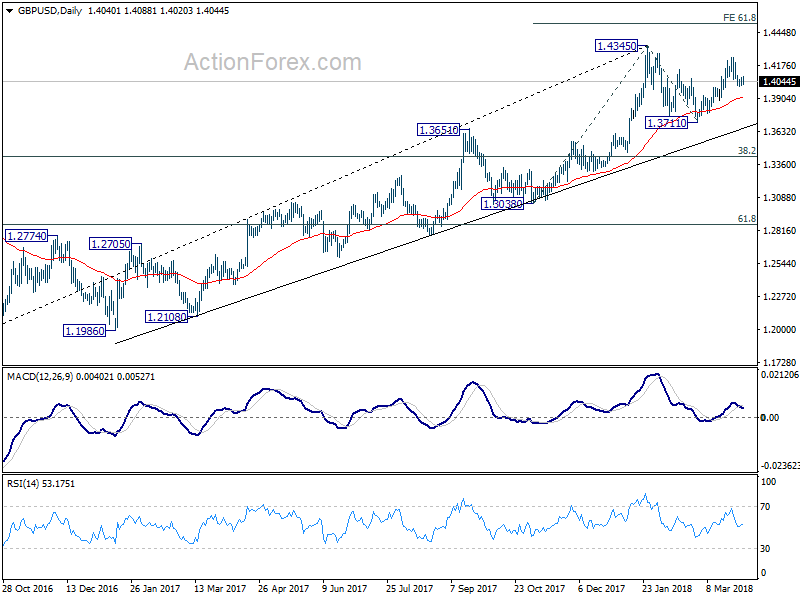
In the bigger picture, as long as 1.3038 support holds, medium term outlook in GBP/USD will remains bullish. Rise from 1.1946 is at least correcting the long term down from 2007 high at 2.1161. Further rally would be seen back to 38.2% retracement of 2.1161 (2007 high) to 1.1946 (2016 low) at 1.5466. However, GBP/USD fails to sustain above 55 month EMA (now at 1.4259) so far. Break of 1.3038 support, will suggest that rise from 1.1946 has completed and will turn outlook bearish for retesting this low.

EUR/USD Mid-Day Outlook
Daily Pivots: (S1) 1.2273; (P) 1.2309 (R1) 1.2337; More....
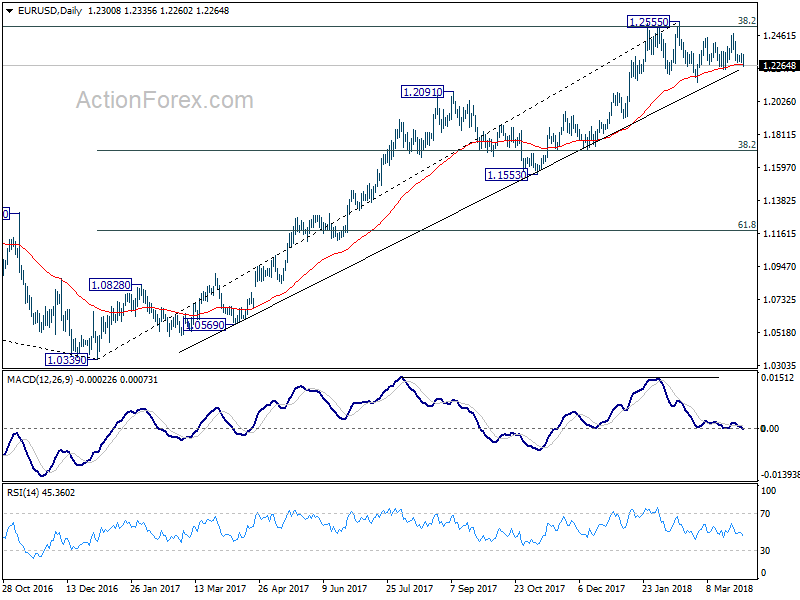
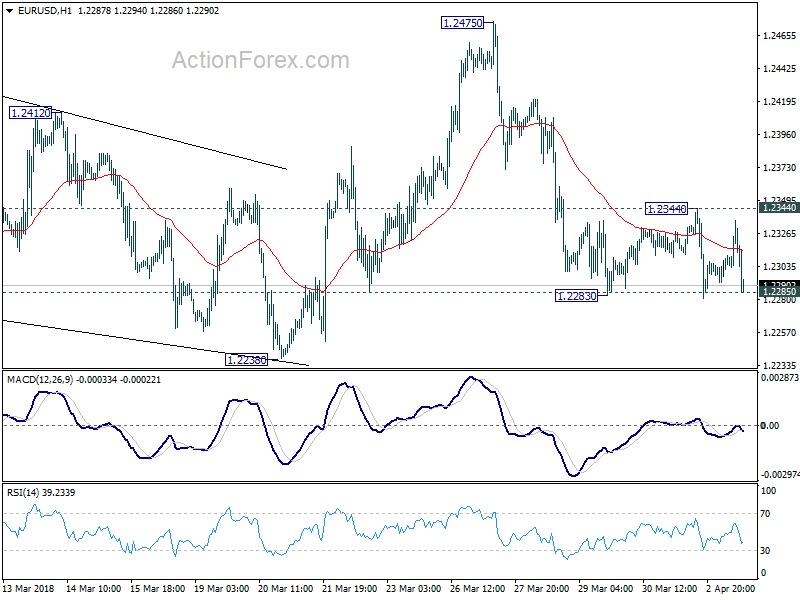
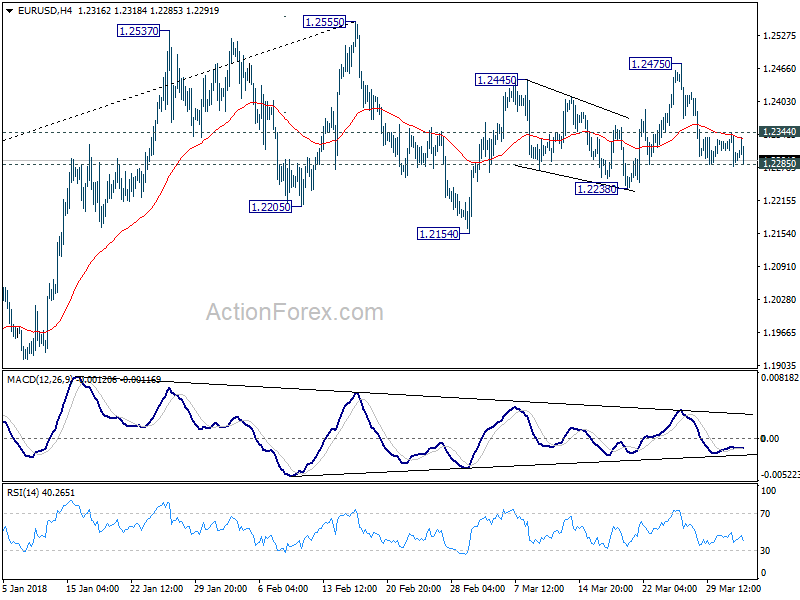
EUR/USD's strong break of 1.2285 support should now confirm completion of the three wave rebound from 1.2154, at 1.2475. Intraday bias is back to the downside for 1.2238 support and then 1.2154. Note that, current development is also seen as another sign of rejection by 1.2516 key fibonacci level. Firm break of 1.2154 will pave the way to 38.2% retracement of 1.0339 to 1.2555 at 1.1708. This will now be the preferred case as long as 1.2344 resistance holds.
In the bigger picture, key fibonacci level at 38.2% retracement of 1.6039 (2008 high) to 1.0339 (2017 low) at 1.2516 remains intact despite attempts to break. Hence, rise from 1.0339 medium term bottom is still seen as a corrective move for the moment. Rejection from 1.2516 will maintain long term bearish outlook and keep the case for retesting 1.0039 alive. Firm break of 1.1553 support will add more medium term bearishness. However, sustained break of 1.2516 will carry larger bullish implication and target 61.8% retracement of 1.6039 to 1.0339 at 1.3862 in medium term. 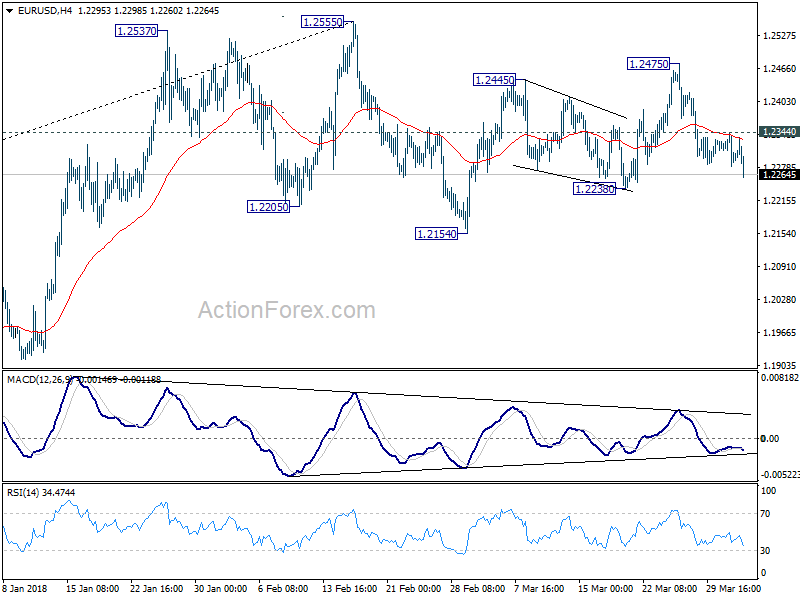
Euro Selling Gathers Momentum against Dollar and Canadian, EUR/USD Breaks 1.2285 Finally
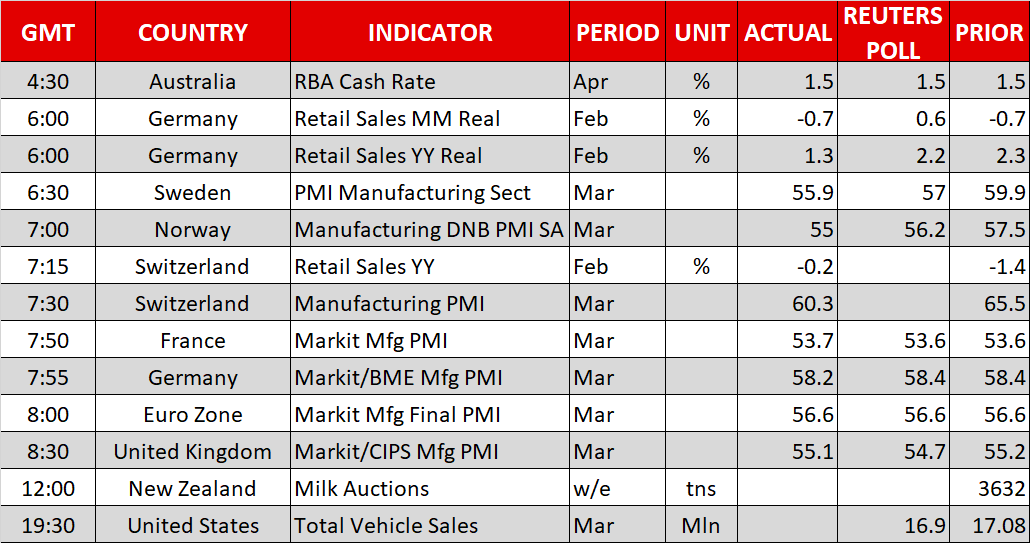
EUR/USD finally breaks 1.2285 support with some momentum in early US session. That could be seen as a sign that the forex traders are finally back from holiday, and starting to commit on a position. Events earlier today were important, but non-market moving. PMI data from UK and Eurozone were ignored. And RBA rate decision was like a non-event. With the selloff in EUR/USD now gathering steam, volatility could finally spread to other pairs and crosses.
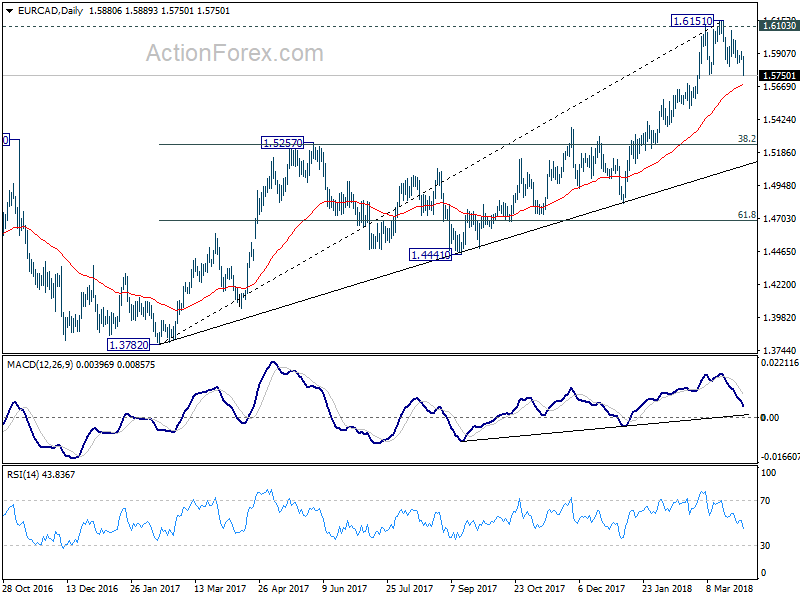
In particular, EUR/CAD is a cross that's worth a watch. Canadian seems benefit from news that US President Donald Trump is rushing to complete an initial NAFTA agreement by next week. With that, it would clear him of an important trouble. For now, USD/CAD is still holding above last week's low at 1.2814. But EUR/CAD has already dived through 1.5833 support to resume the fall from 1.6165.
Bare in mind that EUR/CAD is likely rejected by a key resistance at 1.6103, 2016 high. EUR/CAD would now be heading downward through 55 day EMA (now at 1.5677) in near term, and 38.2% retracement of 1.3782 to 1.6151 at 1.5246.
UK PMI manufacturing entered a softer growth phase
UK PMI manufacturing rose 0.1 to 55.1 in March, above expectation of 54.7. Markit noted that it signals "steady growth rate at the end of opening quarter". Director at IHS Markit Rob Dobson noted in the release that "UK manufacturing has entered a softer growth phase so far this year". And he emphasized that "the key question is whether growth can now be sustained, albeit at a lower level, into the coming months." He pointed to steady business optimism at an "elevated level", and moderating cost inflationary pressures. Thus, he noted "the sector looks set to make further slow and steady progress as we head through the spring."
Eurozone PMI manufacturing: Overall pace of growth still robust
Eurozone PMI manufacturing was finalized at 56.6 in March, unrevised, down from February's final reading of 58.6. It's also the biggest fall in the series since June 2011. Markit noted broad slowdown across "all nations". And there is increased signs of "supply chain constraints". Chief Business Economist Chris Williamson sounded calm in the release. He said that "we should not be too worried by the fall in the PMI as some moderation in the pace of growth from the surge seen at the turn of the year was inevitable, not least because short-term capacity constraints limit the economy's ability to grow so quickly for long periods." And, "the overall pace of growth nevertheless remains robust by historical standards, with decent PMI readings seen in all countries"
Also released, Germany manufacturing PMI was revised down to 58.2, from 58.4. France manufacturing PMI was revised up to 5.37, from 53.6. Italy manufacturing PMI dropped to 55.1 in March, down from 56.8 and missed expectation of 55.5. Swiss retail sales dropped -0.2% yoy in February, better than expectation of -0.7% yoy. SVME PMI dropped to 60.3, down from 65.5 and missed expectation of 64.3.
BoJ Kuroda: There were internal discussions on stimulus exit
BoJ Governor Haruhiko Kuroda said those at the central bank are "conducting various discussions" regarding stimulus exit "internally". However, it would confuse the markets by talking about the details now. And Kuroda said that would be inappropriate. In addition, Kuroda said the ETF buying program is "part of our monetary easing framework". For now, "there is still some distance to achieving our price target", we're not in a stage to debate the timing and means to (slow) ETF buying"
RBA stands pat and noted tightening in money markets
RBA rate decision today contained little surprise. Policymakers left the cash rate unchanged at 1.5% and made few changes in the policy statement. The central bank remained upbeat on growth and employment. Yet, it remained wary of the slow growth in wage. Meanwhile, the members took note of the recent decline in commodity prices and higher global short term interest rates. While the next rate move would likely be a hike, it might not be implemented for the rest of the year.
What was new in this meeting was the discussion on the higher short term rates. The members noted the recent "tightening of conditions in US dollar short-term money markets", as a result of Fed funds rate hike. The members indicated that higher rates have been transmitted to other economies, including Australia. Yet, this has not yet caused a problem in the country. We expect the RBA would continue monitoring the development for now.
More in RBA Aware of Recent Rise in Yields
China pledged retaliation to US at same proportion, scale and intensity
China's Ambassador to the United States Cui Tiankai said the tariffs on 128 US products started this week were a measure to the 232 steel and aluminum tariffs only. For the Section 301 tariffs on the USD 50-60b Chinese imports to US, Cui pledged to take "countermeasures of the same proportion and the same scale, same intensity." But for now, Cui said China has yet to decide on the countermeasures.
In an editorial in China Daily, Wang Hailou, a researcher at the Chinese commerce ministry's research center, said that "China does not like trade wars, but being on the side of justice, China has no choice but to enter a war to end a war." The article also said that "It would be beneficial for all if (China's) friendly overtures were accepted by Washington. However, at the moment it seems intent on turning a deaf ear to any suggestion that they each make concessions to reach an amicable agreement,"
EUR/USD Mid-Day Outlook
Daily Pivots: (S1) 1.2273; (P) 1.2309 (R1) 1.2337; More....
EUR/USD's strong break of 1.2285 support should now confirm completion of the three wave rebound from 1.2154, at 1.2475. Intraday bias is back to the downside for 1.2238 support and then 1.2154. Note that, current development is also seen as another sign of rejection by 1.2516 key fibonacci level. Firm break of 1.2154 will pave the way to 38.2% retracement of 1.0339 to 1.2555 at 1.1708. This will now be the preferred case as long as 1.2344 resistance holds.
In the bigger picture, key fibonacci level at 38.2% retracement of 1.6039 (2008 high) to 1.0339 (2017 low) at 1.2516 remains intact despite attempts to break. Hence, rise from 1.0339 medium term bottom is still seen as a corrective move for the moment. Rejection from 1.2516 will maintain long term bearish outlook and keep the case for retesting 1.0039 alive. Firm break of 1.1553 support will add more medium term bearishness. However, sustained break of 1.2516 will carry larger bullish implication and target 61.8% retracement of 1.6039 to 1.0339 at 1.3862 in medium term.
Economic Indicators Update
| GMT | Ccy | Events | Actual | Forecast | Previous | Revised |
|---|---|---|---|---|---|---|
| 22:30 | AUD | AiG Performance of Manufacturing Index Mar | 63.1 | 57.5 | ||
| 23:50 | JPY | Monetary Base Y/Y Mar | 9.10% | 9.60% | 9.40% | |
| 4:30 | AUD | RBA Rate Decision | 1.50% | 1.50% | 1.50% | |
| 6:00 | EUR | German Retail Sales M/M Feb | 0.70% | 0.70% | -0.70% | -0.80% |
| 7:15 | CHF | Retail Sales Real Y/Y Feb | -0.20% | -0.70% | -1.40% | -0.40% |
| 7:30 | CHF | PMI Manufacturing Mar | 60.3 | 64.3 | 65.5 | |
| 7:45 | EUR | Italy Manufacturing PMI Mar | 55.1 | 55.5 | 56.8 | |
| 7:50 | EUR | France Manufacturing PMI Mar F | 53.7 | 53.6 | 53.6 | |
| 7:55 | EUR | Germany Manufacturing PMI Mar F | 58.2 | 58.4 | 58.4 | |
| 8:00 | EUR | Eurozone Manufacturing PMI Mar F | 56.6 | 56.6 | 56.6 | |
| 8:30 | GBP | PMI Manufacturing Mar | 55.1 | 54.7 | 55.2 | 55 |
US 500 Index Daily Close Below 200-SMA Indicates Bearish Momentum
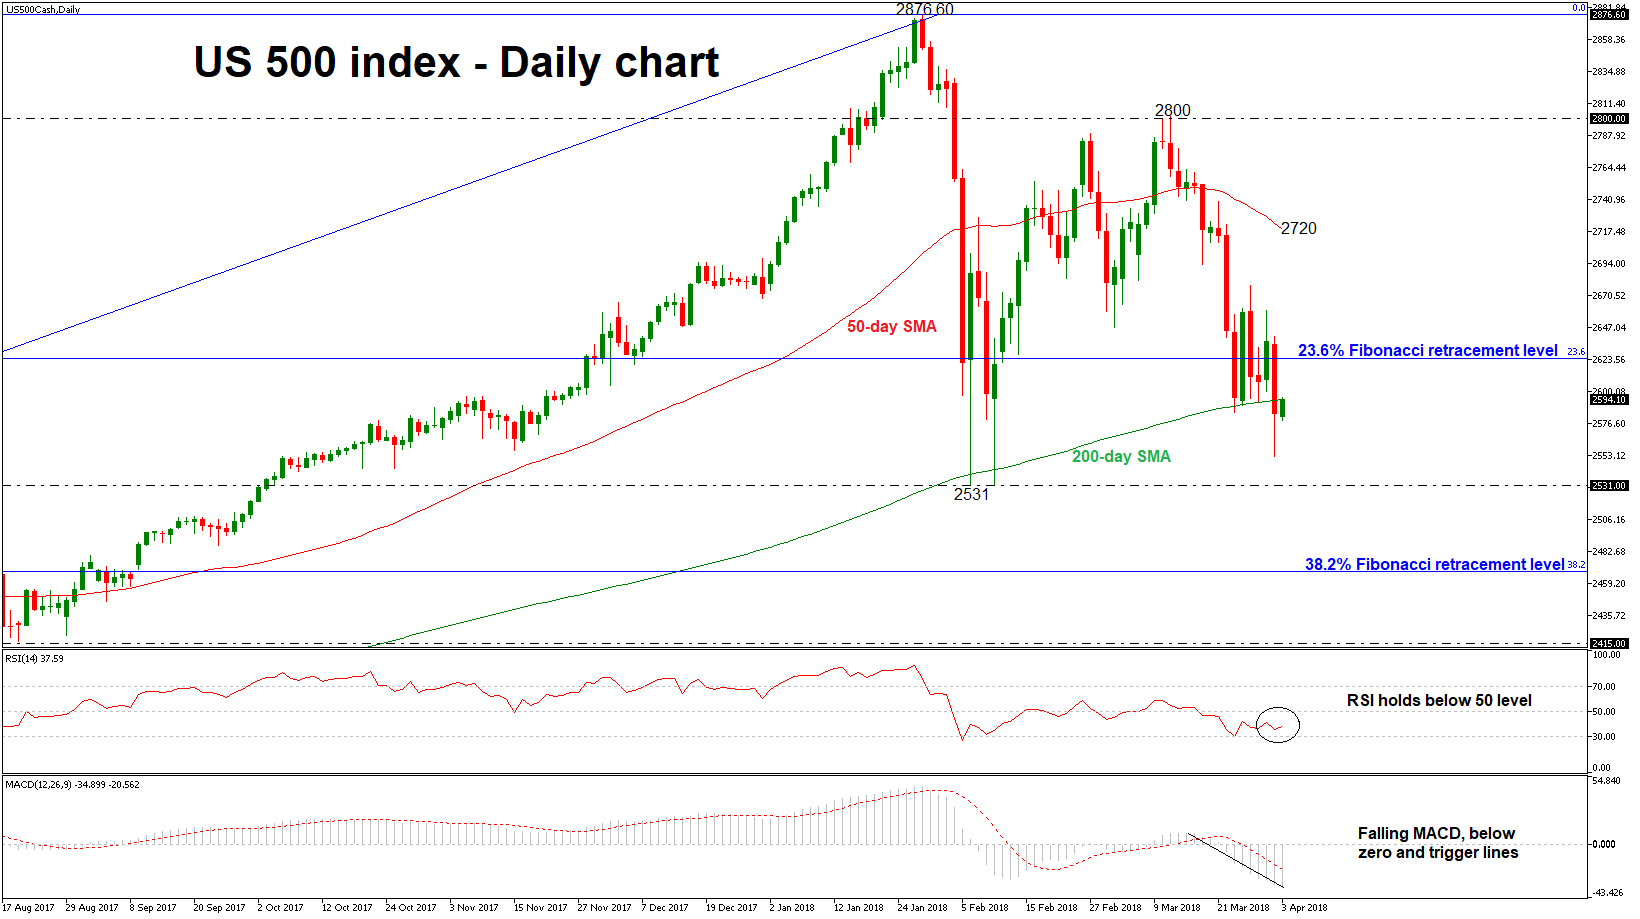
The US 500 index had a rough bearish ride over Monday’s trading session, as the index extended its losses and ended the day below the significant 200-day simple moving average (SMA). The bullish picture in the medium-term seems to weaken as there are some signs of a bearish correction. The technical structure supports that the downward retracement is likely to continue in the short-term.
Looking at momentum indicators, in the daily timeframe, the RSI indicator is lacking direction below the 50 level, while the MACD oscillator is falling aggressively under the zero and trigger lines. As a side note, the two SMAs (50 and 200) are pointing to the downside, confirming further declines.
If the price remains below the 200-SMA near 2594, which is acting as significant resistance level at the moment, this could push the index towards the next support at 2531, taken from the bottom on February 6. A stronger barrier though could be found at the 38.2% Fibonacci retracement level of 2468 of the upleg from 1807 to 2876.60.
On the flipside, a move to the upside could see immediate resistance at the 23.6% Fibonacci mark near 2624 but should the market increase positive momentum above this area, the 50-day SMA around 2720 could be the next level in focus. A successful jump above this zone could see a re-challenge of the previous 2-month high of 2800.
How Long Will Trump Persist With Confrontational Approach?
- Futures Pare Losses But Concerns Remain;
- How Long Will Trump Persist With Confrontational Approach?
- US Jobs Report Key in Otherwise Quiet Week.
Futures Pare Losses But Concerns Remain
The second quarter got off to a rough start on Monday, with trade war fears and declining tech stocks taking their toll on investor sentiment, but we are seeing a small rebound ahead of the open on Wall Street.
US futures are up to half a percentage point higher on Tuesday, but this pales in comparison to the losses recorded on Monday and reflects ongoing weakness in stocks. Donald Trump’s attacks on Amazon over the weekend put the spotlight back on the tech sector, as it tries to recover from the Facebook data scandal that threatens more regulation. Pressure on the sector doesn’t appear to be going away in the near-term which will continue to act as a drag on indices.
The threat of a trade war between the US and China is also weighing heavily on market sentiment and isn’t showing any sign of easing up. China’s decision to slap tariffs of up to 25% on 128 US products, while only amounting to around $3 billion of exports, has inflamed the situation and will likely lead to further counter-measures. Trump has already made plans for tariff’s on another $60 billion of Chinese exports, which will likely trigger another response from Beijing and further weigh on markets.
How Long Will Trump Persist With Confrontational Approach?
This comes against a backdrop of strong global economic growth and is seen by many as an unnecessary risk to it. Still, the stock market has performed very well since Trump’s election victory and the economy is very healthy. The President appears to be utilising the opportunity to deliver on some of the more hostile aspects of his campaign that threatens both in the near-term.
Should this become a prolonged venture and the stock market and economy begin the suffer at the expense of it, I would expect Trump to take a step back from such a confrontational approach and explore alternative avenues. As it is, the approach falls very much in line with his campaign and may sit very well with his core voter base, particularly if it delivers results.
US Jobs Report Key in Otherwise Quiet Week
For now, however, we may have to become accustomed to jittery markets, volatility and sudden dashes for safe havens which could see Gold and the yen remain well supported. US 10-year Treasuries have also been another notable source of safe haven flows, with yields having dropped off after testing 3% for much of March. The next test for US yields may come from Friday’s jobs report as we get the latest employment and earnings figures.
Prior to that it may be a slightly quieter week on the data front. Tuesday has little to offer on the data side while on Wednesday we’ll get the latest surveys on the services sector as well as the ADP employment number. The only event of note today will be a speech from Lael Brainard, a permanent voter on the FOMC who has previously very much stuck to the Fed line of gradual rate hikes being warranted.
DAX Slides As Chinese Tariffs Unnerve Investors
The DAX index has posted strong losses in the Tuesday session. Currently, the DAX is trading at 11,984 points, down 0.93% on the day. In economic news, there are a host of Eurozone indicators after eurozone markets were closed on Monday. German Retail Sales was unexpectedly soft, with a decline of 0.7%. This reading was well off the estimate of +0.7% and marked the fourth decline in five months. On the manufacturing front, German and eurozone manufacturing PMIs softened in March, although both indicators were within expectations and continued to point to expansion.
European stock markets have reacted to the escalating trade war, as China has fired the latest shot. On Monday, China responded to recent US tariffs, imposing its own duties on a range of US goods, including frozen pork and wines. This move is bound to raise tensions between the two economic giants and has investors concerned that a global trade war could be underway. If the tit-for-tat measures continue, both the US and Chinese economies could suffer, which could lead to a global slowdown.
The ECB is unlikely to change monetary policy anytime soon, but there are some rumblings from some of the wealthier eurozone members. German policymakers want to see a tighter policy, given the robust German economy. Last week, the head of the German central bank, Jens Weidmann, called for asset purchases to end “soon”. Weidmann also raised the possibility of interest rate hikes, saying that a rate increase in mid-2019 was “probably not entirely unrealistic.” Weidmann received support from the head of the Dutch central bank, Klaas Knot, who said that the ECB should not continue asset-purchases after September, as “the top priority is to normalize monetary policy”. In January, the ECB reduced its asset-purchase program to EUR 30 billion, and the program is scheduled to wind up in September. If the eurozone economy performs well and inflation moves higher, there will be more pressure on the ECB not to extend the asset-purchase program. If the bank decides to end this stimulus scheme, the euro could improve sharply.
European Stocks Tumble, Dollar Stalls As Trade Worries Persist
Here are the latest developments in global markets:
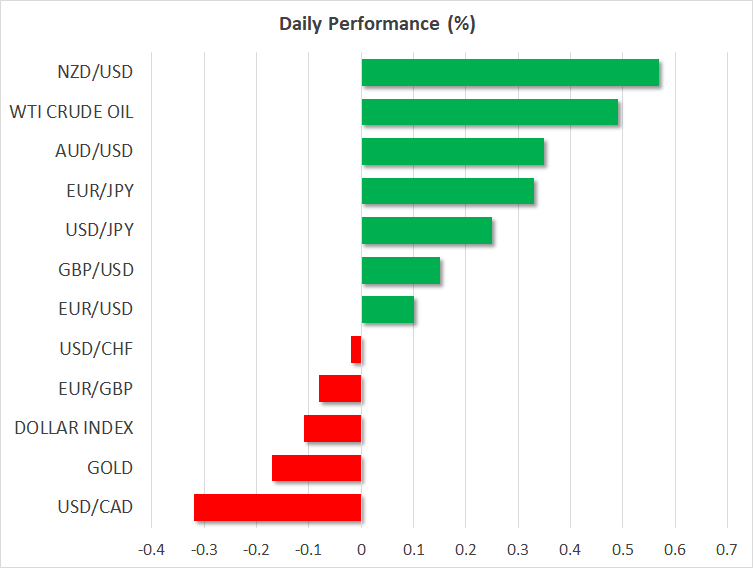
FOREX: The US dollar traded higher against the Japanese yen by 0.24% after three days of declines. However, the dollar index – which measures the greenback’s performance against six major currencies – fell by 0.10% on Tuesday, and is currently hovering just below the 90.00 handle. Euro/dollar was trading higher by 0.11% during today’s European session, standing marginally above the 1.2300 psychological level. Sterling advanced by 0.17% versus the greenback, hovering around its intraday high of 1.4068. The Australian and New Zealand dollars posted gains against the greenback today. Aussie/dollar rose by 0.37%, after the Reserve Bank of Australia (RBA) earlier kept interest rates unchanged at its monthly meeting. Kiwi/dollar moved higher by 0.58% at 0.7253, while dollar/loonie was down by 0.33% at 1.2871.
STOCKS: European stocks tumbled as markets reopened after the long weekend. The benchmark European STOXX 600 tumbled by 0.88% for the first day after four green sessions. The blue-chip Euro STOXX 50 was down by 0.90%, while the German DAX 30 dipped by 1.22%, the largest fall in more than a week. The French CAC 40 dived by 0.7%, the Spanish IBEX 35 slipped by 0.87% and the British FTSE 100 declined by 0.51%. In Asia, Japan’s Nikkei 225 and Topix edged lower by 0.45% and 0.29% respectively. In the US, even though the S&P, Dow Jones and the Nasdaq all plummeted yesterday, futures tracking these indices are currently in the green, pointing to a higher open today. Note that yesterday, the S&P 500 closed below its 200-day simple moving average for the first time since the Brexit vote in June 2016.
COMMODITIES: Oil prices fell sharply on Monday after news of rising Russian output and the escalating US – China trade dispute weighed on sentiment. Prices recovered a little today though, with Brent crude oil edging back up by 0.49% towards $68 a barrel, while WTI crude gained 0.52% to $63.34 a barrel. In precious metals, gold prices rose sharply yesterday, but today, they fell by 0.17% at $1,338.6.
Day ahead: All eyes remain on the trade dispute
In terms of economic data, the only noteworthy releases left on the agenda are New Zealand’s biweekly milk auction, which does not have a precise release time, as well as US total vehicle sales for March, due at 1930 GMT.
In equity markets, attention will remain on the recent plunge caused by trade concerns and uncertainties about US tech companies. The next chapter in the trade saga will probably come this week, when the US formally unveils the technology tariffs it announced last week against China. While there is no specific day for the announcement, Commerce Secretary Wilbur Ross said on Thursday that the official declaration will come “very, very shortly”.
After that, China is likely to strike back again, following comments from the Chinese Ambassador to the US suggesting as much yesterday. Media reports indicate the Chinese retaliation is likely to be aimed at US soybean and aircraft exports, bringing into focus companies such as plane-maker Boeing. If this scenario is accurate, then risk sentiment will probably deteriorate further before it recovers, implying more troubles may be in store for major equity indices in the near-term. In the bigger picture though, the overall direction in stock markets could depend on what comes after China retaliates again. Will the US announce its own countermeasures and continue playing the tit-for-tat game, or will the two sides sit down at the negotiating table and reach common ground?
In energy markets, the American Petroleum Institute (API) will release its weekly crude inventory data at 2030 GMT. Investors will be looking for signs as to whether US production has leveled off for now, following the recent decline in the number of active US rigs.
As for the speakers, we have three on the schedule. In the US, Minneapolis Fed President Neel Kashkari (non-voter) will deliver remarks at 1330 GMT, while Fed Board Governor Lael Brainard (voter) will step up to the rostrum at 2030 GMT. In Europe, comments by ECB Executive Board member Yves Mersch will attract attention at 1430 GMT.
Will EURUSD break 1.2285, or will it not? That’s the question
Entering into US session, USD jumps broadly in the current 4H bar as seen in 4H heatmap. It's followed by NZD and then AUD. On the other hand, despite better than expected PMI manufacturing, GBP is suffering some broad based pressure, followed by CHF and then EUR.
 Price actions in the hourly chart support more near term upside in USD. EUR/USD's price actions from 1.2283 are clearly corrective looking, which indicates fall from 1.2475 is not completed. The pair is now testing 1.2285 support for the third time in four trading days. Firm break there will indicate that rebound from 1.2154 has completed with three waves up to 1.2475. And decline from 1.2555 is resuming.
Will it break 1.2285, or will it not? That's the question in many traders' minds.
 Similarly, GBP/USD's price actions from 1.4008 are also corrective looking, which suggests that fall from 1.4234 is not completed. The failure to sustain above 4 hour 55 EMA also carries some bearish implication. But still, we need to see break of 1.3982 to indicate that completion of the rally from 1.3711. Hence, 1.4008 is the first support to test for GBP/USD, and then 1.3982.