
Sample Category Title
AUD/USD Daily Outlook
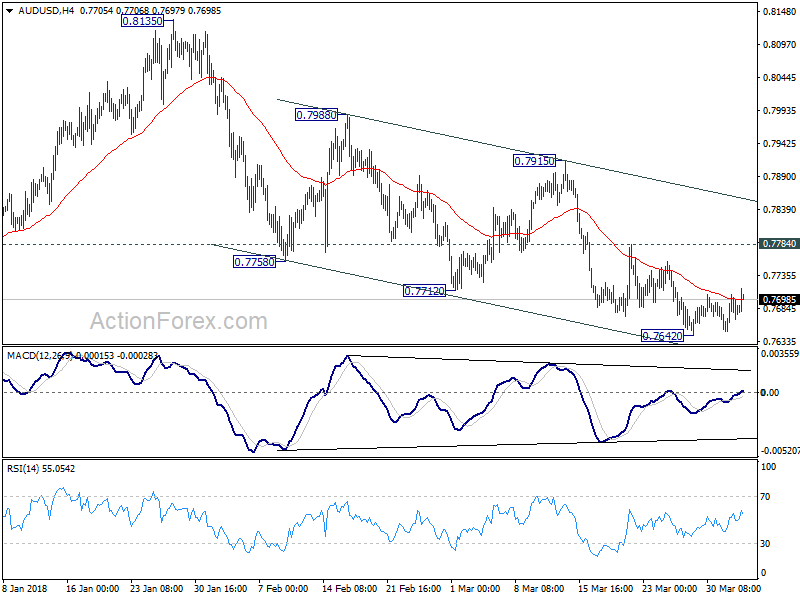
Daily Pivots: (S1) 0.7654; (P) 0.7680; (R1) 0.7709; More...
AUD/USD's consolidation from 0.7642 temporary low is still in progress and intraday bias stays neutral. Stronger recovery might be seen. But after all, near term outlook remains bearish as long as 0.7784 resistance holds. On the downside, break of 0.7642 to will bias to the downside to extend recent fall from 0.8135 to retest 0.7500 key support level. On the upside, however, break of 0.7784 will suggest near term reversal and turn bias to the upside for 0.7915 resistance first.
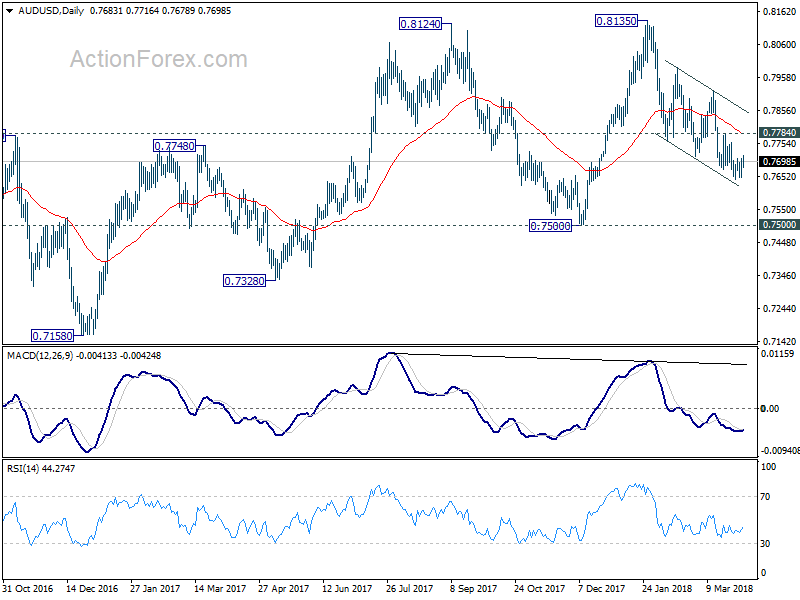
In the bigger picture, medium term rebound from 0.6826 is seen as a corrective move. It might still extend higher but we'd expect strong resistance from 38.2% retracement of 1.1079 to 0.6826 at 0.8451 to limit upside to bring long term down trend resumption. On the downside, break of 0.7500 support will now be an important signal that such corrective rebound is completed. In that case, AUD/USD would be heading back to 0.6826 low in medium term.
USD/CAD Daily Outlook
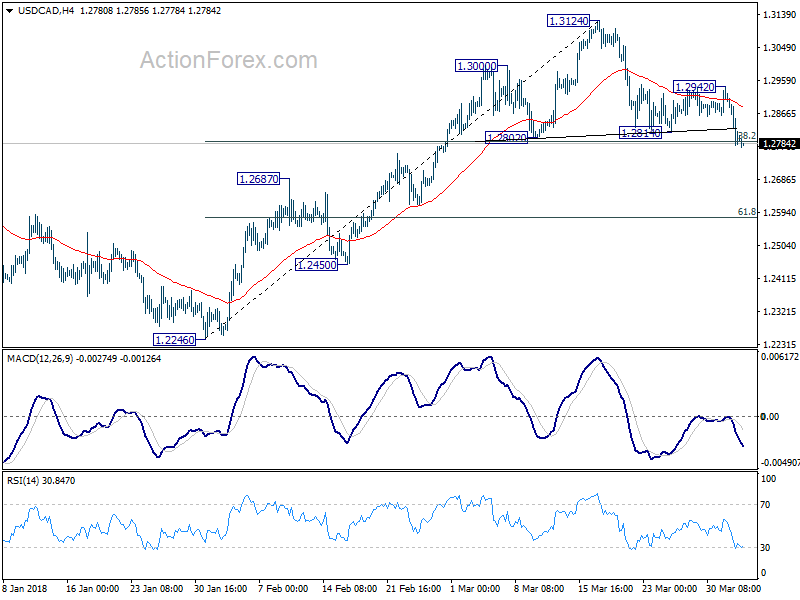
Daily Pivots: (S1) 1.2750; (P) 1.2837; (R1) 1.2892; More....
Intraday bias in USD/CAD remains on the downside with focus on 38.2% retracement of 1.2246 to 1.3124 at 1.2789. Near term trend could have reversed with head and shoulder top pattern (ls: 1.3000; h: 1.3124; rs: 1.2942). Sustained trading below 1.2789 will confirm this case. It will also indicate rejection by 1.3065 fibonacci level. Deeper fall would than be seen back to 1.2246 support next. On the upside, though, break of 1.2942 will indicate support from 1.2789 and turn bias back to the upside for 1.3124.
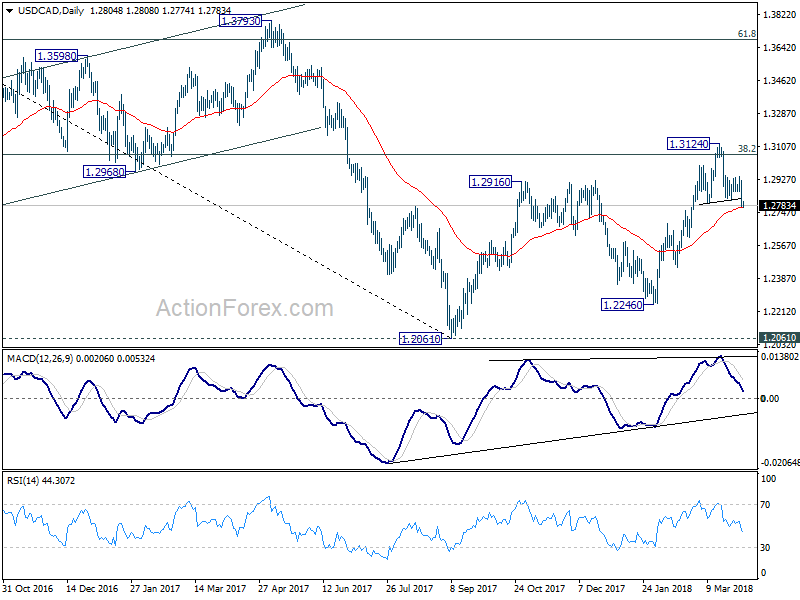
In the bigger picture, outlooks is turned a bit mixed again. Strong support was seen from 50% retracement of 0.9406 (2011 low) to 1.4689 (2015 high) at 1.2048. But there was no follow through buying above 38.2% retracement of 1.4689 to 1.2061 at 1.3065. Rejection by 1.3065 will argue that price action from 1.2061 is merely a three wave corrective pattern. And 1.2061 will be put back into focus with medium term bearishness revived.
Dollar Lower as Battle 1, US-China Trade War Starts, But Other Markets Shrug Off
The US finally announced the list Chinese products to be tariffed in its Section 301 actions. China responded with strongly worded statement. But so far, market reactions are muted. After limited volatility, both Japan Nikkei and Hong Kong HSI are trading nearly flat at the time of writing. The China SSE Composite index is actually up 0.8%. Gold is trading inside recently established range, gyrating around 1335. While the 301 tariffs are seen as some as the cannons of the first battle of the US-China trade war, it seems that the markets are not expecting a escalation. Instead, the US and China would bring things back to the table for negotiation. But we'd like to emphasize that the situation will totally change depending on the response from China.
In the currency market, Dollar is trading broadly lower in Asian session, followed by Yen. The greenback tried to rally against Euro and Swiss Franc overnight. EUR/USD has indeed taken our 1.2285 support but it recovers ahead of 1.2238. On the other hand, Canadian Dollar is the strongest one for the week now. It's boosted by news that US President Donald Trump is rushing to complete a draft of NAFTA for release next week. Technically, USD/CAD formed a head and shoulder top reversal pattern. And it's trying to extend decline to sustain below a key near term fibonacci support level at 1.2789.
US announced tariffs on 1300 products, targeting "Made in China 2025" plan
The Office of the United States Trade Representative finally released the list of products regarding the Section 301 tariffs against China. The action will impose 25% tariffs on approximately USD 50b of Chinese imports to the US "in response to China's policies that coerce American companies into transferring their technology and intellectual property to domestic Chinese enterprises." And the Trade Res presentative claimed in the statement that these policies "bolster China's stated intention of seizing economic leadership in advanced technology", like in its "Made in China 2025" plan.
The proposed list of products covers around 1300 tariff lines, focusing on technological and industrial products, like televisions, medical devices, batters, aircraft parts etc. The list will be finalized after public comment, including a hearing on May 15 in Washington. And companies will have until May 22 to file final objections.
China: It's only polite to reciprocate to US unilateralistic and protectionist action
In response to the 301 tariffs announce, the Chinese Embassy in the US issued a strongly worded statement. China said it "strongly condemns and firmly opposes the unfounded Section 301 investigation and the proposed list of products and tariff increases based on the investigation." It condemned that "unilateralistic and protectionist action has gravely violated fundamental principles and values of the WTO". And such action serves nobody's interest. China said it's "only polite to reciprocate" and said it will resort to the WTO. In addition, China pledged to take "corresponding measures of equal scale and strength against U.S. products in accordance with Chinese law".
Separately, China's Ministry of Commerce also said in a statement that it will " immediately bring relevant U.S. practice to the dispute settlement body of the WTO, and is ready to take counter measures on U.S. products with the same intensity and scale that will be published in the coming days."
On the data front
Australia retail sales 0.6% mom in February, above expectation of 0.3% mom. Australia building approvals dropped -6.2% mom in February, below expectation of -5.0% om. UK BRC shop price index dropped -1.0% yoy in March. China Caixin PMI services dropped to 52.3 in March, below expectation of 54.5.
Looking ahead, UK will release construction PMI in European session. But main focus will be on Eurozone CPI flash for March. Eurozone will also release unemployment rate. Later in the day, US will release ADP private employment, ISM services and factory orders.
USD/CAD Daily Outlook
Daily Pivots: (S1) 1.2750; (P) 1.2837; (R1) 1.2892; More....
Intraday bias in USD/CAD remains on the downside with focus on 38.2% retracement of 1.2246 to 1.3124 at 1.2789. Near term trend could have reversed with head and shoulder top pattern (ls: 1.3000; h: 1.3124; rs: 1.2942). Sustained trading below 1.2789 will confirm this case. It will also indicate rejection by 1.3065 fibonacci level. Deeper fall would than be seen back to 1.2246 support next. On the upside, though, break of 1.2942 will indicate support from 1.2789 and turn bias back to the upside for 1.3124.
In the bigger picture, outlooks is turned a bit mixed again. Strong support was seen from 50% retracement of 0.9406 (2011 low) to 1.4689 (2015 high) at 1.2048. But there was no follow through buying above 38.2% retracement of 1.4689 to 1.2061 at 1.3065. Rejection by 1.3065 will argue that price action from 1.2061 is merely a three wave corrective pattern. And 1.2061 will be put back into focus with medium term bearishness revived.
Economic Indicators Update
| GMT | Ccy | Events | Actual | Forecast | Previous | Revised |
|---|---|---|---|---|---|---|
| 23:01 | GBP | BRC Shop Price Index Y/Y Mar | -1.00% | -0.80% | ||
| 1:30 | AUD | Retail Sales M/M Feb | 0.60% | 0.30% | 0.10% | |
| 1:30 | AUD | Building Approvals M/M Feb | -6.20% | -5.00% | 17.10% | |
| 1:45 | CNY | Caixin PMI Services Mar | 52.3 | 54.5 | 54.2 | |
| 8:30 | GBP | Construction PMI Mar | 51 | 51.4 | ||
| 9:00 | EUR | Eurozone Unemployment Rate Feb | 8.50% | 8.60% | ||
| 9:00 | EUR | Eurozone CPI Estimate Y/Y Mar | 1.40% | 1.20% | ||
| 9:00 | EUR | Eurozone CPI Core Y/Y Mar A | 1.10% | 1.00% | ||
| 12:15 | USD | ADP Employment Change Mar | 205k | 235k | ||
| 13:45 | USD | US Services PMI Mar F | 54.3 | 54.1 | ||
| 14:00 | USD | ISM Non-Manufacturing/Services Composite Mar | 59 | 59.5 | ||
| 14:00 | USD | Factory Orders Feb | 1.70% | -1.40% | ||
| 14:30 | USD | Crude Oil Inventories | 1.4M | 1.6M |
Market Morning Briefing: Pound Seems To Have Found Some Temporary Suppor
STOCKS
Globally, the Bulls are putting up a bit of a fight and could move up a little more in the next week or two. Unsure of movement after that. Movement is choppy in most markets.
Good bounce back in the Dow (24022.36, +389.17, +1.65%) yesterday, recouping the losses seen on Monday. This is in line with our view of near-term range trade between 23500-24500.
The DAX (12002.45) is trading in a narrow range of 11900-12200 within a broader downward channel of 11700-12300. A rise towards 12300 is a possibility we are looking at.
Contrary to expectation of a fall to 21000-20800, the Nikkei (21273) closed at 21292.29 yesterday and has seen a high near 21415 today. This could be due to a relatively higher Dollar-Yen (106.50). A further rise to 107 (if seen) on Dollar-Yen could take Nikkei up to 21900.
As mentioned yesterday, the Shanghai (3157.98) is ranged between 3100-3200 in the near term. Medium term Support seen at 3100, near-term Resistance seen at 3200. A break of either of these is needed to set the trend for the coming weeks.
The Nifty (10245) has tested the 10260 Resistance mentioned yesterday. We need to see if it falls back today, as expected yesterday, or rises to break above 10260.
COMMODITIES
Brent (67.91) as mentioned yesterday, is looking bearish in the near term and could come down towards 66 in the next 1-2 weeks (seen as support on weekly and 3 day candles).
FOREX
The Dollar index (90.077) saw a high of 90.28 yesterday thereby breaching resistance near 90.10 in the downward channel on daily candles. It is currently trading slightly lower near 90.10 (near the resistance level). It might now move towards higher resistance (seen on weekly line chart and 3 day candles) near 91.
Euro (1.2281) saw a low of 1.2254 yesterday, thereby testing support on 3 day candles. On the daily candles, there is still some scope for a downmove towards lower support near 1.2225. A break of the same would imply medium term bearishness.
We had predicted yesterday that Dollar Yen (106.47) might be paused in its downmove by the 13 days moving average line on the daily line chart ; however, the Dollar Yen hasn’t only paused, but has bounced from there back towards resistance on daily candles. It could again test this resistance near 106.9 in the next 1-2 sessions, after which a dip could be expected.
Euro Yen (130.76) contrary to expectation hasn’t continued its dip towards support near 129.5-129.0 on daily candles due to the Yen’s sudden strength yesterday. However, there is immediate resistance on daily candles now at 131 which should lead to a dip. There is resistance on Dollar Yen near 106.9 too (as mentioned above) and scope for Euro to move lower to 1.2225, which should both combine to make Euro Yen possibly stay below 131.
Pound (1.4088) seems to have found some temporary support (provided by the 21 days moving average on the daily line chart) but is still likely to move down in the short term towards support near 1.395-1.390 (seen on daily candles, 3 day candles, 3 day line chart).
Dollar Rupee (65.015) – Can dip to 64.90-85.
INTEREST RATES
US long term yields as per our expectation yesterday have found some support after the continuous dip for the last few days. However, we might still see a slow and gradual decline in yields through Apr-May.
US 10 Yr Yield (2.7771%), 30 Yr (3.0142%), 5 Yr (2.5974%), 2 Yr (2.274%) :
The 10 Year yield seems to have indeed found support near 2.75% on the medium term chart (we had predicted yesterday that the support might be lower near 2.7%). It might now rise back towards 2.8% over the next 2-3 sessions.
The 30 yr yield as per expectation has seen a bounce from levels near 2.97% (seen as support in the downward channel on short term chart). It might now rise towards resistance near 3.05% in the channel and dip from there.
China: It’s only polite to reciprocate to US unilateralistic and protectionist action
China responded to the Section 301 tariff list quickly with a strongly worded statement through the Embassy in the US.
China said it "strongly condemns and firmly opposes the unfounded Section 301 investigation and the proposed list of products and tariff increases based on the investigation."
It condemned that "unilateralistic and protectionist action has gravely violated fundamental principles and values of the WTO". And such action serves nobody's interest.
China said it's "only polite to reciprocate" and said it will resort to the WTO.
In addition, China pledged to take "corresponding measures of equal scale and strength against U.S. products in accordance with Chinese law".
Full statement in English and Simplified Chinese.
China's Ministry of Commerce also said in a statement that it will " immediately bring relevant U.S. practice to the dispute settlement body of the WTO, and is ready to take counter measures on U.S. products with the same intensity and scale that will be published in the coming days."
Statement in Simplified Chinese.
Market reactions muted as US unveiled 301 tariffs list of products, targeting “Made in China 2025”
The Office of the United States Trade Representative finally released the list of products regarding the Section 301 tariffs against China. Market reactions are so far very muted. Nikkei opened with slight gain following 1.65% rebound in DOW overnight but gyrated lower. It's currently down around -0.1%. Hong Kong HSI is trading flat. China SSE is trading up 0.6%.
In the currency markets, NZDUSD is trading as the biggest mover for the day so far an is up 32 pips, NZDH CHF follows and is up 26 pips. EURNZD is down -58 pts at the time of writing.
 The Section 301 action will impose 25% tariffs on approximately USD 50b of Chinese imports to the US "in response to China's policies that coerce American companies into transferring their technology and intellectual property to domestic Chinese enterprises." And the Trade Res presentative claimed in the statement that these policies "bolster China's stated intention of seizing economic leadership in advanced technology" in its "Made in China 2025" plan.
The proposed list of products covers around 1300 tariff lines, focusing on technological and industrial products, like televisions, medical devices, batteries, aircraft parts etc. The list will be finalized after public comment, including a hearing on May 15 in Washington. And companies will have until May 22 to file final objections.
Full release from US Trade Representative
And the list of products could be find here on page 14.
EUR/GBP Could Resume Its Downtrend?
Key Highlights
- The Euro faced a lot of selling interest near 0.8780-90 against the British Pound and declined.
- There are two crucial bearish trend lines forming with resistance near 0.8770 on the 4-hours chart of EUR/GBP.
- The UK Manufacturing PMI in March 2018 increased from the last revised reading of 55.0 to 55.1.
- Today, the Euro Zone CPI report for March 2018 (Prelim) will be released, which is forecasted to increase by 1.4% (YoY).
EURGBP Technical Analysis
The Euro corrected higher from the 0.8667 low against the British Pound towards 0.8780. The EUR/GBP pair faced a major resistance near the 0.8780-90 zone and failed to move further higher.
Looking at the 4-hours chart, there are two crucial bearish trend lines forming with resistance near 0.8770. These trend line prevented gains on many occasions and they recently stopped the upside move above 0.8785.
The pair is currently moving lower and is trading below the 50% Fib retracement level of the last wave from the 0.8667 low to 0.8797 high. It is placed well below the 100 (red) and 200 (green) simple moving averages (4-hours), which is a negative sign.
If the pair fails to move above the trend lines and resistance at 0.8780, there could be more declines. It could even break the 61.8% Fib retracement level of the last wave from the 0.8667 low to 0.8797 high at 0.8716.
Below 0.8716, the pair may perhaps break 0.8700 for further losses. On the upside, a break above the trend lines, 0.8780, and the 100 SMA could open the doors more gains above 0.8800.
Recently, the UK’s Manufacturing PMI for March 2018 was released by Markit/CIPS. The market was positioned for a decline from the last reading of 55.2 to 54.8.
However, the result was slightly positive as the PMI increased from the last revised reading of 55.0 to 55.1. Commenting on the same, the Director at IHS Markit, Rob Dobson, stated:
The latest PMI survey provided further evidence that UK manufacturing has entered a softer growth phase so far this year. Although the pace of output expansion ticked higher in March, which is especially encouraging given the heavy snowfall during the month, this was offset by slower increases in new orders and employment.
Overall, the result was positive and helped the British Pound. Thus, if the EUR/GBP pair fails to move higher, there could be more downsides in the near term.
Economic Releases to Watch Today
- Euro Zone CPI for March 2018 (YoY) (Prelim) – Forecast +1.4%, versus +1.1% previous.
- Euro Zone Core CPI for March 2018 (YoY) (Prelim) – Forecast +1.1%, versus +1.0% previous.
- UK Construction PMI for March 2018 – Forecast 50.8, versus 51.4 previous.
- US ADP Employment Change March 2018 – Forecast 208K, versus 235K previous.
- US Services PMI for March 2018 – Forecast 54.3, versus 54.1 previous.
Australia retail sales rose 0.6%, AUD extending near term recovery
Australia retail sales rose 0.6% mom in February, beating expectation of 0.3%. But building approvals dropped -6.2% mom, worse than expectation of 54.5.
 AUD is responding well to easing of risk aversion. But it's not totally out of the dark yet.
 For example, AUD/JPY 6H action bias just turned positive, indicating the the recovery is gaining momentum.
 However, D action bias is just neutral.
 W action bias is negative through and through.
 Hence, for the near term, there could be more upside in the cross as recovery extends. But upside potential would be limited as it's a corrective move. Or, until there is firm signal of trend reversal.
Crude Oil Prices Supported by Inventory Draw and Russia’s Pledge to Fully Comply with Output Cut
Crude oil prices climbed higher for the second consecutive day as a report showing unexpected expected decline in US inventory. Meanwhile, Russia pledged that it would fully comply with the output cut deal this month. However, caution is advised over the promise as Russian oil output has reached the highest level in 11 months in March. Currently trading at US$62.29/bbl, the front-month WTI contract ended that at US$63.51/bbl, up +0.79% on Tuesday. Meanwhile, the Brent contract gained +0.71% and settled at US$62.12/bbl for the day.
The industry-sponsored API estimated that crude oil inventory fell -3.28 mmb in the week ended March 30. For refined oil products, gasoline and distillate stockpile rose +1.12 and +2.2 mmb respectively. the official report from the US Energy Department (EIA) might report a +0.25 mmb increase in crude oil inventory. However, gasoline and distillate stockpiles probably dropped -1.26 mmb and -1.13 mmb last week.
Russian energy minister Alexander Novak told Prime news agency that the country would fully comply with its commitment to cut oil output under the OPEC/non-OPEC deal this month. He added that the country is meeting the agreement “in full” in “the first days of April”, signaling the commitment to “implement our agreements until our goals are reached".
Under the agreement, Russia should lower its production, by -0.3M bpd, from October 2016’s 11.247M bpd, to about 10.947M bpd. However, the oil giant’s output reached 10.969M bpd in March, the highest in 11 months and up from February’s 10.95M bpd.
What A Difference A Day Makes, 24 Little Hours
What a difference a day makes, 24 little hours
US equity markets, at least for today, put tech sector regulation and the fear of an escalating trade war behind them. Investors were in buy the dip mode but unwound Monday’s meltdown when reports suggested President Trump is not formally looking at options to address his concerns with the US’s major e-retailer. While trade wars concerns have not improved by any stretch of the imagination, but fumes of fancy have reversed some of yesterday’s carnage.
Indeed Equity markets are providing the broader sentiment gauge as USDJPY topped the charts at 106.65, ten-year yields rose to 2.79 %, and gold briefly slipped below 1330.00 as risk-off hedges unwound. But trading should remain quite volatile as the prospect of a trade war between the U.S. and China continues to cast a dark shadow over global capital markets.
When it comes to trading these days, it feels like I’m playing a never-ending game ring- a – bottle, putting way to much cash at work to win a big fluffy stuffed animal of equal or less value. There is no escaping the hamster wheel syndrome in a market dictated by headline risk.
Oil Markets
Oil prices have recovered as equity markets veered higher as focus shifted back to inventory concerns after the American Petroleum Institute (API) reported a surprise draw of 3.28 million barrels of US crude. While a highly unpredictable and volatile reading it continues to provide a go-to litmus test for market sentiment.
But oil markets remain in a tangled web of headline risk while enormous speculative positioning and the fear of a crowded trade is keeping top side moves in check.
Gold Markets
Gold prices fell overnight as US stock markets rebounded after fears of a global equity rout eased as concerns of a more profound global equity sell-off decreased, and the US dollar strengthened. But with volatility and trade tension simmering, gold will remain supported on dips. Until a definitive headline materialises that their’s positive progress on the trade front, the enormous tail risk from the US Administration Section 301 investigations has the potential to send the market into an irreversible tailspin and will keep haven trades in play.
Currency Markets
The Japanese Yen
Keep calm and don’t lose the plot. JPY was trading less sensitive to the SPX given that de-FAANG’ing drove much of the move, so traders are viewing the overnight reversal as an opportunity to increase JPY longs.Trade war is still in play and the potential for a more rukus US-China affair remain, especially on the escalation around section 301, suggests traders are not going to give up short USDJPY position easily. A case of “buy on cannons sell on trumpets. ” Short dollar-yen trade has been stirred but remains unshaken
The Euro
The Euro was weighted down by the crosses. Unfortunately, the EURUSD, for the time being, remains an incredibly dull trade.
The Malaysian Ringgit
Risk sentiment is improving, and the Ringgit will benefit this morning as the local unit is trading with a robust correlation to risk which if for the most part being framed by escalating trade rhetoric. While I expect US-China trade tensions weigh on regional bourses and looming election to dampen inflows, the MYR remains very isolated and will continue to trade range bound ahead of this week’s key US NFP