Sample Category Title
EUR/GBP Slight Decline
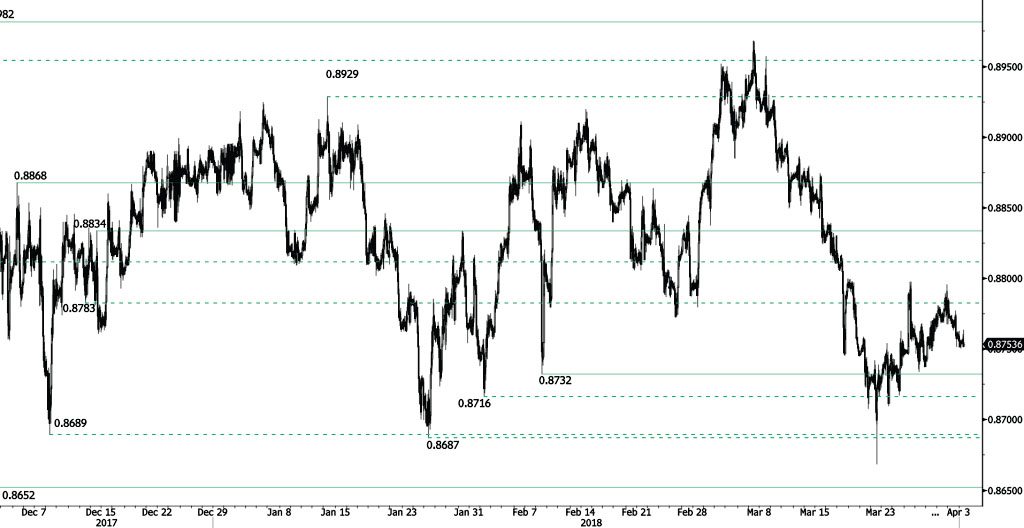
EUR/GBP continues decreasing from 0.8796 high, approaching the 0.8750 range. Bearish pattern started in March is maintained. Hourly support and resistance are maintained at 0.8732 (08/02/2018 low) and 0.8834 (14/12/2017 high). The technical structure suggests short-term decline.
In the long-term, the pair has largely recovered from 2015 lows. The technical structure suggests further upside pressure. Strong resistance can be found at 0.9500 (psychological level) while support remains at 0.8304 (05/12/2016 low). The pair is trading below its 200 DMA.
AUD/USD Failing To Break Support At 0.7638
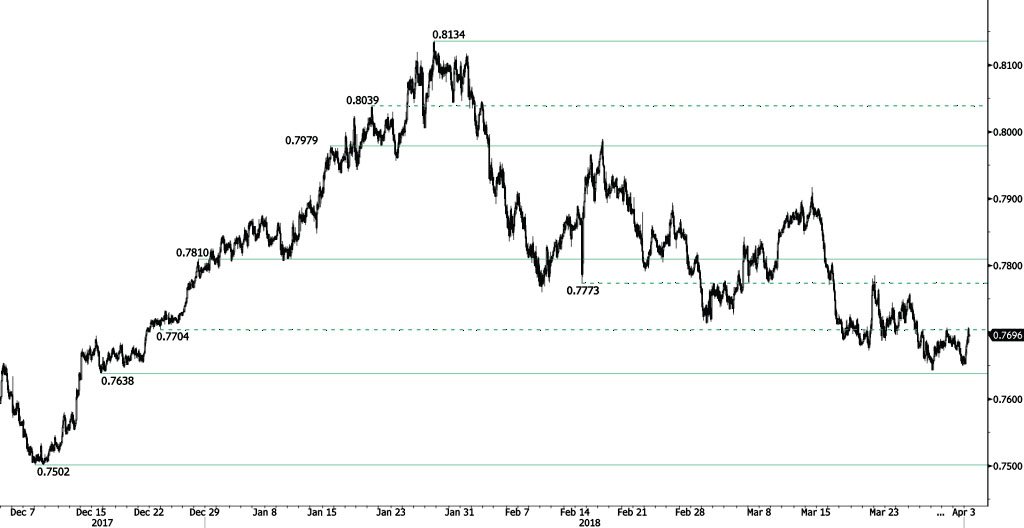
AUD/USD bounce continues, heading along the 0.7707 range. Hourly support and resistance are given at 0.7638 (15/12/2017 low) and 0.7810 (28/12/2017 high). The technical structure suggests short-term increase.
In the long-term, the upward trend slows down after failing to reach key resistance at 0.8164 (14/05/2015 low). Key support stands at 0.6009 (31/10/2008 low). A break of the key resistance at 0.8164 (14/05/2015 high) is needed to invalidate our long-term bearish view.
USD/CAD Declining
USD/CAD is declining from 1.2890 high, approaching the 1.2865 range. USD/CAD sideways trading price action between 1.2815 and 1.2944 started in March is currently maintained. Hourly support and resistance remain at 1.2805 (12/03/2018 low) and 1.3308 (23/06/2017 high). The short-term technical structure suggests short-term decline.
In the longer term, the pair is trading between resistance point at 1.3805 (05/05/2017 high) and support at 1.2128 (18/06/2015 low). Strong resistance is given at 1.4690 (22/01/2016 high). The pair is likely to head lower. The pairs is trading above its 200 DM
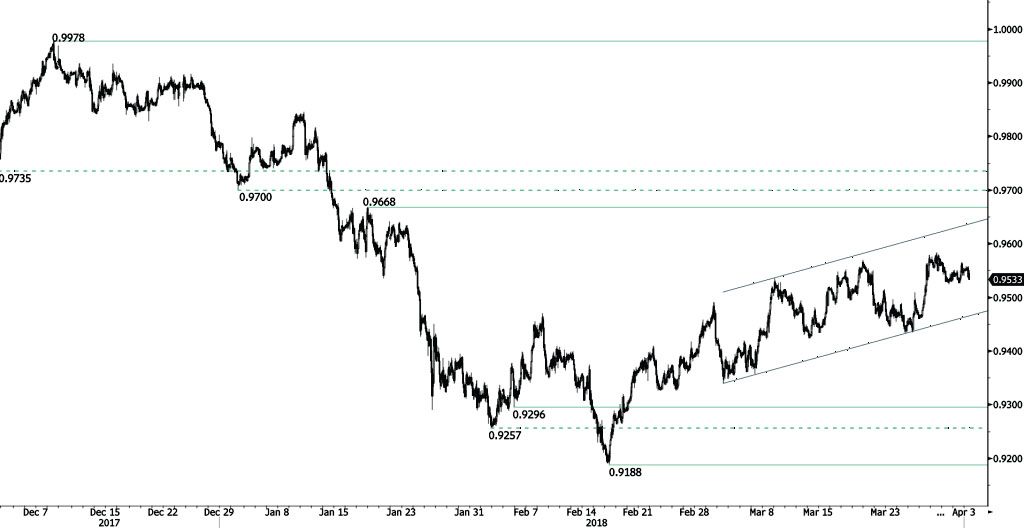
USD/CHF Trading Within Upward Trend Channel
USD/CHF is trading within upward trend channel, recovering from 0.9524 low and approaching the 0.9560 range. Bullish pattern started from 0.9188 (16/02/2018 low) continues. The pair is contained between hourly support and resistance given at 0.9296 (05/02/2018 low) and 0.9668 (17/01/2018 high). The technical structure suggests short-term upward moves.
In the long-term, the pair is still trading in range since 2011 despite some turmoil when the SNB unpegged the CHF. Key support lies at 0.9072 (07/05/2015 low) while resistance at 1.0344 (15/12/2016 high) is distanced. The technical structure favours a long term bullish bias since the unpeg in January 2015.
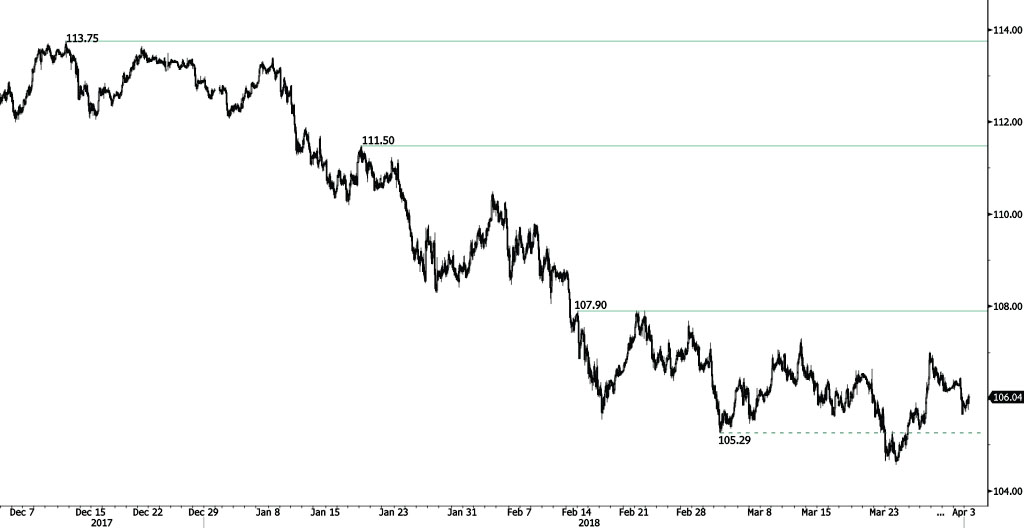
USD/JPY Slight Increase
USD/JPY is slightly increasing following recent decline at 105.66, approaching the 106.20 range. The bearish pattern started in January 2018 is maintained. The short-term technical structure suggests short-term increase.
We favor a long-term bearish bias. Support remains at 101.20 (09/11/2016 low). A gradual rise toward the major resistance at 125.86 (05/06/2015 high) seems unlikely. Expected to decline further support at 101.20 (09/11/2016 low). The pair trades largely below its 200 DMA. USD / CHF Trading within upward trend channel.
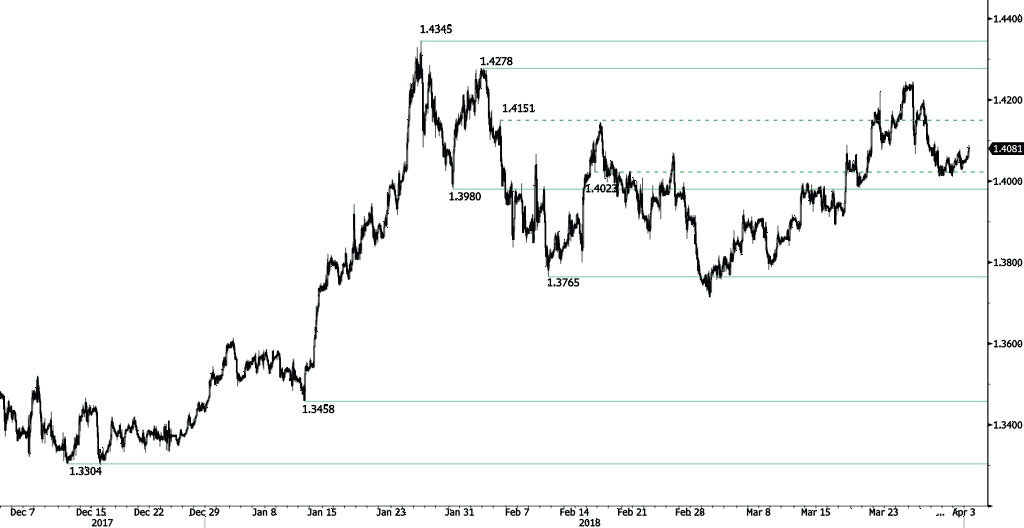
GBP/USD Bouncing Off
GBP/USD short-term bearish pattern stops after breaking hourly support at 1.4023 (15/02/2018 low), starting a recovery phase from 1.40 low and approaching the 1.4090 range. Hourly support and resistance are now given at 1.3980 (30/01/2018 low) and 1.4278 (02/02/2018 high). The technical structure suggests shortterm increase.
The long-term technical pattern is reversing. The Brexit vote had paved the way for further decline but the pair is moving to 2016 highs. Long-term support and resistance are given at 1.1841 (07/10/2017 low) and 1.5018 (24/06/2016 high).
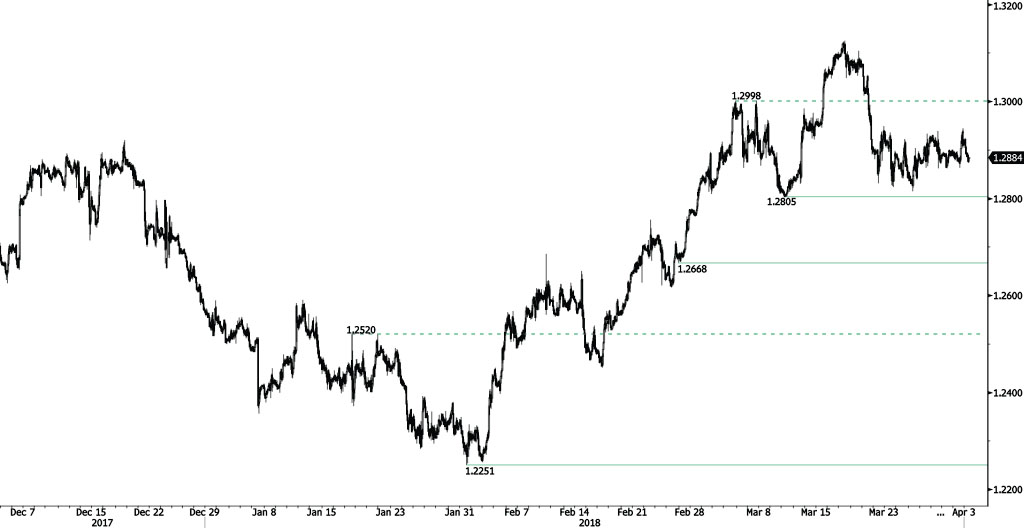
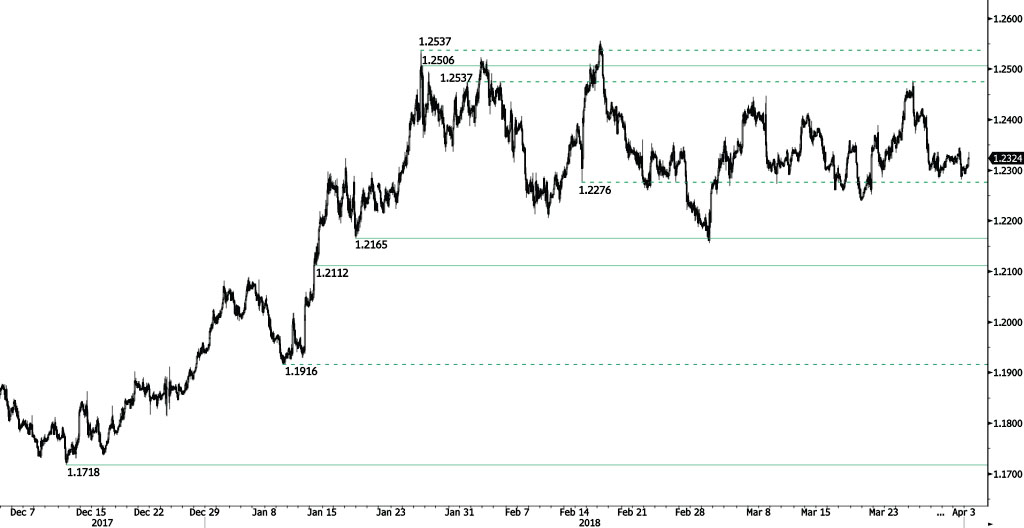
EUR/USD Trying To Bounce
EUR/USD is bouncing off from 1.2282 low, trading above 1.23 and heading along the 1.2335 range. The pair is currently maintained between hourly support and resistance given at 1.2165 (17/01/2018 low) and 1.2506 (25/01/2018 high). The technical structure suggests shortterm upward moves.
In the longer term, the momentum is turning largely positive. We favor a continued bullish bias. Key resistance is holding at 1.2886 (15/10/2014 high) while strong support lies at 1.1554 (08/11/2017 low).
Tech Slump Weigh, Markets Are Set To Bleed More
The S&P500 closed below its 200- day moving average
FANG stocks are leading the losse
Current environment could easily dampen the demand for oil
The beginning of a new quarter for the global equity market is on the back foot, especially for the S&P500 index as the US stock market suffers from more pain yesterday. The selloff momentum activated by the US stocks yesterday is weighing on the European markets today.
It is mainly the tech sector which triggered the selloff and we are expecting this rout to continue as a major correction seems like on its way. The NASDAQ index was the strongest among its peer and the S&P500 index without any doubt is the weakest index. The S&P500 closed below its 200- day moving average yesterday and the index has six down sessions in the past eight sessions. Closing below the 200-day moving average gives us the signal that the broader equity market in the US has changed its trend.
Tech giants, FANG stocks are leading the losses and the E-commerce giants like Amazon, one of the best-performing stocks of 2017, is battered due to the Trump's tweets influence. President Trump made clear in his tweet on Saturday that Amazon is scamming the US Postal Service. Although, there is a clear evidence that the US postal service has benefited from Amazon's business. In summary, Trump wants to change the Tax structure for Amazon. Trump believes that Amazon is killing the brick and mortar retailer business and hence change in the tax treatment in his eye could bring the traffic flow back to the traditional businesses.
Oil prices have been holding its ground to some extent and this has saved the day for the energy stocks from a brutal sell-off. However, the current environment could easily dampen the demand for oil which would remove the support for the energy stocks. The risk-off sentiment hasn't started to bleed fully yet, but if that occurs, the current sell-off would shake many smaller investors out of the market.
Trump's trade tariff on China has created its first causality over in the US. Prices for the raw material paid have soared already, thanks to clever businesses which are taking advantage of the levies. Companies have started to quote a higher price while some are providing quotes which are valid for only 24 hours.
Sell Sterling!
Sell sterling!
Brexit pain and a cyclical downturn are weighing on the British pound. Markets will react to the latest proposals for a border between the Republic and Northern Ireland. Watch for sterling to lurch negatively, with the GBP/USD failing to break its 50-day moving average and falling to a 0.7000 level.
A one-year clock is on the field for Brexit, highlighting the UK’s weakness. Europe has a massive internal market that companies can depend on for growth. The UK by contrast is fragmenting within itself, specifically in Northern Ireland and Scotland, and needs exports to grow. If a EU-UK trade war breaks, the UK is in much less desirable spot then Europe. More broadly, worries of a trade war will put defensive stocks in demand. Cyclical and tech driven stocks will be exposed. Fair commodity prices depend on free trade: endangering this artificially tightens supply and drives up prices.
Japan slows
Manufacturing in Japan is starting to slow down. The Bank of Japan’s Tankan indicator slipped to 24 from 25, its first decline since Q1 2016. The decline is felt in all major sectors, from textile, paper, chemicals, food and metals. Tankan’s Q1 non-manufacturing indicator remains stable at 23, weakened by construction, rental, wholesale trade, transport and information services.
Against an appreciating yen (year-to-date: EUR/JPY: -3.42%, USD/JPY -5.87%, GBP/JPY: -2.16%) and trade war tensions, business confidence is slightly shaken. Still, Japan’s trade position is favourable. The February trade balance remains at JPY 2.55 billion, with exports up 1.80%, and February’s retail sales expanded 0.40% (previous: -1.80%). We expect China-US trade sanctions to ease in coming weeks, which would trigger recovery for Japanese exporters. Yesterday’s US equities 2% drop knocked down the USD/JPY by 0.37%, confirming JPY’s safe haven status. We expect USD/JPY at 106.06 to recover slightly toward the 106.12 range.
GBP/JPY Daily Outlook
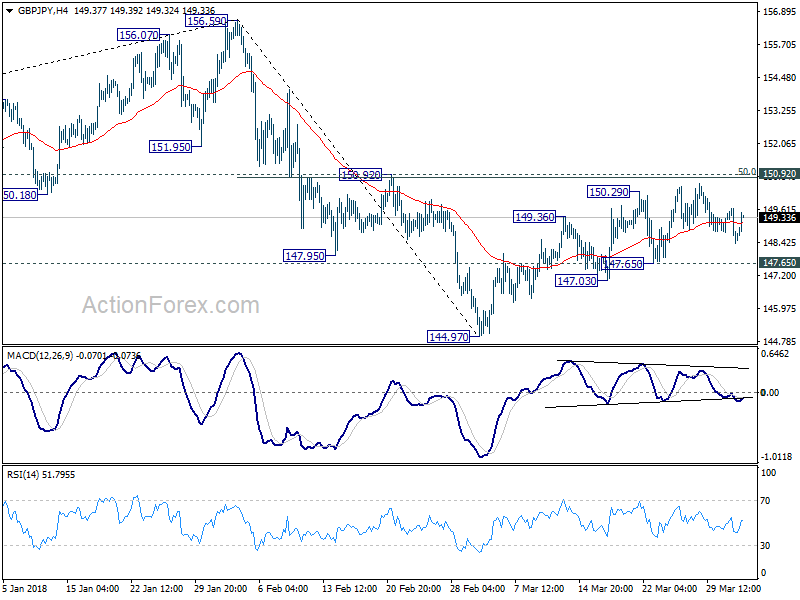
Daily Pivots: (S1) 148.17; (P) 148.92; (R1) 149.45; More...
Intraday bias in GBP/JPY remains neutral at this point. Corrective rise from 144.97 might still extend. But we'd expect strong resistance from limit upside and bring fall resumption. On the downside, below 147.65 minor support will bring retest of 144.97 low first. However, sustained break of 150.92 will indicate near term reversal and pave the way back to retest 156.69 high.
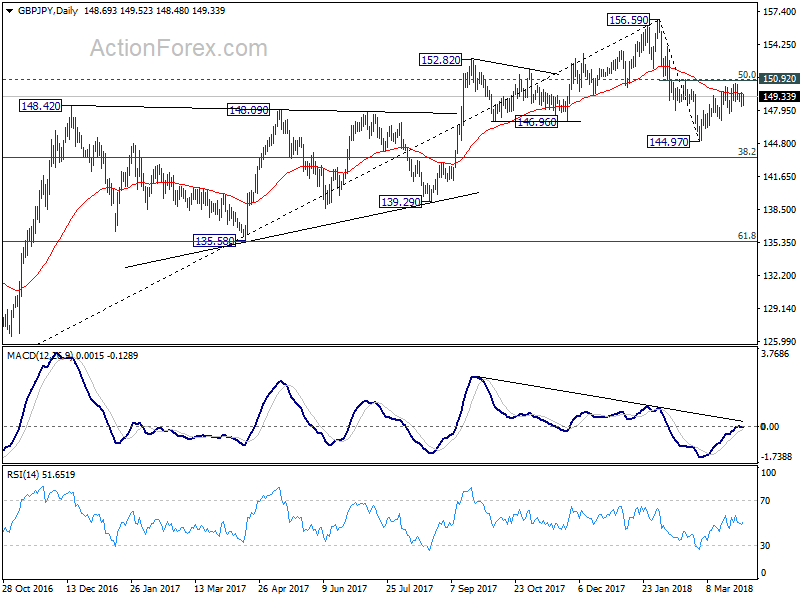
In the bigger picture, the case for medium term reversal continues to build up. There is bearish divergence condition in daily MACD. 146.96 support was taken out. And GBP/JPY was rejected by 55 month EMA. Break of 38.2% retracement of 122.36 to 156.59 at 143.51 will pave the way to 61.8% retracement at 135.43 and below. This will now be the preferred case as long as 150.92 resistance holds.