Sample Category Title
Eurozone Data Headline a Quiet Good Friday
The global financial markets will have very little to report on Friday, with most traders pausing for the Easter long weekend. That being said, Good Friday will see a small handful of important data that traders may want to consider when they return to action next week.
Action begins at 06:45 GMT with a report on French producer and consumer inflation. The consumer price index (CPI) is projected to grow 2.1% for February, after plunging 1.9% the previous month.
France’s harmonized index of consumer prices is projected to rise 1.5% in the 12 months through March, according to a median estimate of economists.
Later in the day, the Italian government will unveil the latest consumer inflation data for March. The consumer price index (CPI) is forecast to rise 0.7% year-over-year, pointing to subdued inflationary pressures. The EU harmonized index will likely show growth of 0.8% annually.
Market participants can expect the data dump to continue over the weekend, with China’s National Bureau of Statistics reporting its latest PMI reports on Saturday. At 1:00 GMT, the government will report on manufacturing and non-manufacturing PMI. Taken together, the reports provide a holistic view of the world’s second-largest economy.
On Sunday, the Bank of Japan (BOJ) will release the Tankan large manufacturing outlook for the first quarter. The headline data will provide a high-level overview of factory output in the world’s third-largest economy.
Action resumes next week with a steady stream of economic data. On Easter Monday, traders will brace for a deluge of manufacturing PMIs from around the world.
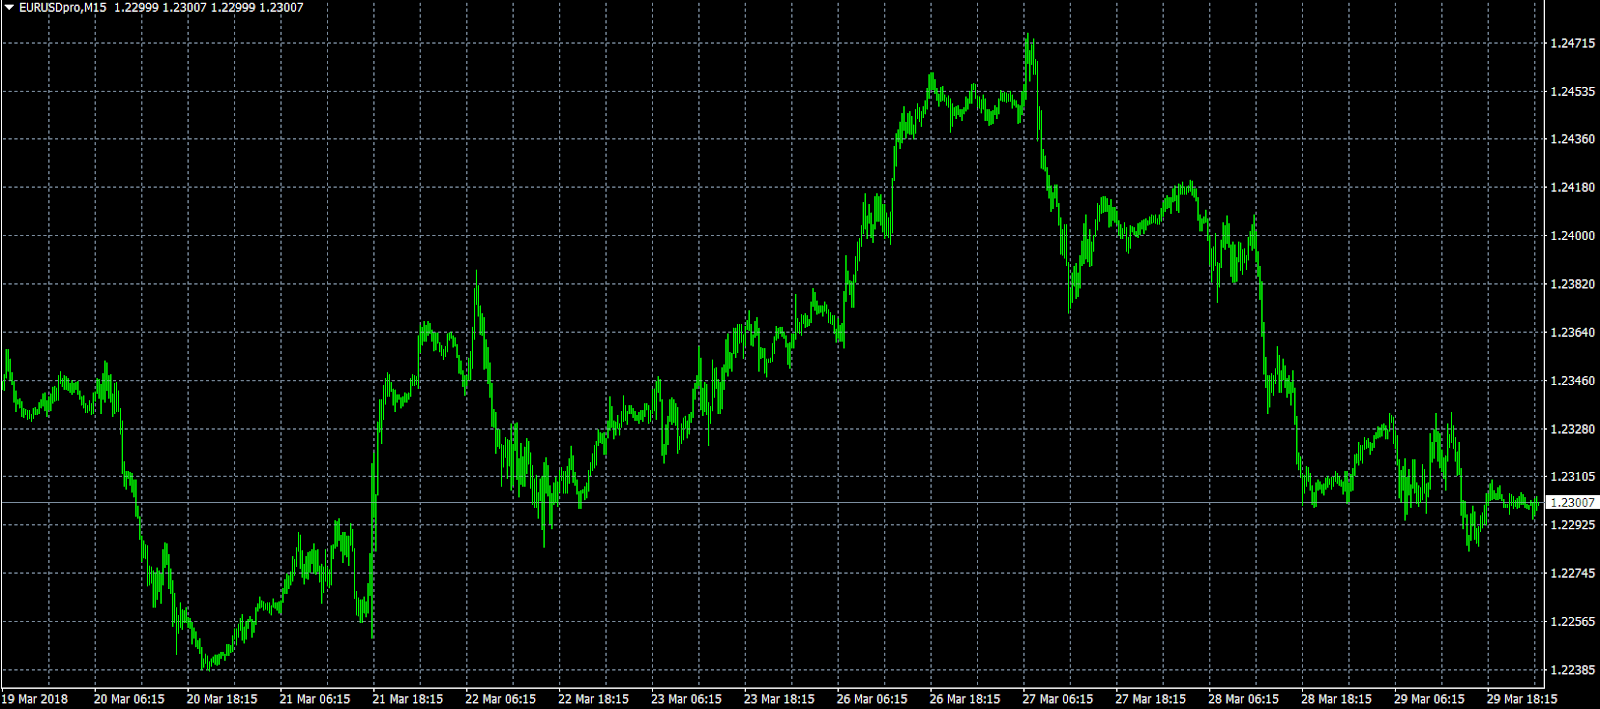
EUR/USD
Europe’s common currency was dragged lower on Thursday, but prices held above the pivotal 1.2300 US handle. EUR/USD has faced several swift selloffs this week, with prices tumbling 170 pips from the Tuesday swing high near 1.2470. In terms of market levels, traders are eyeing the 1.2300 support level for signs of a bearish breakdown. Upside is expected to be limited without compelling data providing the necessary catalyst.
 USD/JPY
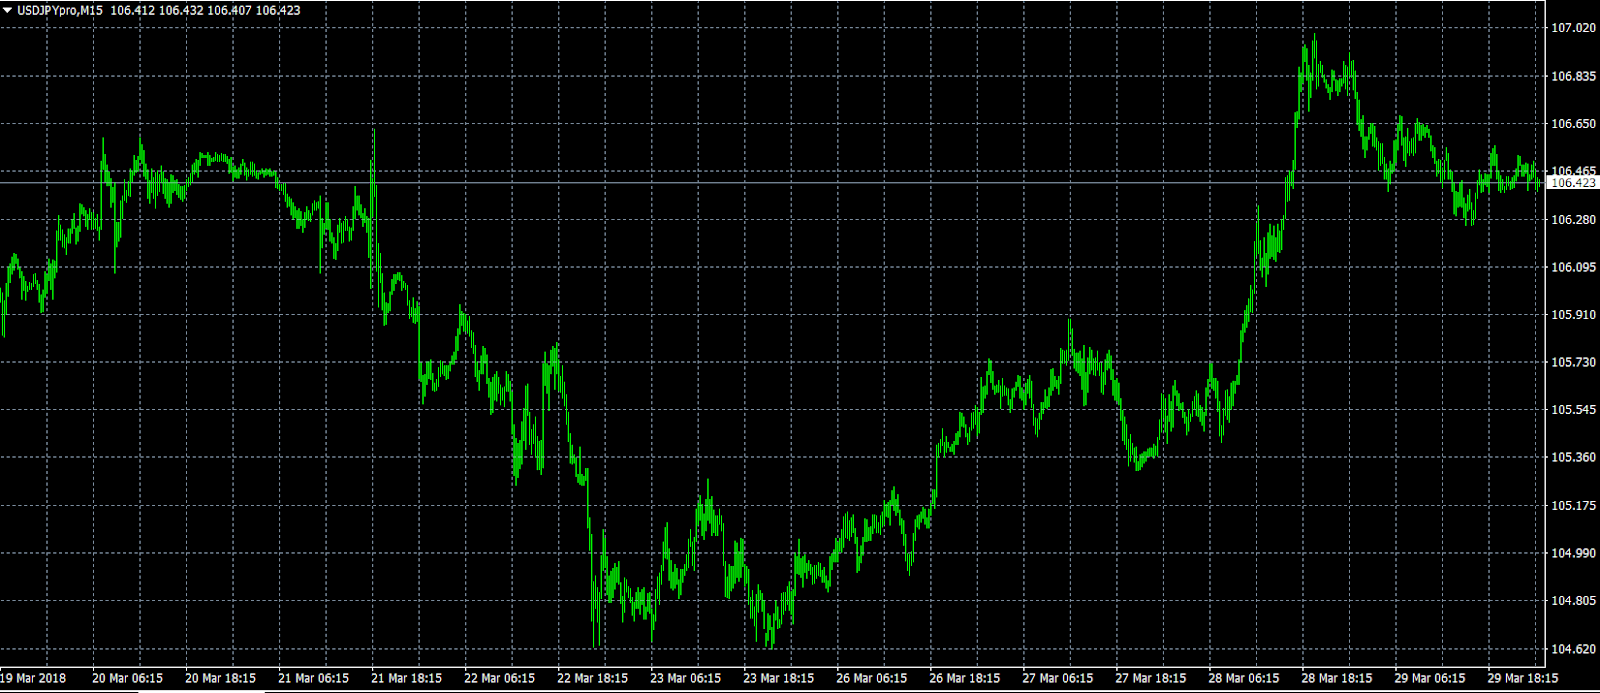
The dollar enjoyed firm gains against the yen this week, with prices coming within a few pips of 107.00 on Wednesday. At the time of writing, USD/JPY was trading at 106.43, where it was little changed form the previous day. The pair faces immediate support at 106.39, which corresponds with the daily low from Thursday. A further breakdown would expose USD/JPY to a break below 106.00.
 GBP/USD
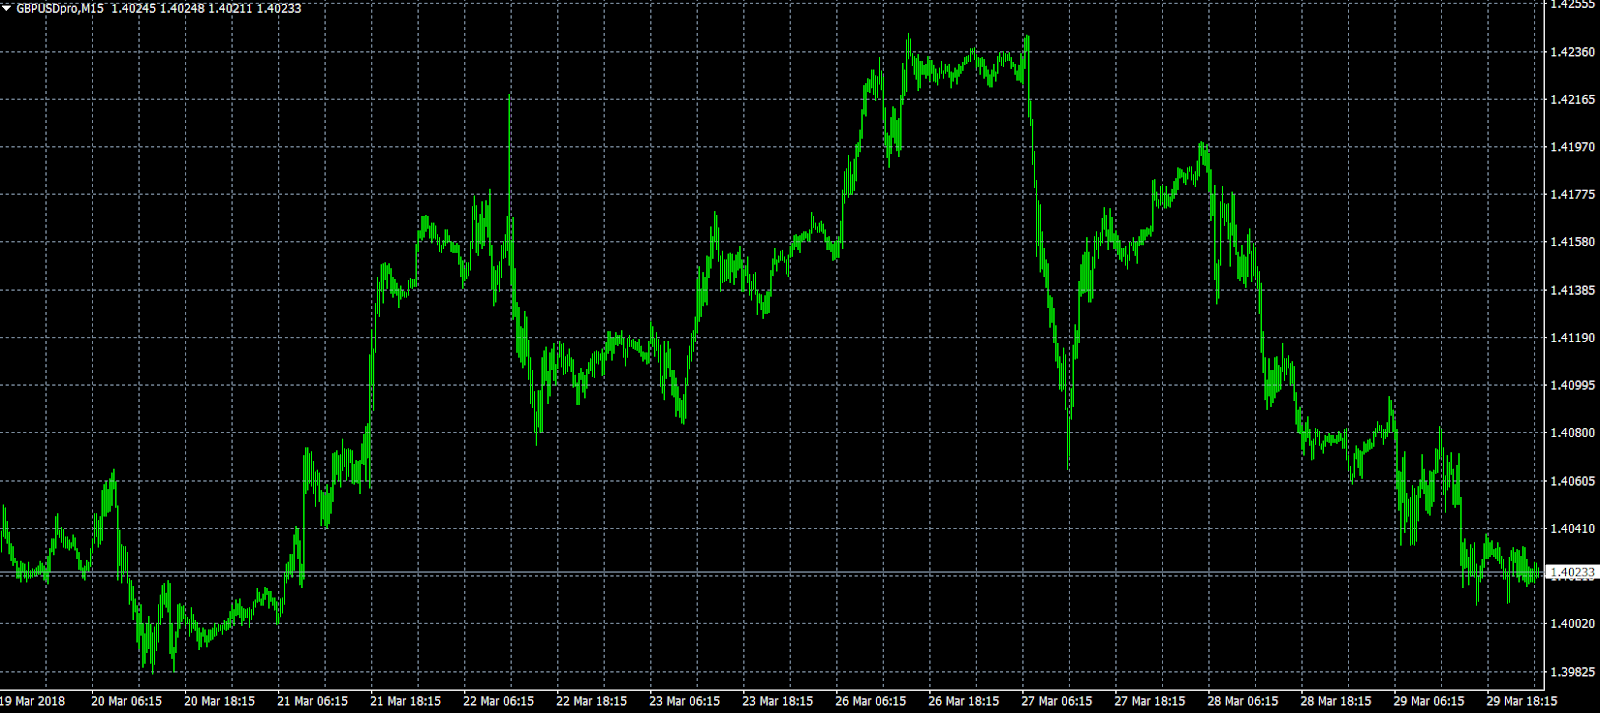
Cable rounded out its third consecutive loss on Thursday, with prices falling toward the psychological 1.4000 handle. At the time of writing, GBP/USD was trading at 1.4025, where it was little changed compared with the previous close. Key levels to watch for include 1.4000 and 1.3910 on the downside and 1.4080 and 1.4145 on the upside.
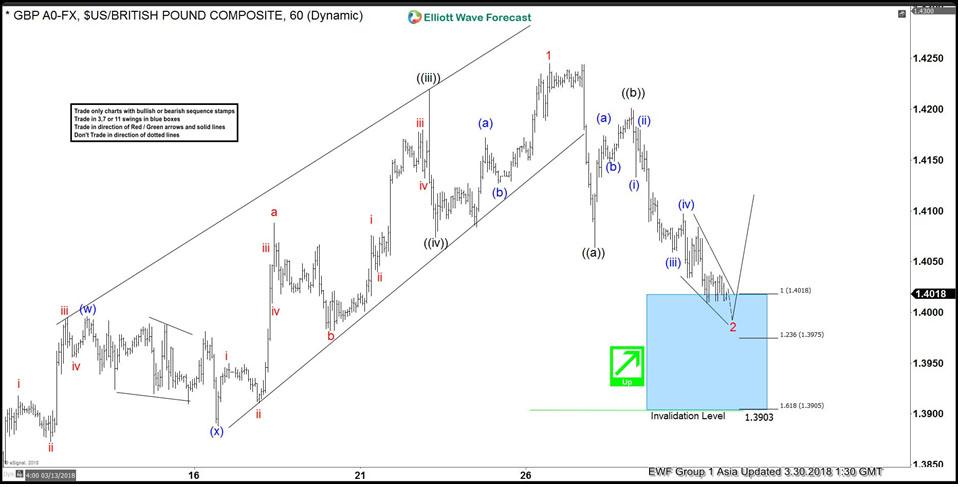
GBPUSD Elliott Wave View: Calling The Bounce Higher
GBPUSD Elliott Wave short-term sequence from 3/01 low (1.3709) ended as a Leading Diagonal structure in Minor wave 1 at 1.4248 high in 5 waves. Down from there, the pair is correcting that cycle in Minor wave 2 pullback in 3, 7 or 11 swings before it resumes the upside. So far pair is showing 3 swings back from the peak, which we are labeling as a Zigzag correction. Where Minute wave ((a)) ended with internal distribution of 5 waves at 1.4065 low and Minute wave ((b)) bounce ended in 3 swings at 1.4199 high.
Below from there, Minute wave ((c)) remain in progress with internal distribution of another 5 waves. Where Minutte wave (i) of ((c)) ended at 1.4133, Minutte wave (ii) of ((c)) ended at 1.4181. Then Minutte wave (iii) of ((c)) ended at 1.4059 and Minutte wave (iv) of ((c)) ended at 1.4095. And below from there, Minutte wave (v) of ((c)) remain in progress which has managed to reach the 100%-123.6% ext area of ((a))-((b)) already at 1.4018-1.3975 area. And soon as far as a pivot from 3/01 low (1.3709) remains intact pair is expected to resume the upside once again. We don’t like selling the pair into a proposed pullback and expect buyers to appear again at 1.4018-1.3975 for 3 wave bounce at least.
GBPUSD Elliott Wave 1 Hour Chart
The Weekly Bottom Line: Soft Spending Suggests Another Weak Q1
U.S. Highlights
- Investor optimism recovered following the softening of China's stance to the recent U.S. tariffs while the renegotiated KORUS trade deal with South Korea also bodes well for stateside producers.
- February's consumer spending report indicated progress on the inflation front. However, weak consumer spending will weigh on GDP growth in the first quarter which is expected to advance by less than 2%.
- Consumer strength should reassert itself as the year progresses alongside a tightening labor market and tax cuts, enabling the Fed to raise rates two more times this year.
Canadian Highlights
- There were encouraging signs on the NAFTA renegotiations front this week. An innovative approach to motor vehicle content requirements and optimistic statements from U.S. negotiators both bode well for a speedy resolution.
- A number of provincial budgets were released this week, with Ontario and Quebec's plans standing in stark contrast to one another.
- Monthly GDP contracted slightly in January on weakness in oil and gas and real estate. Some of the weakness can be put down to 'one offs', but clearly the robust growth of 2017 is now in the rear view mirror.
U.S. - Soft Spending Suggests Another Weak Q1
It was a relatively quiet week for economic data with investors turning their attention to political developments. Investor optimism recovered following the softening of China's stance to the recent U.S. tariffs. The Middle Kingdom appeared to be backing down from retaliatory tariffs previously threatening U.S. cars, wine, and food products, instead appearing increasingly open to improving U.S. access to Chinese markets. This should benefit several regional economies that rely on exports to China. As we noted in our recent State Economic Forecast, over one third of South Carolina's auto exports are destined for China, and their share is rising. Furthermore, the renegotiated KORUS trade deal with South Korea doubles the number of vehicles allowed to be exported from American carmakers and contains a commitment from South Korea to reduce steel exports to the U.S. by 30%, adding to the positive prospects for domestic producers. The constructive trade developments led the greenback higher over the week, but gains in major equity indices were restrained by tech sector induced volatility.
Global equity markets fared better as trade tensions thawed. However, trade uncertainty still lingers in Europe, with only four weeks until a temporary exemption from U.S. imposed steel and aluminum tariffs expires. The EU is contemplating lowering tariffs on a range of U.S. goods including cars, machinery, pharmaceuticals, and food in hopes of averting a trade war. However, the "carrot" approach is not favored by all members of the EU, including France. That could result in higher volatility in global equity markets in the weeks ahead.
Long-term yields fell this week in the U.S., while yields on two-year Treasury notes rose. Short-term yields are poised to rise further over the medium-term as the Federal Reserve continues along its tightening path amidst higher government spending. President Trump's $1.3 trillion spending bill, signed last Friday, adds to the early-February commitment of $288 billion in domestic and military spending over the next two years which will amplify fiscal pressures. These will lead to higher Treasury issuance and should lift bond yields that will be further supported by rising inflation expectations and interest rates as the global economic recovery continues.
February's consumer spending report indicated progress on the inflation front. Core PCE inflation ticked up slightly (Chart 1), with price gains over the recent three months averaging 2.3% in annualized terms. We expect this strength in inflation to continue, supported by diminishing slack in the U.S. economy, rising global economic activity, a relatively weak USD, and the fading of idiosyncratic factors. However, other details of the report were less encouraging. Consumer spending came in soft (Chart 2), adding to January's disappointment, and weighing on GDP growth in the first quarter, which is still expected to advance by less than 2%. Still, we believe that consumer strength will reassert itself as the year progresses alongside a tightening labor market and tax cuts. Such a backdrop should enable the Fed to continue gradually raising interest rates this year, with another two hikes expected this year before 75 basis points of increases during 2019.

Canada - Weak Data Caps a Quiet Week
It was a relatively quiet week in Canada. At the national level, NAFTA renegotiations remained front and centre. Developments were generally positive. Reports have emerged of a creative solution to content rules for autos: the U.S. proposal is said to include workers' wages in the calculation – that is, cars produced by higher paid workers would avoid tariffs. This clearly benefits Canadian and U.S. producers, while at the same time encouraging higher wages in Mexico (and hopefully creating more demand for imported goods there). How such a proposal would be received by Mexican negotiators is yet to be seen.
Also encouraging were indications that the U.S. hopes to wrap discussions up in coming months, however, the fact that the conclusion remains tied to exemptions from steel and aluminum tariffs is less positive. Given the distance between parties on contentious issues such as dispute resolution and supply management, achieving a quick conclusion is a lofty goal. That said, the recent positive tone from U.S. officials and refocusing of ire towards China both suggest that a timely resolution is not out of reach.
Sticking to politics, this week also saw two key provincial budgets released. Ontario and Quebec took different approaches: Quebec used its relative fiscal strength (fiscal surpluses have been delivered for several years in a row) to deliver 'the best of both worlds' – a balanced budget that provides for increased spending and tax reductions as well as paying down the provincial debt. In contrast, the Ontario government is no longer aiming for near-term balance, introducing a slew of spending measures that move the province back into the red (Chart 1). For further details, please see our analyses (Quebec; Ontario, Newfoundland and Labrador also released its latest budget this week).
With little other economic data out this week, the star of the show was monthly GDP for January. In the event, Canada started the year on the back foot: output contracted 0.1% month-on-month. Weakness was fairly widespread, as 10 of 20 major sectors saw activity decline, but a few stood out. Mining, quarrying, and oil and gas extraction pulled back 2.7% on unplanned maintenance activities. Government changes to mortgage underwriting regulations led the real estate sector to a 0.5% contraction as activity at the offices of real estate agents and brokers saw the second largest decline on record. Despite this, the service side of the economy as a whole was able to eke out the slightest of gains (+0.007%), making the current expansion the second longest on record (Chart 2).
January's number should be put into broader context. Monthly noise aside (a rebound in oil and gas seems likely given temporary factors held January back), Canada was set for a moderation of growth after an unsustainably strong start to 2017. This should not be a cause for concern. Growth around Canada's longer-term trend of 1.5% to 1.9% per year is consistent with ongoing (modest) job gains, and wage and inflation pressures. It is also consistent with higher policy interest rates. The noise in the data, together with still elevated economic risks will likely stay the Bank of Canada's hand in the near term, but absent a material negative shock, the direction of future interest rates remains clear: up.

U.S.: Upcoming Key Economic Releases
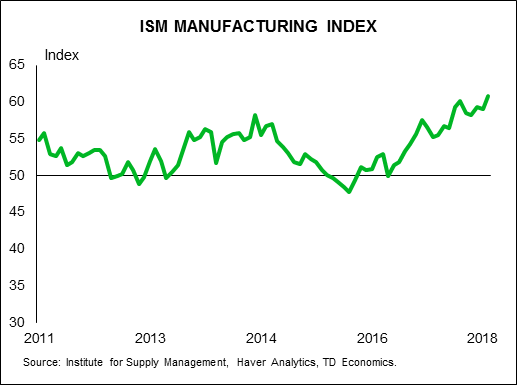
U.S. ISM Manufacturing Index - March
Release Date: April 2, 2018
Previous Result: 60.8
TD Forecast: 59.8
Consensus: 60.0
We expect the March PMI to pull back a point to 59.8, putting the index at a level consistent with regional manufacturing surveys. The recent slowing in new orders also signals some giveback. We expect the survey to keep a solid level, but markets will be attentive to a more pronounced correction which could be linked to market volatility and tariff concerns.
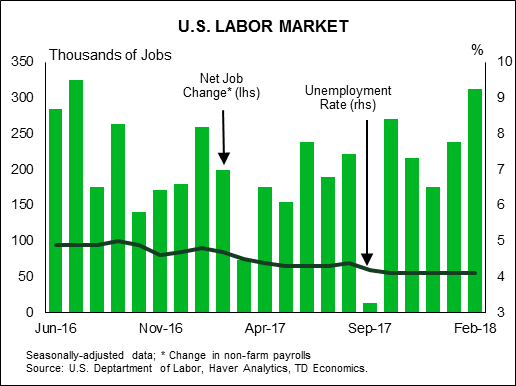
U.S. Employment - March
Release Date: April 6, 2018
Previous Result: 313k, unemployment rate: 4.1%
TD Forecast: 170k, unemployment rate: 4.0%
Consensus: 185k, unemployment rate: 4.0%
We expect nonfarm payrolls to pull back to 170k in March after recording a 313k jump in February. The previous gain was outsized due to unseasonably warm weather, which likely boosted construction payrolls. We view this pace as unsustainable at this stage of the business cycle and see scope for a sizeable pullback, given that prints above 300k on average correct by 150-175 the subsequent month. Payrolls in the month of March also disappoint on average by -48k, the most next to May.
Given the recent pace of job gains, we expect the unemployment rate to move lower to 4.0%. We expect average hourly earnings to rise 0.3% m/m, leading the y/y pace higher to 2.8% y/y. Day-of-the-week effects (with the 12th landing on a Monday) together with mean reversion point to a strong m/m print.
Canada: Upcoming Key Economic Releases
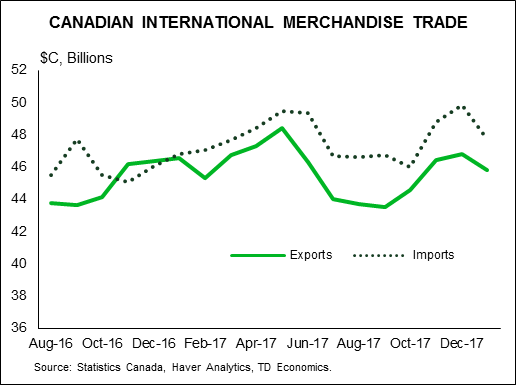
Canadian International Trade - February
Release Date: April 5, 2018
Previous Result: $-1.9bn
TD Forecast: -$2.2bn
Consensus: N/A
TD expects the international merchandise trade deficit to widen to $2.2bn in February from $1.9bn the prior month, reflecting a rebound in imports offset by a more modest increase in exports. Exports will benefit from a weaker CAD after peaking in late January. Elsewhere, a partial rebound in motor vehicles should help support headline exports after plant shutdowns led to a 13.1% decline in January. Real energy exports should rebound from a sharp decline in January but further declines in crude oil prices will weigh on nominal exports. Meanwhile, imports should see a broad rebound after falling over 4% in January.
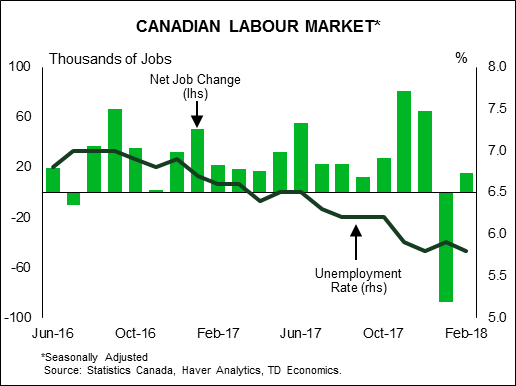
Canadian Employment - March
Release Date: April 6, 2018
Previous Result: 15k, unemployment rate: 5.8%
TD Forecast: 20k, unemployment rate: 5.7%
Consensus: N/A
TD looks for job growth of 20k in March, which should push the unemployment rate to a new post-crisis low of 5.7%. Full-time employment should see a modest rebound after falling 40k last month but we still see scope for part-time to outperform. The six month trend of full -time job growth is still running at a robust 40k while part -time job losses have averaged -21k per month. After the sharp increase in February CPI, markets will pay close attention to measures of wage growth, which is already running at 3.1% y/y for permanent employees. We expect this to drift higher in March on muted base effects and the overall tightness of the labour market, but it is unlikely we surpass the January high of 3.3% without more support from the demand side. Overall, this should make for an upbeat report and provide further evidence of diminishing labour market slack.
Australia & New Zealand Weekly: RBA on Hold; Economic & Financial Developments in 2018 Further Support Steady Rates in...
Week beginning 2 April 2018
- RBA on hold; economic and financial developments further support steady rates in Australia.
- Australia: RBA decision, retail sales, dwelling approvals, trade balance, house prices.
- NZ: QVNZ house prices.
- China: Caixin PMIs.
- Euro Area: CPI, unemployment rate.
- US: nonfarm payrolls, ISM PMIs.
- Key economic & financial forecasts.
Information contained in this report current as at 29 March 2018.
RBA on hold; economic & financial developments in 2018 further support steady rates in Australia.
The Reserve Bank Board next meets on April 3. There is almost certain to be no rate move coming from that meeting.
Market Pricing and Analysts Forecasts
Market pricing for the RBA has moved significantly over the last six months.
Last September markets were predicting nearly two rate hikes by end 2018. Now markets have pushed these "nearly two rate hikes" back to 2019 with only around a 40% chance of any move by the end of 2018. The first of these hikes is fully priced in by mid-year and the second in the second half of the year.
Economists' forecasts have also been shifting.
Thirteen major banks/ investment banks contribute to the regular Bloomberg Survey. Back in September seven expected rate hikes by the third quarter of 2018 and six expected rates to be on hold.
Recall that throughout 2017 Westpac has had the "outrageous" call that the RBA would be on hold through 2017; 2018; and 2019.
The latest Bloomberg Survey sees considerable changes in the economists' views. Only one of the thirteen continue to expect a hike by the third quarter of this year but eight others are anticipating a move by the first quarter of 2019. Only four, including Westpac, expect rates to be on hold through the first quarter. We cannot be sure when the other three are expecting the first move as the survey only extends to the first quarter.
A range of recent developments is easing concerns about the need for the RBA to raise rates.
Emerging Trends in the Labour Market
The labour market has always been seen as the "star performer" for the economy. But jobs growth is slowing. The pace of jobs growth over the last three months has slowed from 3.4% over the course of 2017 to 2.1% (three month annualised). Furthermore, the unemployment rate, which fell from 5.9% to 5.5% by September has stabilised, printing 5.6% in February.
Westpac concurs with around a 2.0% pace of employment growth over the course of the remainder of 2018. Associated with a modest further rise in the participation rate we expect the unemployment rate to remain around current levels. With the "full employment" rate assessed as being around 5%, considerable "slack" is expected to remain in the Australian economy over 2018.
Recently the modest fall in the underemployment rate has stalled with the rate actually rising from 8.3% to 8.4% over the last three months.
Developments in Housing Markets
Most housing markets have peaked. Over the last three months, house prices in Sydney have fallen by 4.2% (annualised) compared to an increase of 3.1% over the last year. For Melbourne and Brisbane house prices have stalled compared to increases over 2017 of 8.9% and 2.4% respectively. With the value proposition for investors in particular appearing to be discouraging (low rental yields; flat prices; increasing regulation and potential tax changes), prospects in the major Australian housing markets are clouded.
Financial Conditions are Tightening
Other asset markets have also been underwhelming. Since the beginning of the year, Australia's share market has fallen by 4%, including a 7% fall for bank stocks and a 4.7% fall for resources.
Australian banks generally borrow in the short end of the market at BBSW - a rate that last year traded at around 20-25 basis points above the expected RBA overnight cash rate, reflecting "normal" credit risk. That margin has increased to around 50 basis points - effectively an increase in short term funding rates of around 25 basis points or one full RBA rate hike.
That increase in spreads is not due to an assessed widening in bank credit risks. There are other explanations for this development. One important explanation is the recent US tax changes which allow US corporates (in particular the cash rich technology companies) to direct funds (mainly US dollars) back to the US from foreign sources (total funds estimated at around $1.5 trillion without paying the onerous 35% tax rate). Foreign banks, including Australia, which had relied on this USD funding, have had to switch demand for funds to local markets, intensifying rate pressures.
The "shortage" of USD offshore funds has boosted USD funding costs - LIBOR by around 25 basis points.
Most business borrowers will be affected by this increase in BBSW. One small bank even slightly raised its variable mortgage rate to reflect this 25 basis point increase in short term funding costs. This is despite other banks cutting their rates on new lending for some forms of investment loans.
Australian banks have also recently suffered increases in their funding costs in longer maturities with bank 5 year paper lifting by around 15 basis points compared to the risk free rate.
Credit growth has slowed to 3.8% annualised over the three months to February compared with 4.9% growth for 2017. This includes a slowing in housing credit growth from 6.3% in 2017 to 6.0% annualised over the past three months. Business credit stalled over the past three months, with 0.4% annualised growth, in contrast to a 3.2% increase in 2017.
Global Growth may have Plateaued
The positive lift in global growth in 2017 may be fading.
Manufacturing PMI's stood out in 2017 as signalling strong global growth. However recent developments have been less encouraging. The PMI's are estimated to have bottomed out around September 2016. The Global manufacturing PMI has moved to 50.4 (September 2016) to 54 (December 2017) back to 53.2 (March). Respectively, Europe (52.6; 60.6; 56.6); US (51.5; 55.5; 55.7); Japan (50.4; 54; 53.2) and China (50.4; 51.6; 50.3).
Trade tensions must be impacting confidence although there remains considerable uncertainty over the extent and timing of President Trump's trade policies. The 25% and 10% tariffs on steel and aluminium announced at the beginning of March were initially imposed on all countries, but subsequently rolled back to only a few nations, including China, although excluding Europe; Brazil; and Canada (among others). This exemption has been enough to hold the EU back from retaliating to date.
China has quickly become the sole focus of the trade debate. With tariffs to be imposed on around $50bn of imports from China. Just after this announcement, China retaliated with planned tariffs on $3bn of US imports across 128 products.
Our view is that it seems most likely that a compromise will be found between the US, Europe and China. But the animosity and uncertainty will continue to weigh on confidence.
Exchange Rates are also Questioning the Global Outlook
Usually a slowing global environment will weigh on the Australian dollar and support the USD. The Trade Weighted Index for the AUD has fallen from 65.70 end January to 62.60 to date. The Australian dollar has fallen from a recent peak of USD 0.81 in late January to USD 0.773. Furthermore, the USD has stabilised. In 2017, a weaker USD (down around 14%) was associated with strengthening global growth. Since late January, the USD Index has held steady despite considerable market volatility.
Overall developments since the beginning of the year both domestically and globally have strengthened the case for a benign rate outlook in Australia.
The week that was
In a week devoid of top-tier data, trade frictions remained the dominant force for financial markets. The US interest rate curve has flattened as long-dated yields fell, and equities have experienced further declines, taking the S&P500 and NASDAQ back near their early-February lows.
On trade, a lot has been said and done in the past month. So as March ends, a recap is in order.
After many a rumour, President Trump's initial trade action at the beginning of March was to impose universal 25% and 10% tariffs on steel and aluminium imports to the US. The breadth of the measure received considerable attention, but concern quickly faded as the biggest exporters of steel, the EU; Brazil; and Australia among others, as well as Canada and Mexico were granted exemptions. This decision emphasized (unsurprisingly) that China is the focus of the trade debate in the US. (Note on steel and aluminium, a caveat applies: the exemption granted by President Trump is 'temporary' pending negotiations; hence uncertainty remains.)
As we noted in the last edition of Cliff Notes, President Trump has since upped the anti against China, announcing a focused threepart trade policy. Included were tariffs on around $50bn of (yet to be confirmed) US imports from China; a request for the Treasury Secretary to draft new investment restrictions for Chinese firms who wish to invest in the US; and the bringing of a WTO complaint against China for discriminatory licensing practices.
China has since retaliated against the US, announcing tariffs on $3bn of US imports across 128 products. Most notable in this action however is that Chinese authorities made clear it was a targeted response to the initial steel tariff only; further, their introduction is to be delayed until the US and China can hold negotiations. This is very clear evidence of China seeking a diplomatic solution.
China's reserve is not because they lack power. To the contrary, they have scope to introduce wide-ranging tariffs, and tightly control who can make investments in their domestic economy. While given less press, China also has the capacity to affect US borrowing costs, being the largest foreign holder of US Treasury securities.
With this is mind, it is arguably best to regard further reports of the US imposing investment restrictions on Chinese firms wanting to invest in the US as a bargaining chip. National security is certainly an issue for the US in niche sectors; however, the opportunity to engage with China and open up opportunities for US firms to invest is not one to be missed.
Our overall view on the current trade frictions is that a compromise will eventually be found between the US and China, and that Europe will also be kept on side. However, this could take a long time. In the meantime, financial markets are likely to face continued uncertainty and hence volatility.
For US monetary policy, while trade relations are a risk that warrant close attention, as it stands the FOMC's gradual interest rate hike cycle won't be delayed or stopped. As above, uncertainty looks to have halted the rise in term interest rates in the US, while the US dollar is only a few percentage points above its 2018 low. Financial conditions facing the US economy are therefore very positive. Available information also points to consumer and business confidence remaining robust, supporting the forward view for consumption and business investment.
Speaking of sentiment, the release of Euro Area confidence data this week has highlighted that, while headline sentiment is strong, households are likely to pull back on spending during 2018. The reason being that, in recent years, pent-up demand has been released with the aid of consumer credit and dissaving. Going forward, spending growth is likely to come back into line with income growth. We and the ECB still anticipate that GDP growth will remain above potential, allowing the Governing Council to raise interest rates gradually in 2019 and 2020. But there is a risk that consumers pull back more aggressively and/ or businesses revert to their past default of financial and operational efficiency - eschewing increases in investment and employment.
Closer to home, this week also saw the release of New Zealand's new Policy Targets Agreement for the RBNZ. Greater weight will be given to employment, both with respect to the RBNZ's decision making and their communications on the economy. However, inflation remains the focus for policy setting.
Notably the 2.0%yr mid-point for the 1-3%yr inflation range was kept, and will remain the prime benchmark for policy. A procedural change was also made, with a policy Committee to replace the current singular decision making of the RBNZ Governor. The Committee will be made up of five to seven members, with external members the minority. Treasury will be limited to a nonvoting observer. However, the Minister of Finance will have a more regular opportunity to alter the structure of the Committee through the appointment of Committee members as well as the Governor. Further, the Minister of Finance will also now determine the operational objectives of the Committee, such as the inflation target, unilaterally rather than with the Governor. Advice on changes has to be sought from the Treasury and RBNZ, but not necessarily followed.
Chart of the week: Short term funding spreads
.As mentioned in the weekly essay on the previous page, short term funding spreads have widened significantly over the recent month or so.
The chart to the right shows: a) TBILLS-OIS 3m spread - US treasury bill minus the market expected overnight fed funds rate; b) LIBOR-OIS 3m spread - LIBOR (USD bank funding) minus the market expected overnight fed funds rate; and c) BBSW-OIS 3m spread - BBSW (AUD bank funding) minus the market expected overnight RBA cash rate.
When the spike in rates begun, the three spreads moved in unison higher. Notably in the past few days, the treasury bill spread has edged back in while the bank funding spreads remain elevated.
New Zealand: week ahead & data wrap
Dual meaning
This week brought the long-awaited details of the new Government's planned reforms to the monetary policy framework. Incoming RBNZ Governor Adrian Orr signed an agreement with the Minister of Finance that included a revised set of policy targets. The Minister also detailed changes to the RBNZ's decision-making structure, which will take effect next year.
The RBNZ's policy objectives have been expanded to include not just price stability, but also a contribution to supporting maximum sustainable employment. This is along the lines of the 'dual mandates' seen in Australia and the US.
In terms of its policy targets, the RBNZ will continue to aim for future inflation of 1-3% over the medium term, with a focus on keeping inflation near the 2% midpoint. Retaining the focus on the midpoint was not guaranteed, and its removal might have signalled an intention to let inflation run hotter in coming years.
The new employment objective does not include a numerical target, and the phrasing of maximum 'sustainable' employment allows the RBNZ to respond in a symmetrical way to variations around a long-run natural rate. The RBNZ will also be required to explain how its actions are contributing to supporting maximum sustainable employment, but will not be held solely accountable for labour market outcomes.
Our view is that, in current circumstances, the introduction of the employment objective will make little difference to the RBNZ's behaviour. Today's unemployment rate of 4.5% is around what most would consider to be a sustainable long-run rate. Inflation is within the target range (albeit on the lower side), and the RBNZ is forecasting it to stay there. And the RBNZ already has a great deal of flexibility around how it manages the path of inflation over the medium term.
That said, there may be circumstances in the future where the employment objective does make a difference to the RBNZ's interest rate decisions. Arguably, there have been times in the past when a dual mandate might have made a difference as well - the Finance Minister has for instance mentioned the 2014 episode, when the RBNZ raised the cash rate by 100 basis points in anticipation of a rise in inflation, only to start reversing those hikes a year later.
At the time, the RBNZ believed that the economy was running above its non-inflationary potential. With the benefit of more historical data, the RBNZ now estimates that output was still below potential in 2014. A focus on the labour market might have brought the RBNZ to the right conclusion sooner: the unemployment rate was around 5.5% at the time, which is consistent with some spare capacity remaining.
However, the RBNZ is a forward-looking inflation targeter, and focuses on how inflation pressures are expected to develop over the medium term. While the unemployment rate may have been on the high side in 2014, the RBNZ was forecasting a return to full employment over the next few years, which would have been associated with a pickup in wage and price pressures. So it's far from clear that a focus on employment would have prevented the 2014 rate hikes, although the RBNZ might have been less aggressive in signalling future rate hikes - initially it expected that it would need to hike the OCR by at least 200 basis points over two years.
In addition to the new policy targets, the Minister of Finance announced a change in how the RBNZ determines monetary policy. Currently, New Zealand operates a single decision-maker model, where the Governor has sole authority for setting the OCR. From 2019, monetary policy will be set by a committee of five to seven members. This will be made up of a majority of RBNZ internal members and a minority of external members. There will also be a non-voting Treasury observer. External members will be appointed by the Minister of Finance on the recommendation of the Board for four-year terms, while internal members will be appointed the same way but for staggered fiveyear terms. This will be a voting committee, with a non-attributed vote count and non-attributed minutes of the meetings to be published.
These changes strike a nice balance, drawing on the benefits of group decision-making while avoiding some of the potential pitfalls. The evidence suggests that groups make better decisions than individuals on average. However, attributed comments and votes could have impeded free and frank discussion among the group. In addition, allowing all members of the committee to speak publicly about the policy outlook has at times sent confusing and contradictory signals to markets in the US and UK. The RBNZ will avoid this by making the Governor the only spokesperson for the committee.
The direction of the changes to the monetary policy framework was well-signalled by the new Government, with only the details missing up until now. We have not altered our outlook for the OCR as a result of these changes - we think the RBNZ already has good reason to keep interest rates low for a considerable time. Our forecast remains for the OCR to rise only in late 2019, later than markets anticipate.
Data Previews
Aus Mar CoreLogic home value index
Apr 3, Last: -0.3%, WBC f/c: -0.2%
The weak finish to 2017 for Australia's housing markets extended into early 2018. The CoreLogic home value index, covering the eight major capital cities, dipped another 0.3% in Feb to be down 1.3% since Oct. Annual price growth slowed to 2%, from a peak of 11.5% in May and dipping below the previous low in Sep 2016 to be the weakest pace since 2012.
The daily index points to further price slippage in March and a 0.2% decline nationally. That would see annual growth dip to below 1%. While there are some hints in the monthly profile that the pace of price declines is moderating, they are far from convincing. The regional detail continues to show a sharper slowdown in Sydney and to a lesser extent Melbourne, both of which had shown much stronger price gains through the upswing. Notably, the milder slowdown in Melbourne looks to have accelerated somewhat in early 2018.
Aus RBA policy decision
Apr 3, Last: 1.50%, WBC f/c: 1.50%
Mkt f/c: 1.50%, Range: 1.50% to 1.50%
The RBA will almost certainly hold rates unchanged at its April meeting - as they have since they last cut rates in Aug 2016.
Attention will again focus on the Governor's decision statement. In March this reiterated the central line that: "further progress in reducing unemployment and having inflation return to target is expected, although this progress is likely to be gradual". The Governor sounded a little more confident about the outlook for wages growth which "appears to have troughed". However, other comments in the statement and the meeting minutes suggest the Bank may be less confident about its 3¼% growth forecast for 2018. The next official update to the Bank's forecasts is in the May Statement on Monetary Policy. This shift in language - if sustained in April - could be seen as paving the way for a downward revision. Either way, Westpac expects slower growth of 2.7% this year and the cash rate unchanged at 1.5% throughout this year and next.
 Aus Feb retail trade
Apr 4, Last: 0.1%, WBC f/c: 0.4%
Mkt f/c: 0.3%, Range: 0.2% to 0.7%
Retail sales posted a disappointing start to 2018 with a 0.1% gain in Jan only partially retracing a 0.5% decline in Dec which in turn followed a solid rebound in Oct-Nov from a weak Q3. Annual growth slowed to a sub-par 2.1%yr. The subdued result comes despite a firmer backdrop for consumer sentiment and suggests the step-up in price competition associated with the launch of Amazon's Australian retail operations late last year remains a restraining factor on nominal sales.
Retailers may have fared a little better in Feb. While price competition remains fierce and consumer sentiment softened a touch, retail sector responses to the NAB business survey showed a lift in conditions over Jan-Feb to the second highest reading since late 2015. However, the AiG PSI points to much weaker conditions for retail. On balance we expect Feb to show a 0.4% gain. Note that the survey should include Amazon Australia's retail sales.
 Aus Feb dwelling approvals
Apr 4, Last: 17%, WBC f/c: -4.0%
Mkt f/c: -5.0%, Range: -12.0% to -1.0%
The January dwelling approvals report came in well above expectations with a 17% jump driven, once again, by extreme swings in the lumpy 'high rise' segment (+60% in Nov, -47% in Dec and +36% in Jan). Approvals outside of high rise have been more mixed, private detached house approvals down 1.1% but 'mid rise' dwellings up about 15%. On a combined basis, total approvals ex high rise were up 2.9% nationally and 7.2%yr.
Housing finance data continues to point to modest gains in non high rise approvals, albeit with the trend showing signs of softening. High rise is much harder to call. Site approvals continue to point to the segment taking another leg lower after the weakening in the first three quarters of 2017. Note also that despite the big lift in Jan, high rise approvals were coming off a very weak Dec read. On balance we expect total approvals to retrace 4% in Feb but clearly extreme monthly volatility puts significant risks around this estimate.
 Aus Feb trade balance, AUDbn
Apr 5, Last: 1.1, WBC f/c: 0.5
Mkt f/c: 0.7, Range: -0.3 to 2.1
Australia's trade account recorded a surplus of $1.06bn in January as exports lifted 4.3%, boosted by a $0.8bn spike in gold shipments.
For February, the trade surplus is expected to narrow to $0.5bn, impacted by a pull-back in gold exports.
Export earnings are forecast to decline by 1.6%, down $550mn. An expected $0.8bn pull-back in gold is only partially offset by a lift in LNG volumes, on expanding capacity, and a lift in coal shipments.
Imports are expected to be unchanged in the month. A weaker currency, down 1.8% on a TWI basis and 0.8% lower against the US dollar, will see the cost of imports rise. However, we anticipate an offsetting moderation in fuel imports following two particularly strong months.
 US Mar employment report
Apr 6, nonfarm payrolls, last 313k, WBC 170k
Apr 6, unemployment rate, last 4.1%, WBC 4.0%
Nonfarm payrolls employment growth has been particularly strong in recent months. Feb posted a 313k gain, and job gains in the prior two months were also revised up by 54k in total. The three-month average stands at 242k, well up on 2017's 182k and 2016's 195k. After such strength, we are due a softer month, and so forecast a 170k gain. We note however that revisions could do the work and allow for another strong outcome above 200k for the month of Mar.
Turning to the household survey, had it not been for a jump in participation in Feb, the unemployment rate would have come down to 4.0%. Continued strength in employment will see the threshold attained and breached in coming months. A quick drop below 4.0% is a risk if participation reverses recent gains as employment holds up.
Obstinately Resilient USD
Currency Markets
Tackling the obstinately resilient USD will be a significant discussion next week after a week dotted with month-end flows and correctly modelled USD demand.But traders appear far too eager to get back on the dollar short roulette wheel even more so with the seasonal proclivity to typically dampen USD sentiment in April. But a word of caution, Apil showers tend to bring May flowers as far as the dollar is concerned and that causality alone should keep bearish dollar views in check.
The month-end flow has challenged some long-held market persuasions, and none more so than the USDJPY shorts after the market went all in in the low 105’s during the FANG meltdown, only to get summarily spanked this week. While it’s best to square positions ahead of weekend headline risk, the dollar short signals are not as bright as dealers idle banter would suggest.So during the interim, my strategy is to keep the powder dry until we get a convincing signal on the Central Bank Front or a dim view of US inflation before re-engaging the dollar downside. Given the evolving curious currency conundrum, there’s nothing wrong with taking another week off in currency markets as interest rates trades are providing a much more unobstructed view of the broader Macro landscape. But more to the point, don’t write off dollar yet – it’s been a surprisingly good week for the Greenback
Equity Markets
Equity markets are coming off an exceptional rough patch in March weighted down by tech sector woes, but pared back losses heading into the long weekend. I wouldn’t make much of a short covering rally, especially with the S&P 500 technology sector ending the month 4 percent lower
Oil Prices
Geopolitical anxieties, especially the tensions between Saudi Arabia and Iran, continued to bolster prices. And while the never-ending debate between US crude inventories and OPEC supply curbs cont.inues to provide short-term trading opportunities but price action is apparent, and we should expect a test of 2018 highs sooner rather than later.
Gold Prices
Consolidation rules the roost and expectedly so. After the shellacking on Wednesday, there’s apparently little appetite from Gold investors to get back in the saddle. Weekend headline risk permeates, and with the dollar coming off a surprisingly strong week, the jury remains out.
Eco Data 3/30/18
[php_everywhere instance="1"]
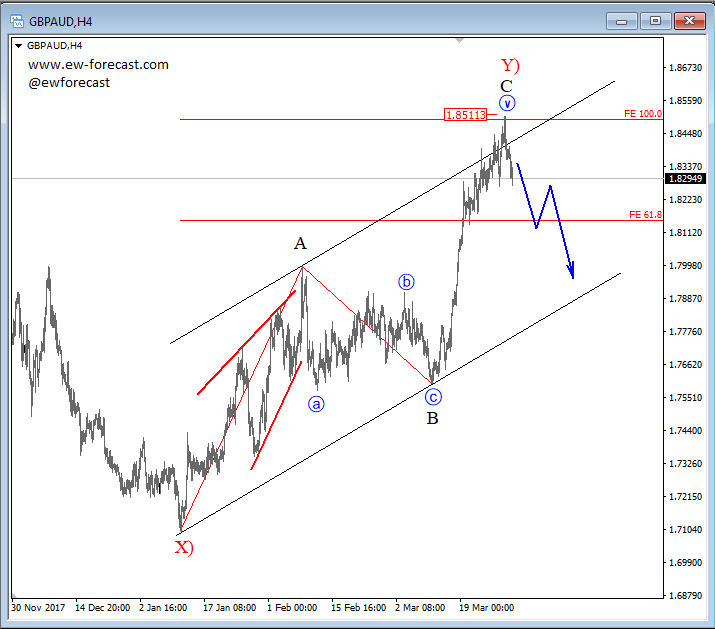
GBPAUD Can Be In For A Bearish Reversal; 1.8510 Can Offer A Top
Good day traders! Today's focus is on GBPAUD and its intra-day look.
GBPAUD made a clear impulsive rally at the start of March, labelled as sub-wave C of a bigger correction. That said, despite this recovery we see price trading at the end of a bigger complex correction, which means we can expect price to slowly turn lower from current levels. That said, we also see the Fibonacci ratio of 100.0 (Waves A and C equality level) reached, so maybe a new bearish turn in minimum three-wave can be around the corner.
GBPAUD, 4h
Pound Dips to 1-Week Low as US Jobless Claims Sparkle
The British pound has lost ground for a third straight day. In Thursday’s North American session, GBP/USD is trading at 1.4032, down 0.31% on the day. On the release front, Britain’s current account deficit narrowed to GBP 18.4 billion in the fourth quarter. British Final GDP remained unchanged at 0.4% in Q4. In the US, unemployment claims impressed, dropping to 215 thousand. This easily beat the estimate of 230 thousand. Consumer confidence also improved, as UoM Consumer Sentiment rose to 101.4, breaking past the 100-barrier for the first time since October. However, the indicator missed the estimate of 101.9 points.
Britain and the European Union recently agreed to a transition phase in the Brexit process, which is meant to cushion Britain’s departure from the club. In particular, the business sector will have to adapt to the new reality of post-Brexit. The British economy has performed better than most had expected, with the uncertainty over Britain’s departure from the European Union in March 2019. However, indicators released on Wednesday pointed to some glaring weaknesses in the British economy. The CBI Retail Sales survey has showed sales volumes softening in recent months, and this troubling trend continued in March, with a reading of -8 points. Consumer confidence is also waning, as GfK Consumer Confidence has posted consecutive declines since April 2016. Still, the British pound has enjoyed a solid March, with gains of 2.6% against the US dollar.
The US economy continues to expand at a brisk clip. Revised GDP for the third quarter came in at 2.9%, beating the estimate of 2.7%. This reading was revised upwards from the initial GDP estimate of 2.5%. Although fourth quarter growth was solid, it could not keep up with a superb third quarter, which posted a gain of 3.2%. As for 2018, first quarter growth is expected to soften to 1.8%, but there is still a strong chance that the economy could hit 3% growth this year, as promised by US President Trump. The catalysts for such a rosy prediction are the massive tax cut and higher government spending. Where does this leave the Federal Reserve, which raised interest rates last week? Currently, the Fed is projecting to more rate hikes this year, but if the economy remains strong and inflation levels move closer to the Fed target of 2%, we could see four rate increases in 2018.
Were Corporate Tax Cuts Evident in Fourth Quarter Profits?
The anticipation of tax-reform could have influenced fourth quarter profits. Tax reform will likely lead accelerated profit growth in the year ahead, even as pre-tax profit growth remains muted.
The Tricky Effects of Tax Cuts
The third release of fourth quarter GDP not only revised overall growth up to 2.9 percent from 2.5 percent, but also revealed the possible start of the effects of corporate tax reform on corporate profit growth. Pre-tax corporate profits decreased $1.1 billion in the fourth quarter, compared to an increase of $90.2 billion in the third quarter. However, taxes paid on corporate income decreased roughly $30 billion over the quarter, resulting in continued growth in after-tax corporate profits.
The slight slowdown in pre-tax profit growth is consistent with what we would expect to see at this late stage of the current expansion. However, were corporate tax cuts evident in fourth quarter profits? The newly enacted 2017 Tax Cuts and Jobs Act (which went into effect on January 1, 2018) cut the top statutory corporate tax rate to 21 percent from 35 percent, while revising several corporate deductions and exclusions. In anticipation of tax cuts, it is possible that firms delayed the realization of profits until the first quarter. However, although changes to the expensing of bonus depreciation and the one-time repatriation tax went into effect in the fourth quarter, such revisions do not alter the National Income and Production Accounts (NIPA) measure of corporate profits (which are defined as profits from current production). We do highlight that the statutory corporate tax rate (Q4 = 35 percent) differs significantly from the effective corporate tax rate (Q4 = 20 percent), or the rate a corporation actually faces after accounting for available deductions and exclusions present in the tax code.
We anticipate as the newly enacted tax rate drives the effective rate lower, it will directly boost after tax profit growth in the year ahead. The effects of the remaining tax modifications (deductions and exclusions) will likely alter profit growth for individual firms; however, due to calculation methods, such modifications will not show up in the NIPA measure of corporate profits.
Nonfinancial Domestic Profits likely to Continue to Lead Growth
For the fourth quarter, domestic profits rose $4.8 billion, while foreign profits fell $5.9 billion. As domestic profits encompass roughly 80 percent of total profits, we emphasize the increase in Q4. Led by nonfinancial corporate profits, (which accelerated $19.4 billion) domestic profits appear well positioned to possibly surpass their previous peak seen in the current expansion. Profits in the financial sector, however, decreased $14.6 billion.
For the year as a whole, corporate profits rose $91.2 billion. While we predict the lower statutory corporate tax rate will modestly boost after-tax corporate profit growth in 2018, we continue to expect trend-like growth for our current forecast horizon. On average over the past five years, productivity rose only 0.8 percent per year, while unit labor costs have increased 1.3 percent. With low productivity and increasing labor costs, coupled with the rising interest rate environment that exists today, fundamentals alone do not appear supportive of a continued acceleration in profit growth.
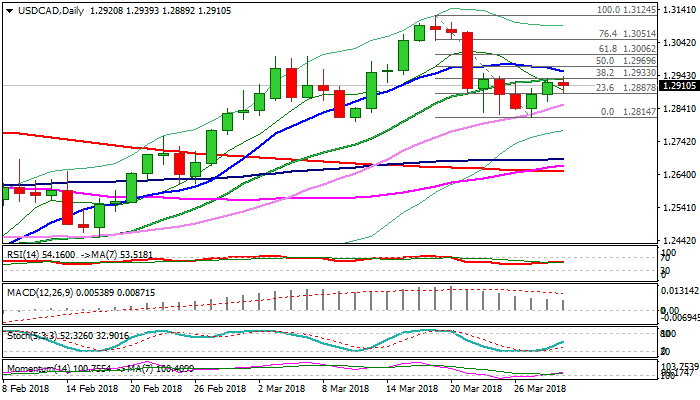
USDCAD – 20SMA Continues to Cap Recovery Despite Strong US and Downbeat Canadian Data
The pair showed limited reaction on better than expected US weekly jobless claims (215K vs 230K f/c) and downbeat Canadian GDP data (m/m Jan GDP -0.1% vs 0.1% f/c and annualized -0.3% vs 2.9% f/c). Extension of recovery rally from 1.2814 (low of pullback from 1.3124), stays capped by 20SMA / Fibo 38.2% of 1.3124/1.2814 for the second day, despite bullishly aligned daily studies. Moving averages (10/20/30) are in mixed setup but bullish momentum is building. Repeated rejection under 20SMA would be initial negative signal, which requires confirmation on return below rising 30SMA (1.2852) for retest of key n/t support at 1.2814 (Tuesday's low). Bullish scenario needs close above 20SMA and extension above 10SMA (1.2952) to signal further retracement of 1.3124/1.2814 pullback.
Res: 1.2933; 1.2952; 1.2970; 1.3000
Sup: 1.2887; 1.2852; 1.2814; 1.2792