
Sample Category Title
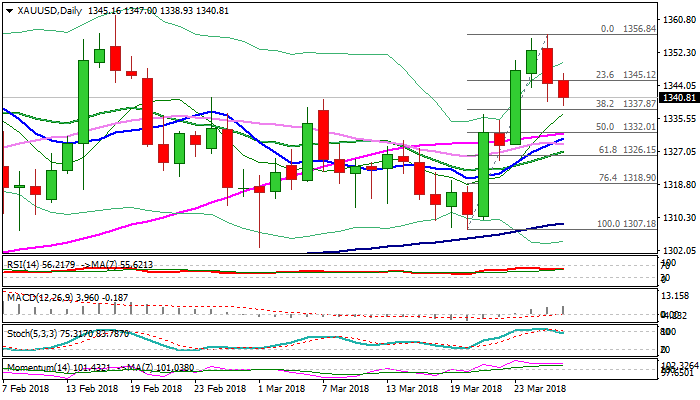
Spot Gold – Bearish Outside Day Was Negative Signal, Extension Of Pullback Pressures Daily Cloud Top
Spot Gold remains at the back foot on Wednesday and extended pullback from six-week high at $1356, pressuring strong supports at $1337/36 zone (top of thick daily cloud / Fibo 38.2% of $1307/$1356 rally).
Tuesday’s close in red which formed bearish Outside Day weighs, with slow stochastic emerging from overbought territory, adding on pressure for possible deeper correction.
Close below $1337/36 pivots is needed to generate bearish signal for extended pullback.
Plethora of daily MA supports in $1331/27 zone marks next strong support which is expected to contain extended dips and keep larger bulls in play.
Release of US GDP data today is eyed for fresh direction signals.
Res: 1345, 1347, 1350, 1356
Sup: 1336, 1331, 1327, 1325
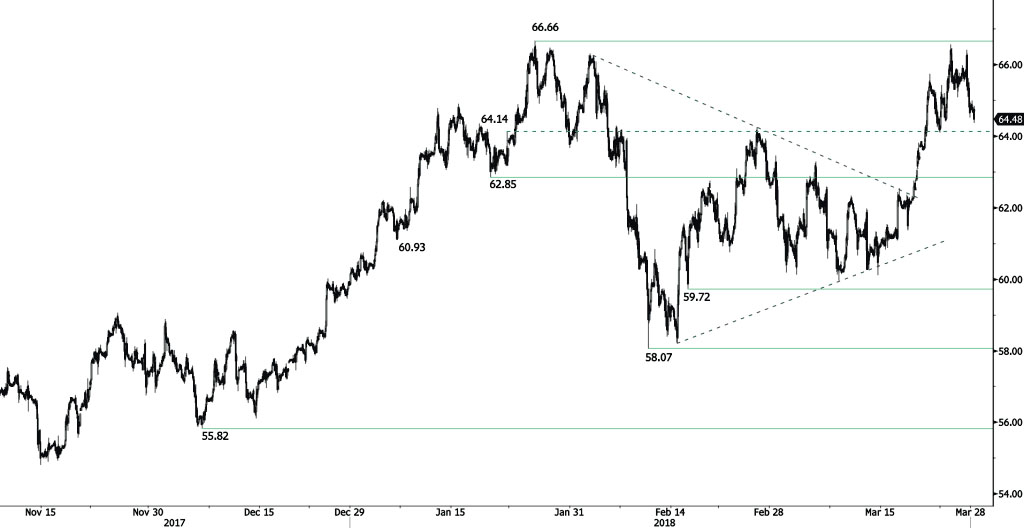
CRUDE OIL Bearish Breakout
Crude oil is starting a strong declining phase after reaching 66.41 high and heading along the 64.16 range. Silver is currently contained between hourly support and resistance at 62.85 (19/01/2018 low) and 66.66 (25/01/2018 high). The technical structure suggests short-term downward moves.
In the long-term, crude oil has recovered after its sharp decline last year. However, we consider that further weakness is very likely. For the time being, the pair lies in an upside trend since June 2017. Support lies at 42.20 (16/11/2016) while resistance is located at 77.83 (20/11/2014). Crude oil is trading largely above its 200 DMA.
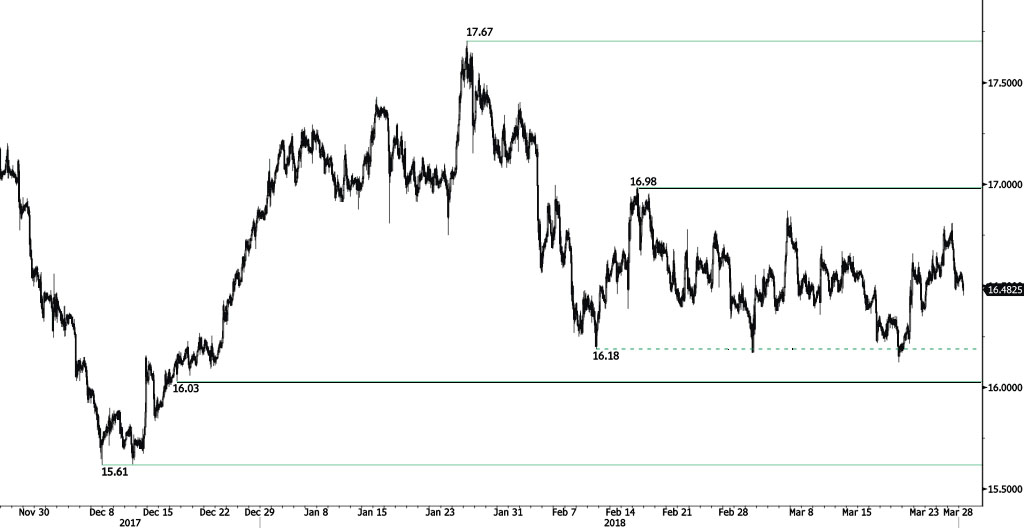
SILVER Trading Below 16.50
Silver selling pressures continue after trading at 16.80, heading along the 16.47 range. Silver is currently contained between hourly support and resistance given at 16.03 (18/12/2017 low) and 16.98 (15/02/2018 high). The short-term technical structure suggests decreasing moves.
In the long-term, the trend remains negative/ sideways. Further downside is very likely. The pair is trading below its 200 DMA. Resistance is located at 21.58 (10/07/2014 high). Strong support can be found at 11.75 (20/04/2009).
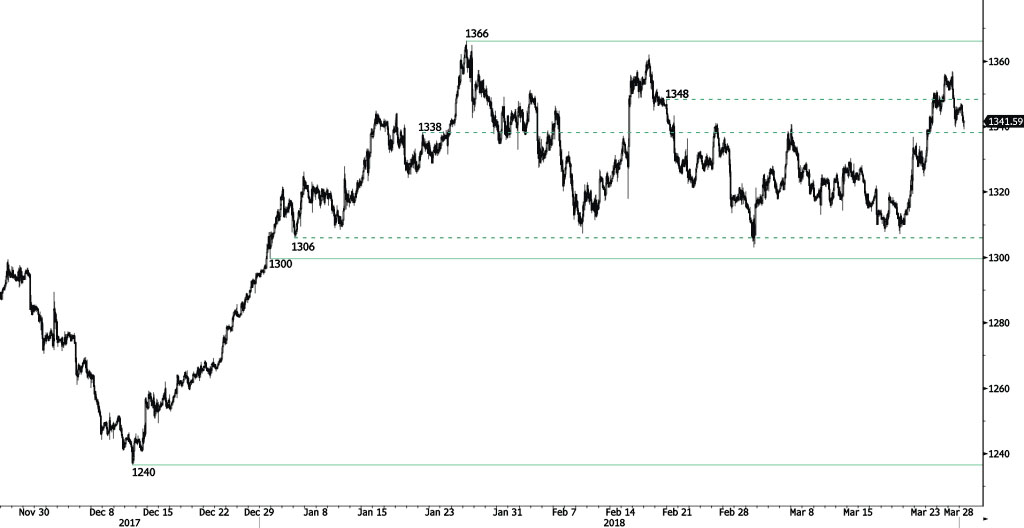
GOLD Heading Lower
Gold is decreasing following recent rise at 1347, heading along the 1339 range. Hourly support and resistance are given at 1300 (29/12/2017 low) and 1366 (25/01/2018 high). The technical structure suggests short-term downward moves.
In the long-term, the technical structure suggests that there is a growing upside momentum. A break of 1'392 (17/03/2014) is required to confirm it. A major support can be found at 1'045 (05/02/2010 low).
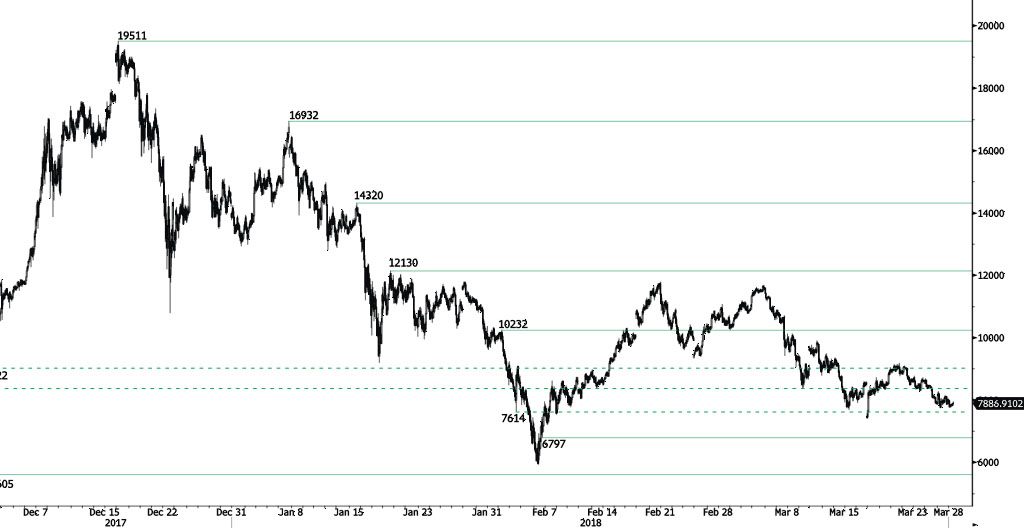
BITCOIN Bearish Consolidation Continues
Bitcoin bearish sideways consolidation phase continues, trading along 7900 and expected to decline further below 7770. The pair is contained between hourly support and resistance given at 6797 (06/02/2018 low) and 10232 (01/02/2018 high). The technical structure suggests further short-term sideways trading moves.
In the long-term, the digital currency has had an exponential growth but also presented important downturns. There is decent likelihood that the currency could stabilize between 7'000 - 12'000 in 2018. Bitcoin is approaching its 200 DMA (7500 range).
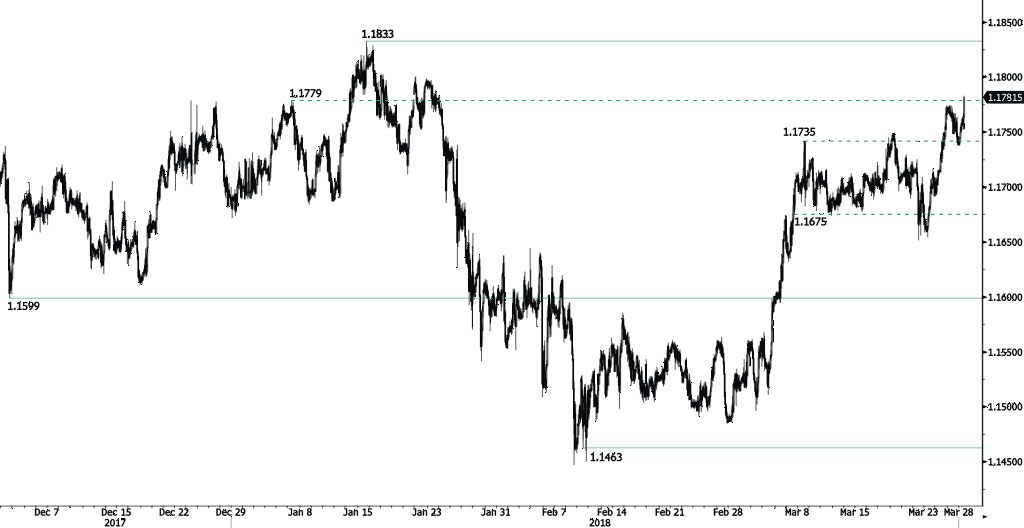
EUR/CHF Declining After Breaking Resistance At 1.1779
EUR/CHF is starting a consolidation phase after breaking hourly resistance at 1.1779 ((05/01/2018 high). The pair is heading lower along the 1.1758 range. Hourly support and resistance are now given at 1.1599 (01/12/2017 low) and 1.1833 (15/01/2018 high). The shortterm technical structure suggests short-term decrease.
In the longer term, the technical structure has reversed. Strong resistance is given at 1.20 (level before the unpeg). Yet, the ECB's slowing QE program is likely to cause buying pressures on the euro, which should weigh in favour of the EUR/CHF. Support can be found at 1.0234 (20/04/2015 low).
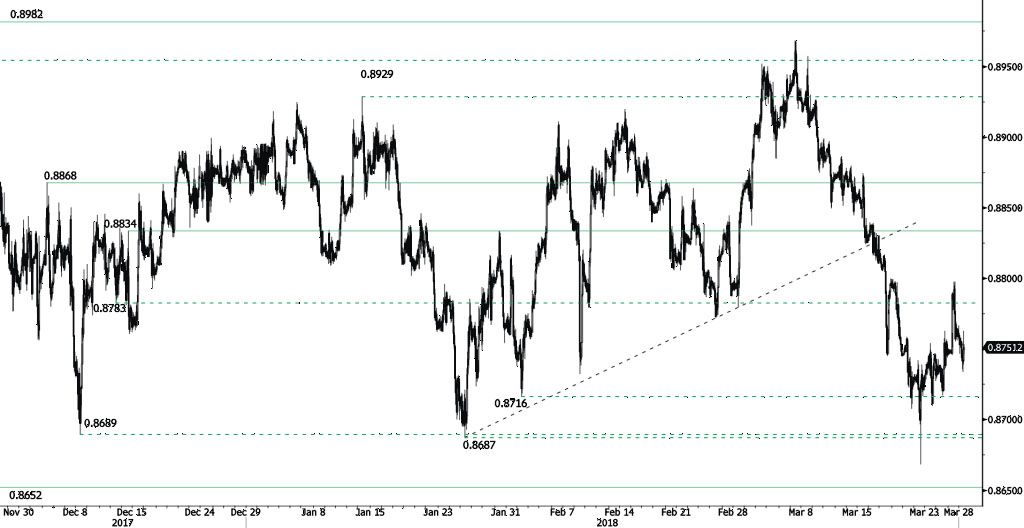
EUR/GBP Trying To Bounce
EUR/GBP is bouncing up from 0.8734 low, approaching the 0.8765 range. Hourly support and resistance are given at 0.8652 (17/11/2017 low) and 0.8834 (14/12/2017 high). The technical structure suggests short-term rise.
In the long-term, the pair has largely recovered from 2015 lows. The technical structure suggests further upside pressure. Strong resistance can be found at 0.9500 (psychological level) while support remains at 0.8304 (05/12/2016 low). The pair is trading below its 200 DMA.
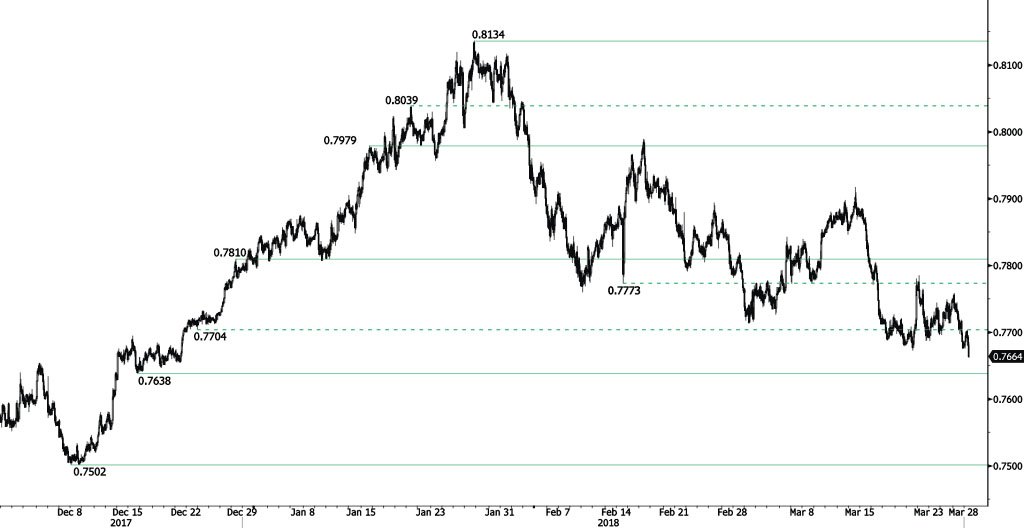
AUD/USD Approaching Support At 0.7638
AUD/USD is declining further, currently trading at 0.7660 and heading along the 0.7650 range. Hourly support and resistance are given at 0.7638 (15/12/2017 low) and 0.7810 (28/12/2017 high). The technical structure suggests further short-term downward moves.
In the long-term, the upward trend slows down after failing to reach key resistance at 0.8164 (14/05/2015 low). Key support stands at 0.6009 (31/10/2008 low). A break of the key resistance at 0.8164 (14/05/2015 high) is needed to invalidate our long-term bearish view.
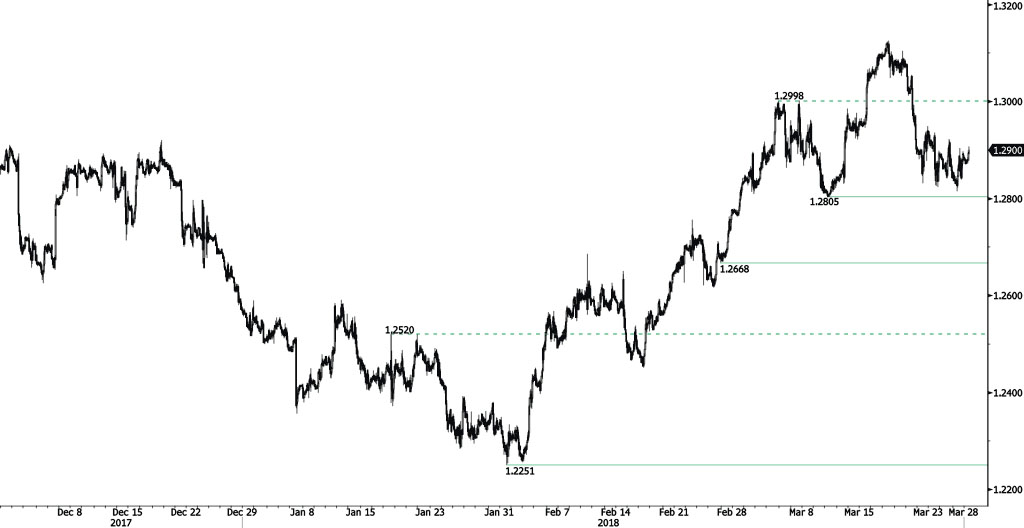
USD/CAD Edging Lower
USD/CAD is declining following recent rise at 1.2907, heading along the 1.2870 range. Hourly support and resistance remain at 1.2805 (12/03/2018 low) and 1.3308 (23/06/2017 high). The short-term technical structure suggests short-term decrease.
In the longer term, the pair is trading between resistance point at 1.3805 (05/05/2017 high) and support at 1.2128 (18/06/2015 low). Strong resistance is given at 1.4690 (22/01/2016 high). The pair is likely to head lower. The pairs is trading above its 200 DMA.
USD/CHF Decreasing Below 0.95
USD/CHF consolidation phase continues, currently trading at 0.9490 and expected to decrease along the 0.9460 range. The pair is contained between hourly support and resistance given at 0.9296 (05/02/2018 low) and 0.9668 (17/01/2018 high). The technical structure suggests further short-term downward moves.
In the long-term, the pair is still trading in range since 2011 despite some turmoil when the SNB unpegged the CHF. Key support lies at 0.9072 (07/05/2015 low) while resistance at 1.0344 (15/12/2016 high) is distanced. The technical structure favours a long term bullish bias since the unpeg in January 2015.
