Sample Category Title
GBPUSD Intraday Analysis
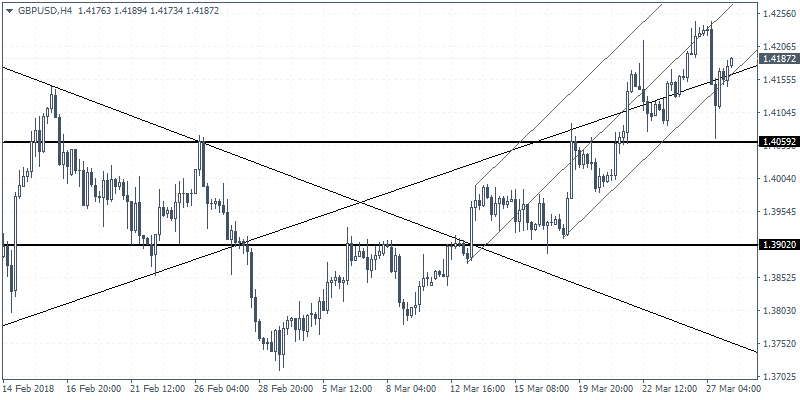
GBPUSD (1.4187): The British pound was seen giving up some of the gains made from Monday. Price action remained somewhat weaker ahead of the final revised GDP data due to come out tomorrow. On the 4-hour chart, price slipped below 1.4162 and following a brief retest of this level, GBPUSD was seen easing lower. A continued decline off this level could keep GBPUSD biased to the downside, targeting the 1.40 round number support. To the upside, GBPUSD will need to close with strong gains above 1.4162 to maintain the bullish trend.
EURUSD Intraday Analysis
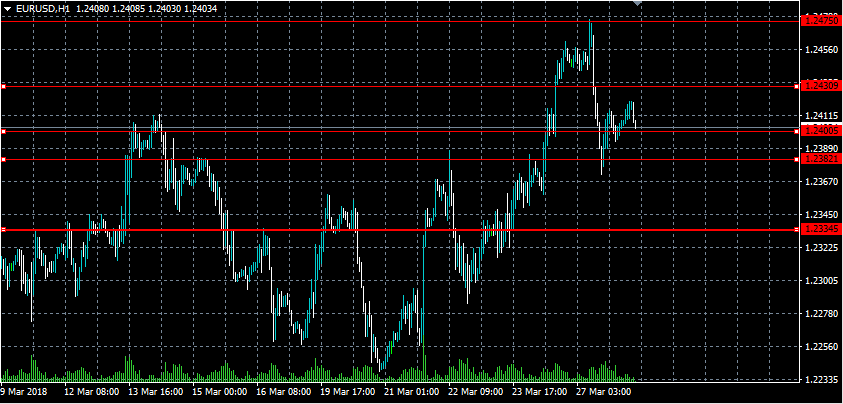
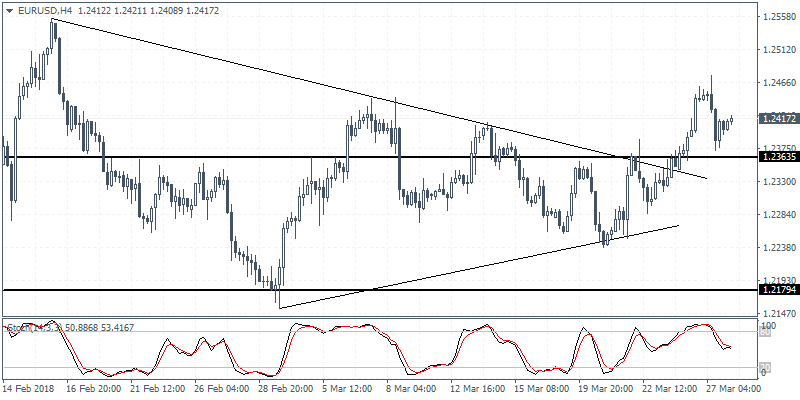
EURUSD (1.2417): The euro currency was seen briefly posting a fresh monthly high at 1.2476 on the day before giving up most of the gains. Price action was bearish following the strong gains from Monday. On the 4-hour chart, price action was seen drifting back to the breached resistance level at 1.2363. A retest of this level could confirm the support that could keep the EURUSD biased to the upside. However, with momentum easing, there is scope for the EURUSD to slip back below this level in the medium term and could enter back into the range that it maintained.
USD Rebounds Off Monthly Lows, Q4 2017 GDP Expected To Be Revised Higher
The U.S. dollar was seen attempting to post a modest rebound on the day on Tuesday. The U.S. dollar index pulled back from the fresh monthly lows posted earlier on Monday. Economic data was sparse but the Richmond Fed manufacturing index report showed a decline in activity.
The Richmond Fed manufacturing index rose at a slower pace in March with new orders and employment indexes falling. The composite index slipped to 15, down from 28 in February. However, most of the firms surveyed were optimistic over the next six months.
The Conference Board's consumer confidence index was also coming out weaker in March after rising to an 18-month high in February. For March, the consumer confidence index fell to 127.7 compared to 130.0 in February.
Data from the Eurozone covered the flash inflation estimates for Spain. Consumer prices were seen rising at a slower pace of 1.2% on the year ending March which was weaker than the estimates of 1.5%.
For the day ahead, the economic calendar will see the release of the housing price index from Nationwide for the UK. In the NY trading session, the final revised GDP for the fourth quarter of 2017 is forecast to show a revised print of 2.7%, slightly accelerating from 2.5% previously reported in the second estimate. Pending home sales data is expected to show a modest recovery, rising 0.5 million and reversing part of the declines from the previous month.
GBP/JPY Possible Inverted Dead Cat Bounce On A Trend Line Break
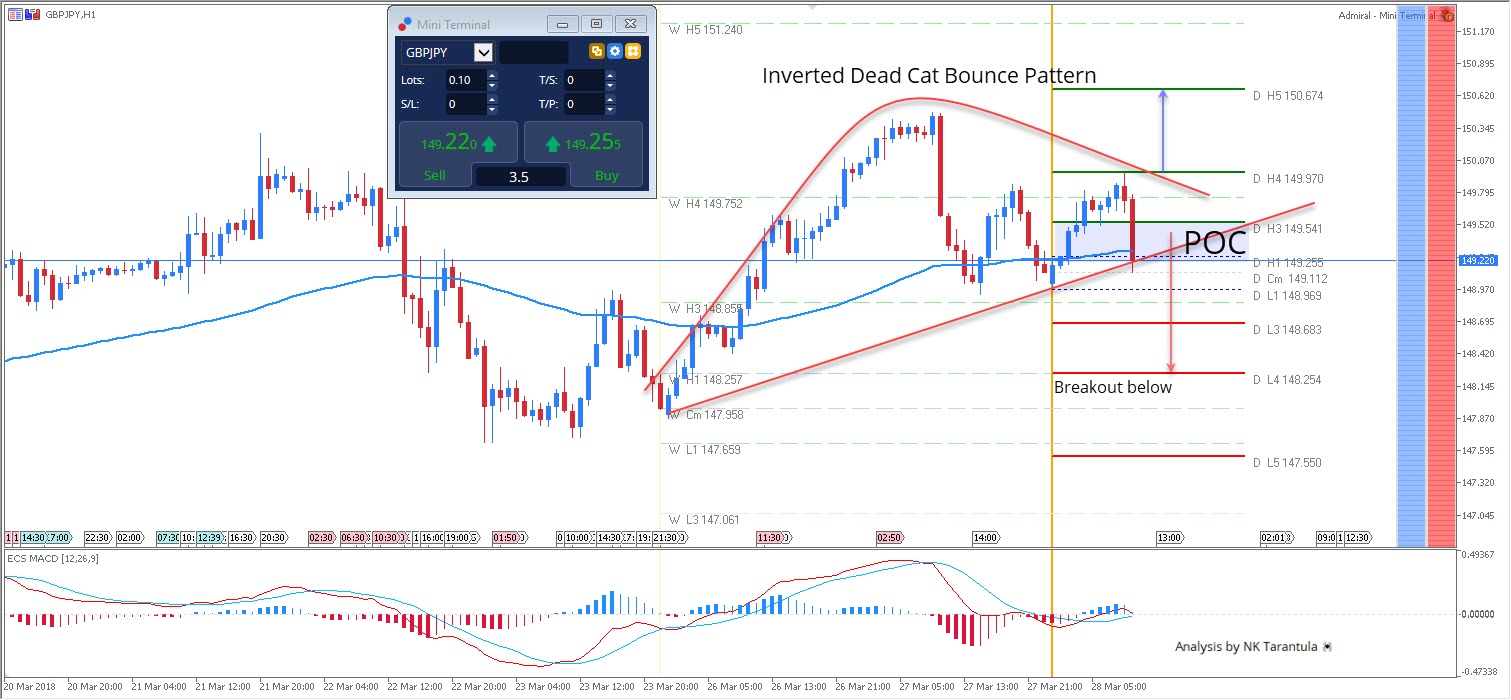
After a typical Monday price action that was triggered by the Yen weakness the GBP/JPY continued to rise but it failed to reach W H5. A sudden drop in price and a close below EMA89 and W H4, with an interim consolidation suggests that this could be an inverted dead cat bounce pattern. POC rejections could happen within 149.25-55 zone. If the price closes below the trend line we could see a move towards 148.68 and 148.25 so the pattern will be validated. Target is 148.25. However, if the price spikes above 149.97 we might see 150.67 and the pattern will become invalid.
W H3 - Weekly Camarilla Pivot (Weekly Interim Resistance)
W H4 - Weekly Camarilla Pivot (Strong Weekly Resistance)
D H4 - Daily Camarilla Pivot (Very Strong Daily Resistance)
D L3 – Daily Camarilla Pivot (Daily Support)
D L4 – Daily H4 Camarilla (Very Strong Daily Support)
POC - Point Of Confluence (The zone where we expect price to react aka entry zone)
Forex Analysis: Risk-Off Returns To Erase Monday’s Rally
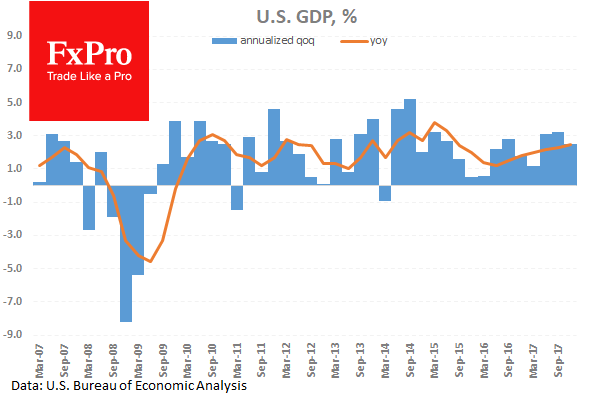
US GDP will be released later today, with analysts waiting to see if the figure confirms the strength seen over the last two quarters. The expectation is for an increase but looking over the trend longer-term shows that the US economy has been ticking along above 2% since the financial crisis.
The recent risk-off mood returned yesterday, as worries about Trade resurfaced. Stocks were hammered lower, erasing all of Monday's gains, led by Tech, as a recent crash of a self-driving car in California is being investigated. USDJPY was hit hard, selling off from a high of 105.896 to 105.320 but recovering to 105.600 on news that North Korean Leader Kim Jong Un was in China, signalling an easing in tensions in the region. GBPUSD is higher from yesterday's low of 104.656 after London signalled that they would contact the EU with a new solution to avoiding a hard border on the island of Ireland.
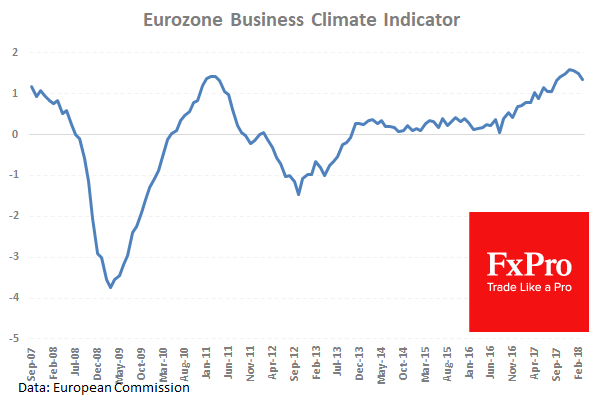
Business Climate (Mar) was released by the European Commission, coming in at 1.34 against the market consensus of 1.39, from 1.48 previously. This is based on monthly surveys and is designed to deliver a clear and timely assessment of the cyclical situation within the euro area. It may be interpreted as a survey result: a high reading indicates that, overall, the surveys point to a healthy cyclical situation. Conversely, a low reading points to an adverse business climate. Its movement is clearly linked to industrial production in the euro area and, as such, it is showing that after reaching a peak at 1.66 in December, the Business Climate has turned lower in 2018, albeit from a high level. EURUSD fell from 1.24304 to 1.24090 after this data was published.
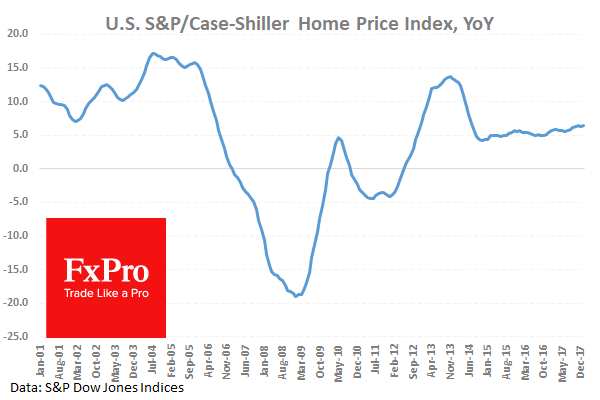
S&P/Case-Shiller Home Price Indices (YoY) (Jan)was released by Standard & Poor and came in at 6.4%, beating market expectations of 6.2%, from a previous value of 6.3%. This data point examines changes in the value of the residential real estate market in 20 regions across the US. This report serves as an indicator for the health of the US housing market. This data shows a continuation of the linear rise in house prices since late 2014. This appears to show a stable growing market, with very little variation from expected levels. EURUSD fell from 1.23905 to 1.23772 following this release.
API Weekly Crude Oil Stocks was released, showing a much bigger than expected build in Crude Oil Stocks of 5.321M, against an expected 0.400M, from -2.739M previously. API's Weekly Statistical Bulletin (WSB) reports total U.S. and regional data relating to refinery operations and the production of the four major petroleum products: motor gasoline, kerosene jet fuel, distillate and residual fuel oil. These products represent more than 85% of the total petroleum industry. Published numbers normally impact volatility in WTI Crude futures and are closely watched by energy commodities traders. The WTI price sold off because of this data, declining from $65.19 to $64.64.
EURUSD is up 0.05% overnight, trading around 1.24081.
USDJPY is up 0.24% in early session trading at around 105.580.
GBPUSD is up 0.24% this morning, trading around 1.41919.
USDCAD is unchanged in early trade at around 1.28805.
Gold is down -0.19% in early morning trading at around $1,342.10.
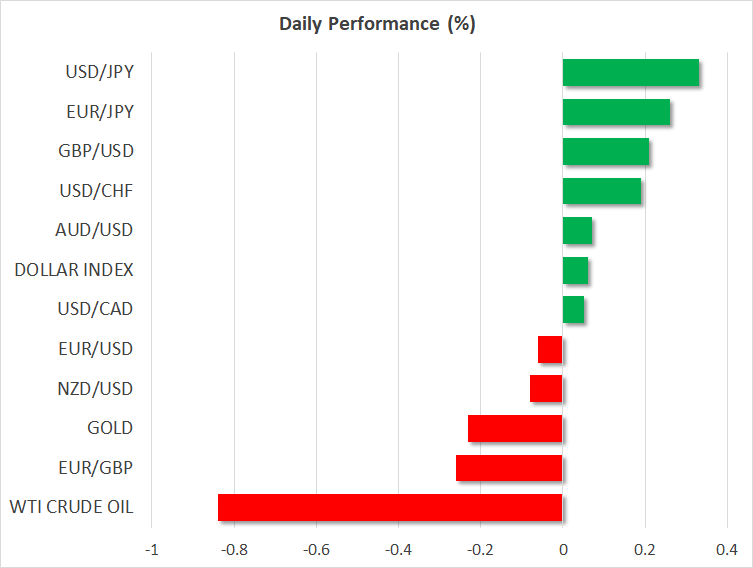
WTI is down -0.86% this morning, trading around $64.69.
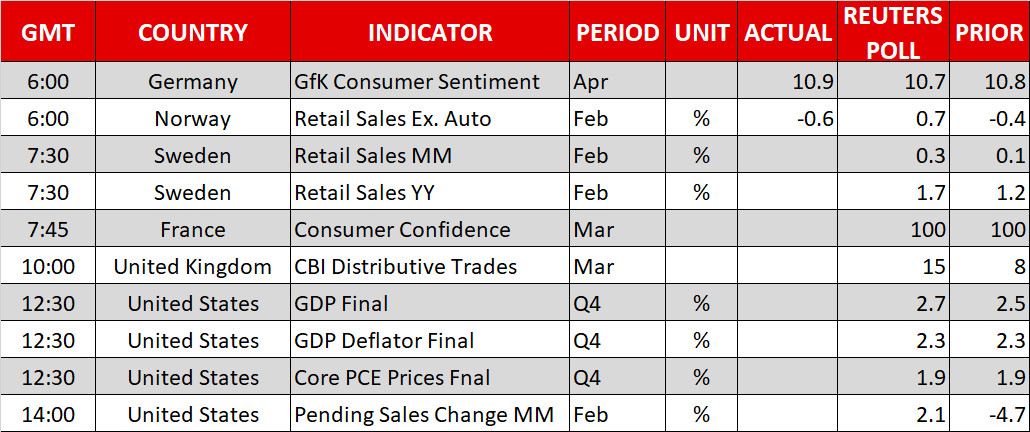
US Gross Domestic Product Expected To Beat Consensus
At 13:30 GMT, US Gross Domestic Product Annualized (Q4) data will be out, with the headline number expected to be 2.7%, from a previous 2.5%. Gross Domestic Product Price Index (Q4) data is expected to remain unchanged at 2.3%. Also at this time, Core Personal Consumption Expenditures (QoQ) (Q4) is expected to be unchanged from the Q3 reading at 1.9%. Personal Consumption Expenditure Prices (QoQ) (Q4) is also expected to be unchanged at 2.7%. USD crosses may see moves, as traders take Dollar positions in reaction to the numbers released.
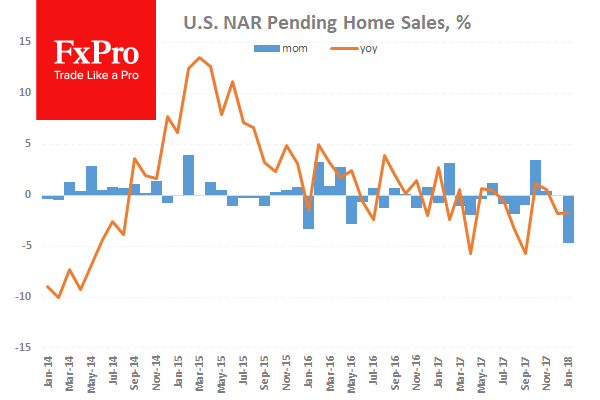
At 15:00 GMT, Pending Home Sales (YoY) (Feb) is expected to be -0.2% against a prior reading of -1.7%. Pending Home Sales (MoM) (Feb) is expected to be 2.1% against a prior reading of -4.7%. These data points are expected to rebound after declining to -4.7% last month, the lowest level in four years. The New Year is usually the worst time for US home sales, with a strong rebound taking place in February. USD pairs could move due to this data release.
At 18:30 GMT, FOMC Member Bostic is due to speak at the Atlanta Society of Finance and Investment Professionals luncheon. Comments may result in moves in USD crosses.
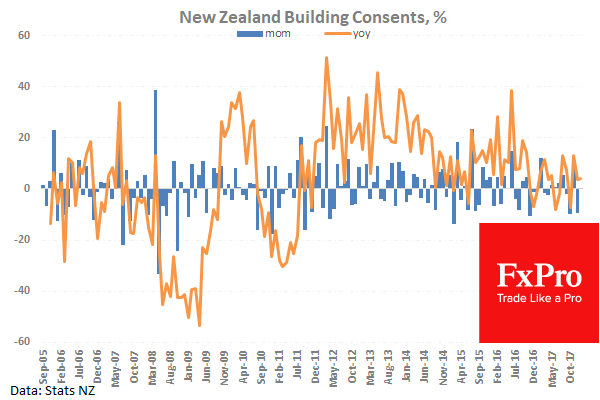
At 21:45 GMT, New Zealand Building Permits s.a. (MoM) (Feb) will be released, with a prior reading of 0.2%. This data series can be quite volatile, having swung between 20 and -10 over the last six years. The November reading was 10.8%, while December was -9.6%. NZD crosses may experience volatility during this time.
Dollar Flat With Trade Considerations Remaining In The Spotlight, US Releases Updated Q4 GDP Figures
Here are the latest developments in global markets:
FOREX: The dollar was flat relative to a basket of currencies on Wednesday after adding 0.3% the previous day. Developments on trade were once again on the forefront and are likely to determine the short-term direction in the currency markets.
STOCKS: US markets closed significantly lower on Tuesday, dragged predominantly by technology stocks. Declines in Facebook and Nvidia, as well as news that the US is considering restricting Chinese investments in US technology companies may have contributed to the broader risk aversion. The tech-heavy Nasdaq Composite led the way lower, plunging by 2.9%, while the S&P 500 and the Dow Jones fell by 1.7% and 1.4% respectively. Futures tracking the S&P, Dow, and Nasdaq 100 are all currently close to neutral territory. As is often the case, the souring in risk appetite spilled over to Asia, which was a sea of red today. Japan’s Nikkei 225 and Topix indices declined by 1.3% and 1.0% correspondingly, while in Hong Kong, the Hang Seng fell by 1.6%. In Europe, while most indices closed higher yesterday, futures tracking all of the major benchmarks are currently flashing red, pointing to a lower open today.
COMMODITIES: Oil prices fell as well, on the back of the broader decline in equity markets, and the API crude inventory report showing a much larger-than-anticipated build in stockpiles. WTI crude fell by 0.8%, while Brent traded 0.7% lower. Today, markets will turn their focus to the official EIA inventory data, due out at 1430 GMT. In precious metals, gold is 0.2% lower, with the safe-haven perceived asset seemingly unable to draw support from the uncertainties over global trade. The recovery in the US dollar yesterday probably hurt demand for the dollar-denominated yellow metal, which tends to decline when the greenback strengthens.
Major movers: Dollar continues to distance itself from 16-month low vs yen
The dollar index was flat at 89.36 at 0630 GMT. This compares to a low of 88.94 hit yesterday, the lowest for the measure since February 16. Trade tensions remain in focus, with a US-German “alliance” against China being possibly on the table. This comes after easing concerns the previous day on the back of reports that the US and China are willing to enter into discussions on trade issues, deviating from the inflammatory rhetoric from previous days.
Despite attention being firmly on trade issues, updated GDP figures out of the US later today might also spur some movements, especially in the absence of other data. The US currency edged higher versus the yen, for dollar/yen to continue distancing itself from the 16-month low of 104.55 hit on Monday. The pair was trading 0.35% higher, at 105.70.
The improving geopolitical situation in the Korean peninsula is perhaps a factor that’s diverting funds out of the safe-haven perceived yen. China confirmed earlier on Wednesday that North Korea’s Kim Jong Un met with his Chinese counterpart Xi Jinping on a surprise visit to Beijing, this being his first such visit since taking power in 2011 and is a move that is seen as easing tensions in the region.
Euro/dollar was marginally lower around the 1.24 handle after losing 0.3% on Tuesday to retreat from a near six-week high of 1.2476. Catalysts for the common currency’s decline were weaker than anticipated data, including on business confidence, as well as some dovish-interpreted remarks from ECB Governing Council member Erkki Liikanen, who cautioned against premature tightening by the European Central Bank.
Sterling was 0.2% higher against the greenback at 1.4181, after falling 0.5% the previous day. Today’s gain came on the back of a report making reference to plans on avoiding a post-Brexit hard border with Ireland.
The aussie and the kiwi were not much changed versus their US counterpart after experiencing declines the previous day; the Australian currency’s losses brought it within breathing distance of the three-month low of 0.7765 recorded last week. The sell-off in Wall Street overnight dampened risk appetite, as well as sentiment for the two currencies which tend to gain in a risk-on environment. Meanwhile, data earlier on Wednesday showed New Zealand business sentiment declining in March, despite companies’ outlooks for their own activity being more upbeat.
Day ahead: Updates on global trade and Brexit likely to dominate quiet calendar day
In the UK, the Bank of England (BoE) will release its survey of economic agents for Q1 at 0830 GMT, which reports on economic conditions in the UK based on conversations with over 700 businesses. This could provide some insights regarding wage pressures and investments in the UK economy ahead of actual data. A BoE rate hike in May is already priced in by 60% according to the UK overnight index swaps. In case this survey enhances expectations for such an action – for instance by showing signs of wage growth accelerating – then the British pound could extend its recent gains.
In Brexit news, UK press is reporting that the government is set to unveil new plans on how to avoid a “hard” Irish border, which has been one of the main hurdles in negotiations with the EU. Should the UK indeed present a practical solution, that would be another factor arguing for a stronger pound in the near-term, as the Brexit risk premium would probably decline on expectations of a comprehensive deal finally being reached.
In terms of economic data, the most noteworthy release today will be the final estimate of US GDP for Q4, due out at 1230 GMT. The final figure is anticipated to be revised higher to a 2.7% annualized pace, from 2.5% in the second estimate. Pending home sales for February are also due for release at 1400 GMT, and the forecast is for a rebound from the previous month.
In energy markets, the weekly EIA crude inventory data at 1430 GMT will be closely watched for a fresh indication of the state of US production and demand. Besides these data, traders will also keep their eyes on movements in the US dollar, how risk sentiment evolves, and any updates on whether Iran will face new sanctions.
In equities, price action will likely continue to be driven by incoming headlines around trade. In such an unpredictable environment, technical indicators could be particularly useful in determining the next directional wave. In this respect, note that the S&P 500 and the Dow Jones are both hovering near their respective 200-day moving averages and it will be critical to see whether they rebound from there, or break lower. Also of interest will be Facebook CEO Mark Zuckerberg’s hearing before a House committee in the aftermath of the privacy scandal involving the social-media giant. Moreover, we are approaching the end of the month as well as the quarter, and most European nations’ markets will stay closed on Friday. The Japanese fiscal year ends on Friday too, so many markets moves over the next days could be owed largely to flows, not fresh fundamental catalysts.
As for notable speakers, we will hear from Atlanta Fed President Raphael Bostic (voter) at 1530 GMT.
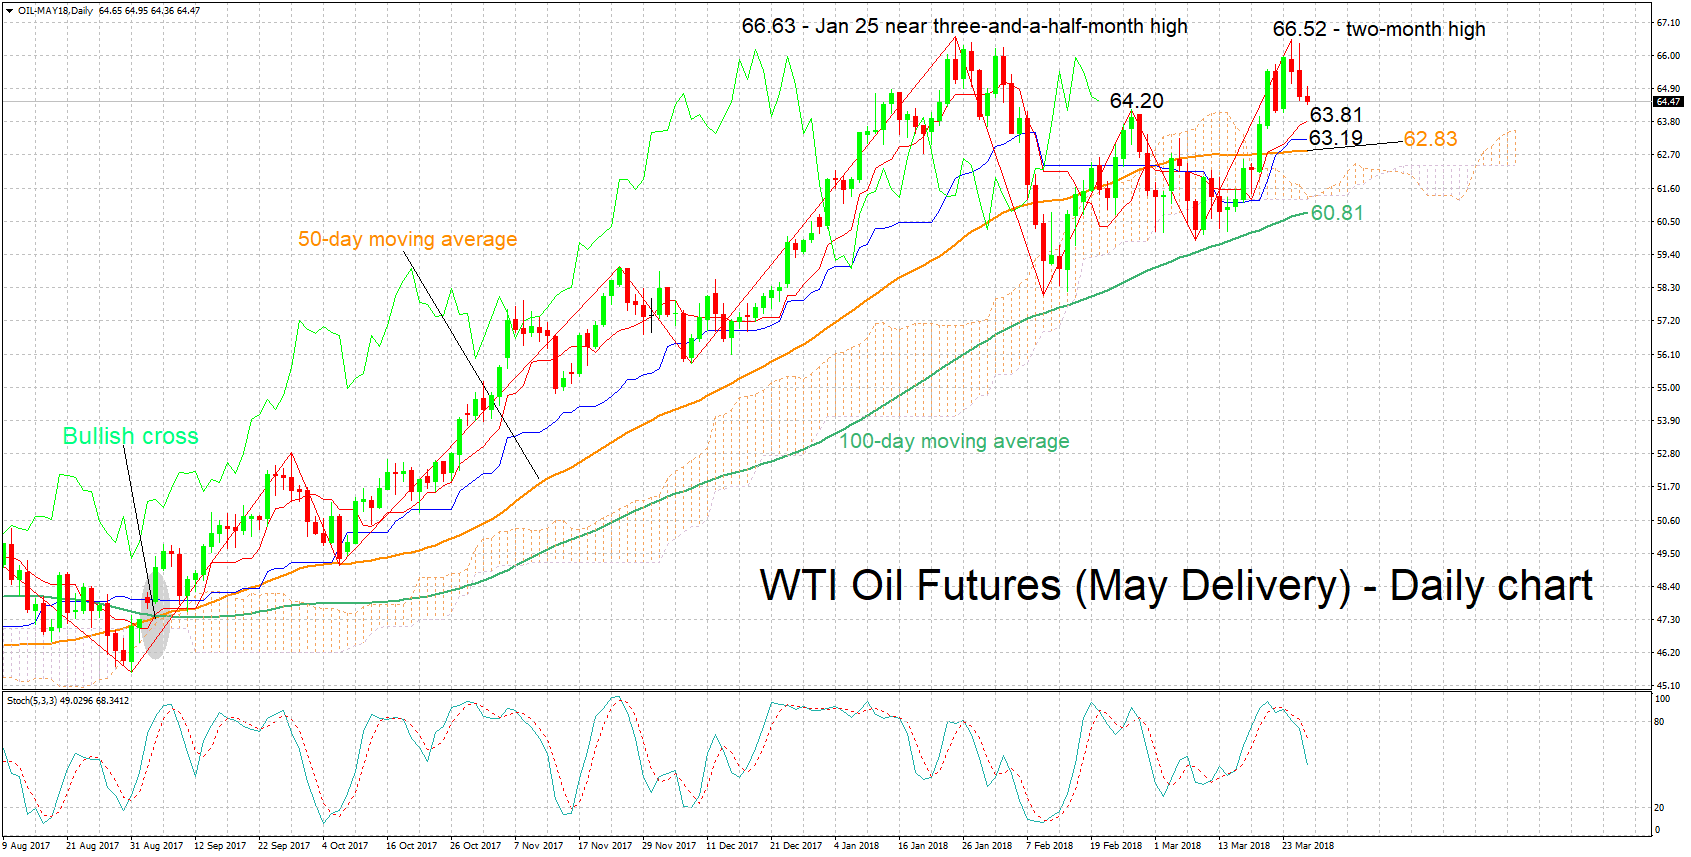
Technical Analysis: WTI oil futures retreat from 2-month high; EIA report to offer direction
WTI oil futures for May delivery have advanced considerably over the last couple of weeks, eventually reaching a two-month high of 66.52 on Monday, challenging the near three-and-a-half-year high of 66.63 recorded in late January. However, the price has since retreated from that high. The Tenkan- and Kijun-sen lines remain positively aligned though the flat Kijun-sen is an indication that bullish momentum has lost steam. Moreover, the stochastics are giving a bearish signal in the very short-term: the %K line has crossed below the slow %D one and both lines are moving lower.
If the Energy Information Administration’s weekly report shows a smaller-than-anticipated increase in US crude oil inventories – or a drawdown of course – prices could be supported. Resistance in this case might come around Monday’s two-month high of 66.52, with the area around this peak also including the near three-and-a-half-year high of 66.63 from January 25.
Should, on the other hand, crude stocks increase by more than expected, then prices could post losses. In this scenario, the range around the current level of the Tenkan-sen at 63.81 could act as support. The area around this point also includes the Kijun-sen at 63.19 and a previous peak at 64.20, while it was congested in the recent past as well. Numerous potential key points in case of a downside violation lie not far below: the current level of the 50-day moving average (62.83), the Ichimoku cloud top (61.33) and bottom (61.21), and the 100-day MA (60.81).
AUDUSD Holds At 3-Month Lows, Bearish In Short And Medium-Term
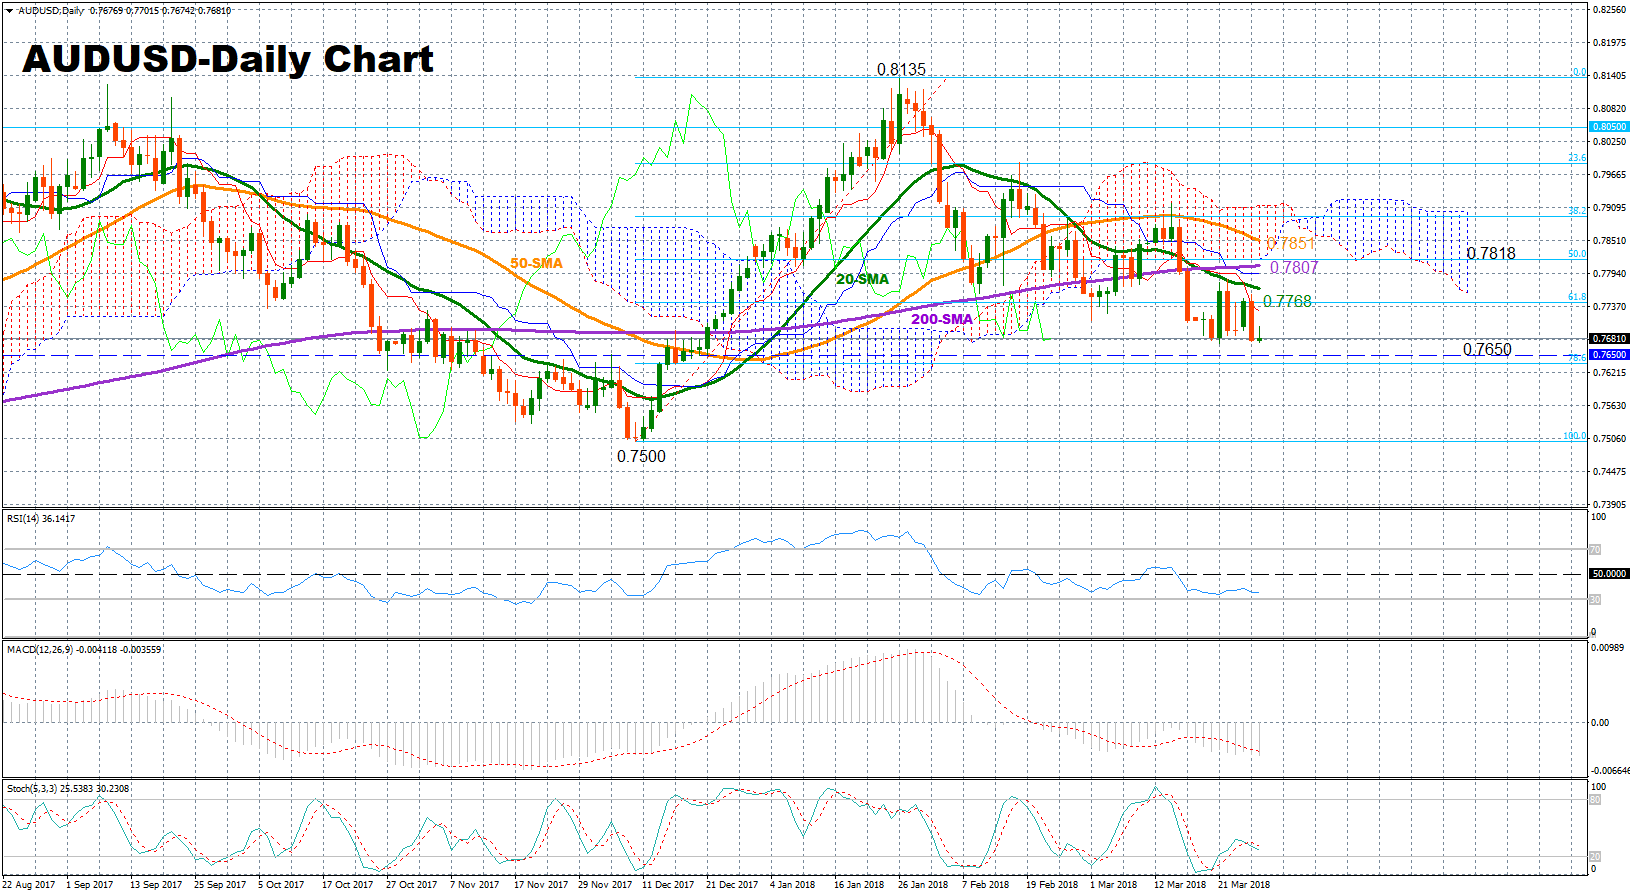
AUDUSD has been making lower highs and lower lows since the end of January when it touched a more than a 2 ½ -year high of 0.8135, pausing this downtrend at 3-month lows over the past week. The technical indicators, though, continue to send bearish signals, suggesting that the softness in the market is not over yet.
The RSI has flattened near oversold levels, slightly above 30 indicating that the market could weaken a little bit in the short-term until the index falls below that threshold. Stochastics are not yet in oversold territory either, with the indicators moving downwards and are negatively aligned, while the MACD supports a bearish picture as well, since the index continues to increase negative momentum below its red-signal line. Ichimoku indicators also raise bearish flags as the red Tenkan-sen line is below the blue Kijun-sen line and is currently pointing to the downside.
Should prices decline, immediate support could be found around 0.7650, an area which has provided both resistance and support from October to December. Then a leg below that level, the pair could meet the 0.7600 psychological level before the focus shifts to 0.7500, the lowest level reached since June 2017.
However, if the market manages to pick up speed, the 20-day simple moving average at 0.7768 could offer nearby resistance ahead of the 200-day SMA which currently stands at 0.7807. A significant close above the latter would break the 50% Fibonacci of 0.7818 of the upleg from 0.7500 to 0.8135, raising chances for further increases. In this case, prices could climb towards the 50-day SMA at 0.7851.
In the medium-term, the outlook remains negative since prices hold below all the moving average lines and the bearish cross between the 50- and the 200-day SMA stays in place.
Currencies: USD Shows ‘Resilience’ Even As Sentiment Turns Risk-Off Again
Rates: US stock market swoon triggers test of 2.8% support in US 10-yr yield
A heavy sell-off in US tech shares pulled general stock markets lowers and lifted core bonds via safe have flows. US Treasuries outperformed German Bunds with the US 10-yr yield heavily testing 2.8% support. Risk sentiment remains today's key driver ahead of inflation readings tomorrow and on Friday.
Currencies: USD shows 'resilience' even as sentiment turns risk-off again
The dollar is holding off recent lows against the euro end the yen. The risk-on/risk off balance recently provided no clear guidance for USD trading, and at least for now, risk-off doesn't hurt the dollar. FX traders will keep a closer eye at the US trade balance data as foreign trade takes center stage in President Trump's political agenda.
The Sunrise Headlines
- US stocks put in another dismal performance with Nasdaq underperforming (-3%) on fears over heightened regulation after Facebook's Zuckerberg was said to be willing to testify before US Congress. Main Asian indices lose around 1.5% overnight.
- North Korean leader Kim Jong Un traveled to China to meet with Chinese president Xi Jingping in a mission to strengthen ties with Beijing ahead of a planned summit with US President Trump.
- The US and South Korea agreed to revise their six-year-old trade pact with a side deal to deter competitive currency devaluation by Seoul and with concessions for US autos and pharmaceutical companies, officials said.
- Atlanta Fed Bostic, voting FOMC member, said he supports plans to gradually raise rates, but uncertainty over how the economy would respond next year to tax cuts and increased government spending could complicate policy.
- Sources told The Times that Irish officials have been promised concrete details on what alternative plans the UK government has to avoid a post-Brexit hard border, beyond the so-called backstop plan.
- Saudi Arabia and Russia are working on a historic long-term pact that could extend controls over world crude supplies by major exporters for many years.
- Today's eco calendar contains US advance trade balance and pending home sales. The US and Italy tap the bond market
Currencies: USD Shows 'Resilience' Even As Sentiment Turns Risk-Off Again
Dollar 'resilient' as sentiment turns again risk-off
A correction lower in EUR/USD enfolded after a failed test of 1.2475 resistance. EC confidence was softer than expected. It wasn't the trigger for the correction, but provided a good excuse for additional selling. Several ECB members kept a soft tone. The intraday EUR/USD correction was not only due to euro softness. Dollar sentiment also improved slightly (both DXY and USD/JPY were upwardly oriented). A new sell-off hit US tech stocks. The reaction in FX was again modest compared to the swings in bonds and equities. EUR/USD closed the session at 1.2403. USD/JPY finished the day little changed at 105.34.
The US tech sell-off also affects Asian markets this morning with regional indices losing up to 1.5% with China and Japan underperforming. Even so, the major dollar/FX cross rates are again holding remarkably calm. The yen doesn't profit from the risk-off sentiment. USD/JPY (105.60) even gains a few ticks. EUR/USD hovers in the low 1.24 area.
There are only second tier data in Europe today. US advance goods trade balance, inventory data, final Q4 GDP and pending homes sales will be published. Today's US data probably won't contain a game-changer for USD trading, but FX markets might become more sensitive to US foreign trade data, given recent campaign from the US administration to reduce the trade deficit. The reaction of the dollar might be asymmetrical, if any. The dollar might lose on a negative surprise, with little upside in case of a smaller deficit. FX traders also keep an eye at the global market context even if the risk-on/risk-off balance provided little guidance for USD trading of late. In a daily perspective, there a tentative signs of more dollar resilience, but the jury is still out. Any sustained USD gains probably need outright US data (especially price data). More technical trading in the EUR/USD 1.2155/1.2555 trading range might be on the cards.
Sterling initially came under pressure yesterday, but reversed most losses later. Anticipation on a big corporate flow might have been in play. CBI retail data will be published today. UK retail data were mediocre of late. (Unconfirmed) rumours on progress on the issue of the Irish border might be slightly sterling supportive. For now we assume the 0.8652 range bottom to hold
USD/JPY holds off recent low even as equity sentiment turns again risk-off
EURUSD Testing Above 1.2400 Level
The euro has moved back above the 1.2400 level against the U.S dollar, after the pair declined over one-hundred points from an intraday-high of 1.2475, on Tuesday. EURUSD buyers now need to move price-action above the 1.2430 resistance level on a higher-time frame basis, for sustainable upside gains. Key RSI and Momentum technical indicators are also turning higher, after unwinding from overbought trading conditions on Tuesday.
The EURUSD pair retains a bullish bias above the 1.2400 level, with 1.2430 and 1.2475 levels remaining the main short-term intraday resistance levels.
Key EURUSD intraday price support below the 1.2400 level, is currently located at the 1.2382 and 1.2334 levels.