Sample Category Title
EUR/USD Bearish Consolidation
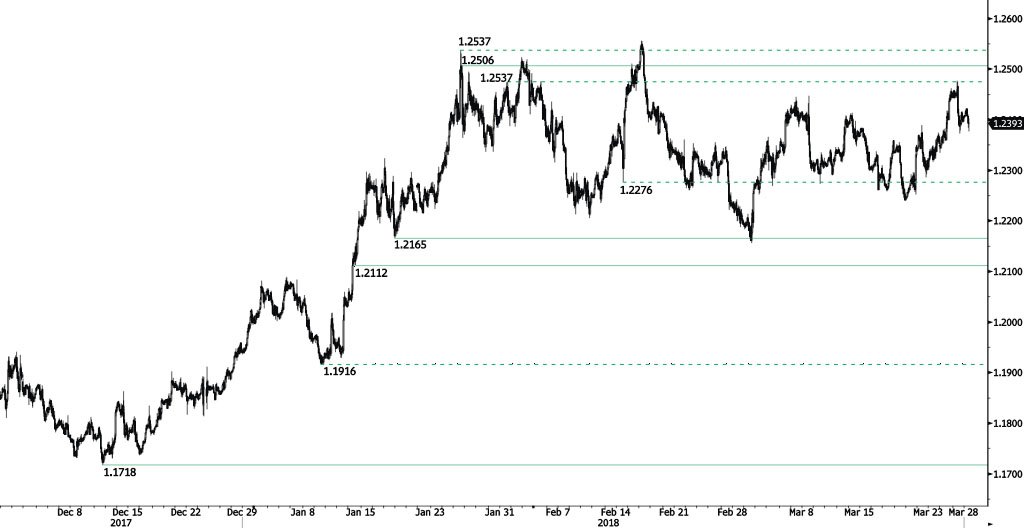
EUR/USD continues its bearish consolidation phase, trading at the 1.24 range, distancing hourly resistance at 1.2506 (25/01/2018 high). Hourly support remains at 1.2165 (17/01/2018 low). The technical structure suggests short-term sideways trading moves.
In the longer term, the momentum is turning largely positive. We favor a continued bullish bias. Key resistance is holding at 1.2886 (15/10/2014 high) while strong support lies at 1.1554 (08/11/2017 low).
Forex Analysis: GBPUSD And NASDAQ Index
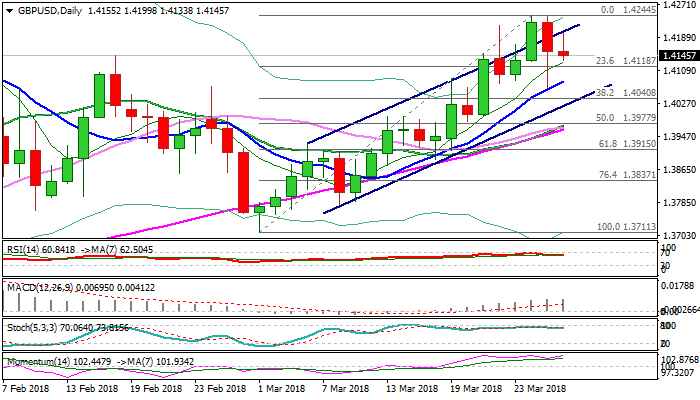
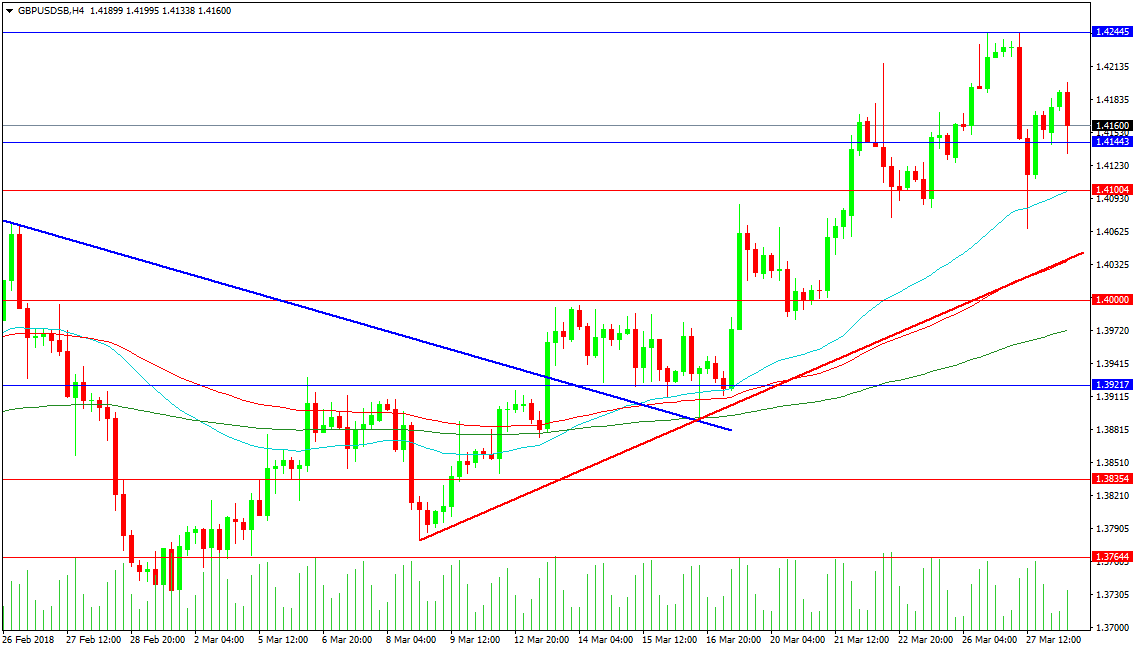
The GBPUSD pair broke out of its broadening wedge pattern on the 13th of March and retested the trend line in Blue on the 16th, setting up a move higher to 1.42445. This level was tested twice on Monday, with the price falling back to the 1.40675 level. The pair moved higher yesterday, helped by news that the UK Government would be in contact with the EU regarding a new solution to avoiding a hard border on the island of Ireland. Price has backed off from the highs this morning to retest support at around 1.41443.
Resistance comes in at the 1.42000 level, with the recent highs at 1.42445. The next level of resistance comes in at 1.42790, with the 1.43000 level above. The January high comes in at 1.43450. Support can be found at the 1.41000 level, which is aligned with the 50-period MA. A loss here would suggest a test on the supporting trend line at 1.40352 and the 100-period MA at the same level. If that support is broken then the recent move higher is at risk, with the 1.40000 level and the 200-period MA at 1.39720 acting as final supports ahead of the 1.39000 level and the lows at 1.37000.
NASDAQ Index
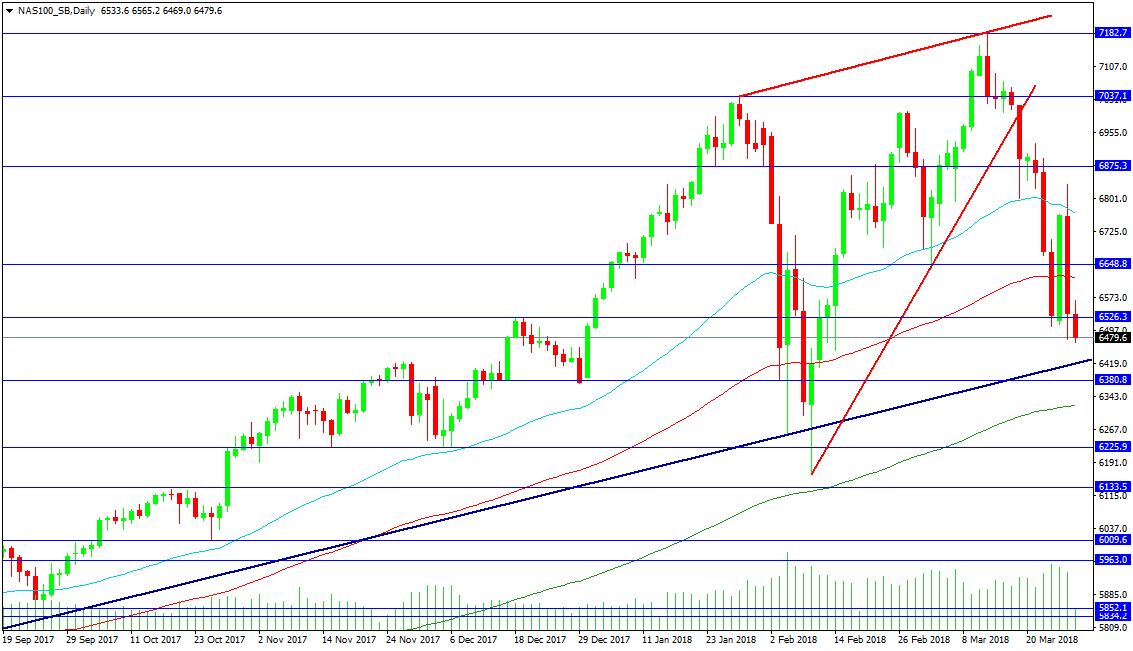
The US tech index has been hit hard once again, with Monday and Tuesday’s candles creating an outside day on the back of a downtrend over the last series of the session starting on the 13th of March. An outside day like this suggests that traders have made up their minds on the direction for the coming days and it represents a continuation of the recent trend. Thursday and Friday saw strong selling and the attempt to rally on Monday has been reversed by yesterday’s candle, with a new low created today so far. The supporting trend line is located at 6418 and this is the first level bears need to get across. Further support is seen at the 200 DMA at 6322.2 and the February low at 6161.8.
Resistance is found at the 100 DMA at 6618.6 and the 50 DMA at 6766.8, with yesterday’s high at 6833.2. The 7037.1 level and the high at 7182.7 are targets for bulls to aim for should the trend reverse.
Euro Looks To German Inflation Data For Direction
Germany’s preliminary inflation data for March are due for release on Thursday, at 1200 GMT. Forecasts point to an acceleration in price pressures for Eurozone’s largest economy, which would undoubtedly be pleasant news for the European Central Bank (ECB) as it prepares the ground for an unwinding of stimulus that is likely to take place later this year.
After touching a high-point of 2.0% in yearly terms back in February 2017, Eurozone’s inflation rate has been steadily trending lower in the past year, lending credibility to the ECB’s view that “a high degree of monetary accommodation is still needed” for inflation to sustainably return to its target. Despite this shortfall though, the Bank has remained firm in signaling that an exit from its QE stimulus program is drawing closer. Assuming inflation does not plummet over the next months and barring some other unforeseen negative shock, the ECB looks set to gradually phase out its asset purchases from September onwards, with some signaling of this likely to come at the summer meetings.
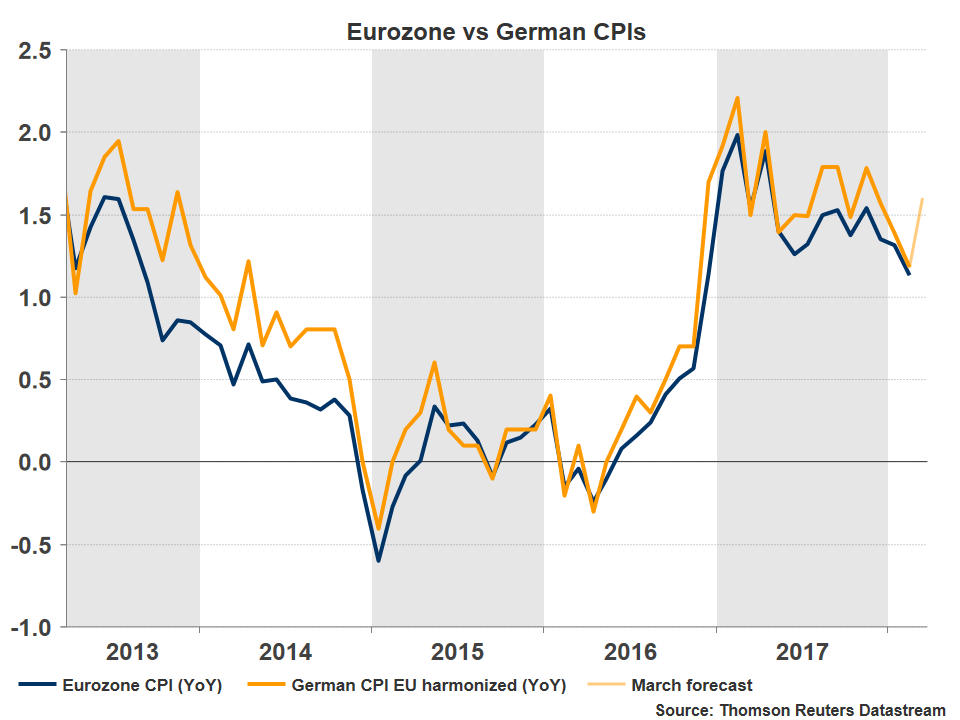
A potential acceleration in Germany’s inflation, and by extent in the entire bloc’s, would fit nicely into this narrative. In March, Germany’s preliminary EU-harmonized CPI rate is projected to have risen to 1.6% in yearly terms, from 1.2% previously. The forecast is supported by the nation’s preliminary Markit Composite PMI, which noted that March saw a further strong increase in average prices charged for goods and services. Even though the rate of inflation softened to a three-month low, it still remained higher than any other point since 2011, the survey said.
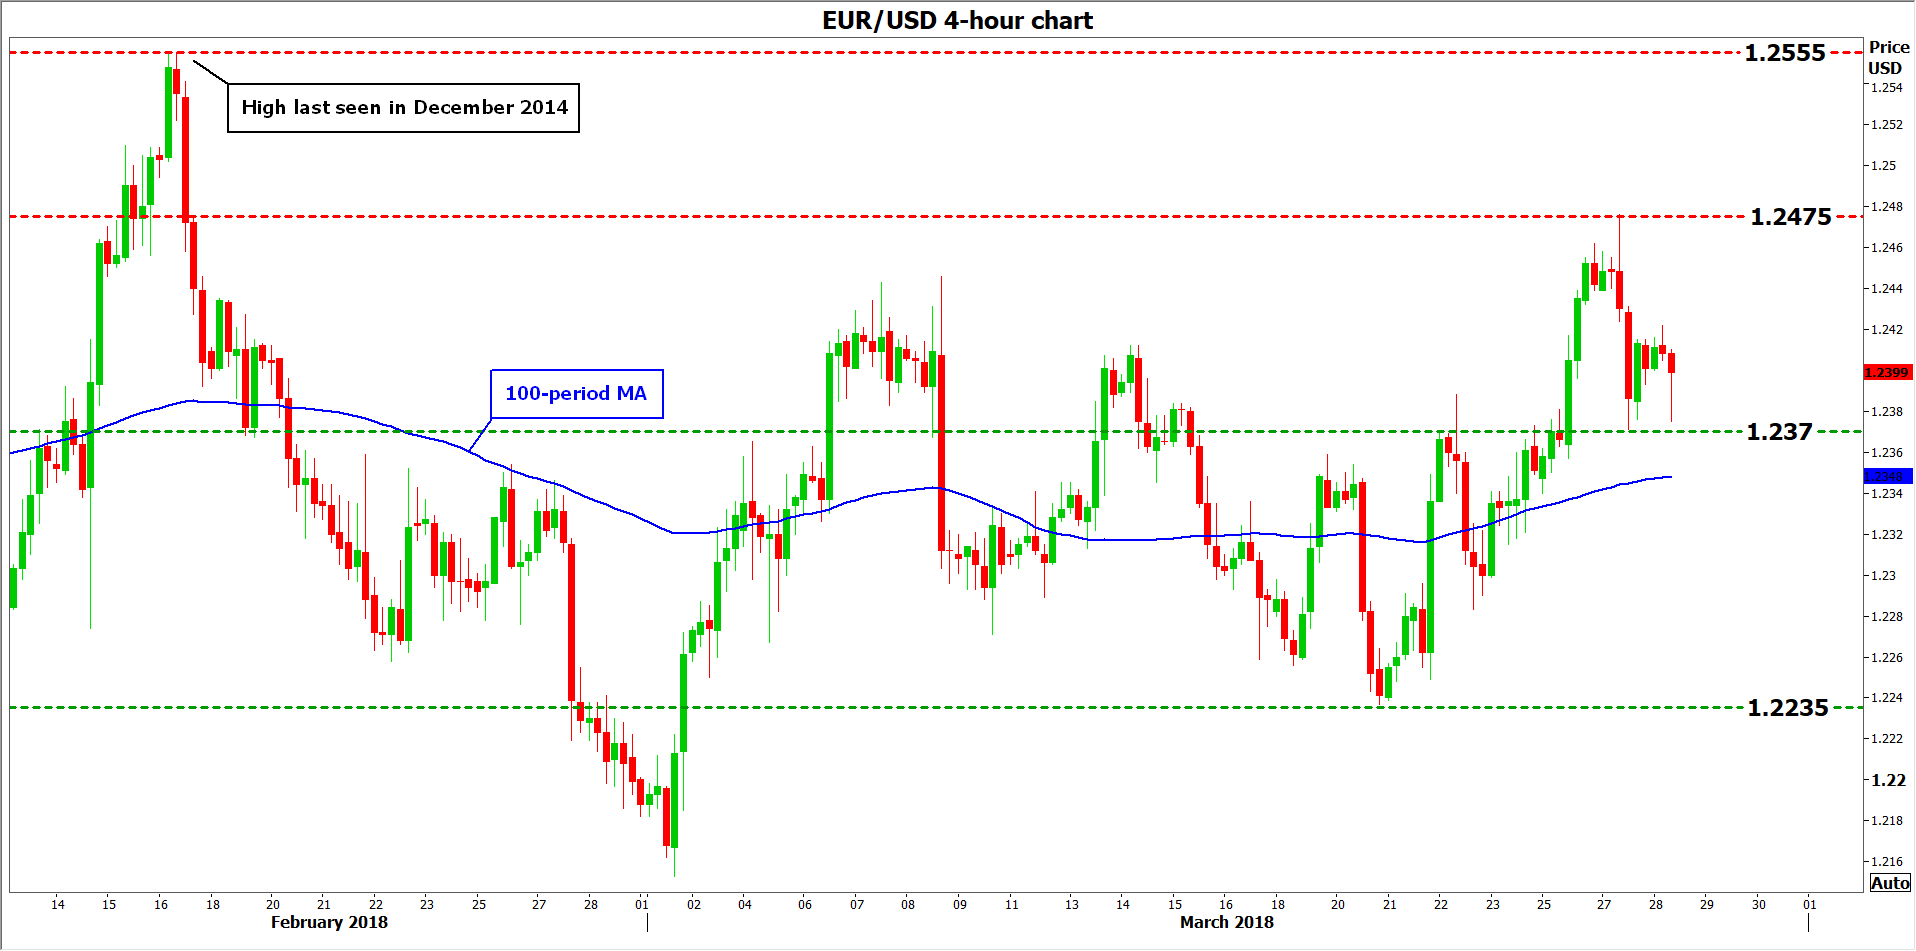
In case Germany’s CPI rate comes in stronger than expected, euro pairs could rally on speculation for a similar surprise in Eurozone’s CPI rate, which will be released on April 4 due to the Easter holidays. Euro/dollar could encounter immediate resistance near the 1.2475 zone, marked by the highs of March 27, with further bullish extensions likely to aim for 1.2555, which is the pair’s recent top from February and also a three-year high.
On the other hand, a disappointment in these data – for instance a smaller-than-anticipated rise in the CPI rate – could weigh on the common currency. Euro/dollar may edge lower and retest the 1.2370 support level, identified by the bottoms of March 27, with a potential downside break of that area bringing in play the 1.2235 hurdle, defined by the March 20 low.
 As always, Germany's regional CPI data will be released a few hours ahead of the nationwide print, so any market reaction may occur even before the official release time. It's also worth noting that the French and Italian CPI prints that will be released on March 30 will also be closely monitored, as investors gauge the bloc's overall reading – France and Italy being Eurozone's second and third largest economies. Spanish figures have already been released and were somewhat disappointing, with the CPI rate rising by less than expected.
AUD/USD falls but will face 4H, D, W pivot S1 confluence
Markets are generally back in risk averse mode today. Nikkei lost -286 pts or -1.34% to close at 21031.31. Major European indices are in red in initial trading, with DAX due -1.5%, CAC down -1.3% and FTSE down -0.6%.
AUD is a currency that's usually weighed down by risk aversion. EUR/AUD extended recent rally and reaches as high as 1.6189, and regains upside H action bias.
AUD/USD also drops through 0.7671 support to resume whole fall from 0.8135.
However, as AUD/USD dips lower, it will face confluence of 4H S1, D S1 and W S1 at 0.7648/9. AUD/USD might struggle to build downside momentum for a short while.
Forex Technical Analysis: EUR/USD, USD/JPY, GBP/USD
EUR/USD
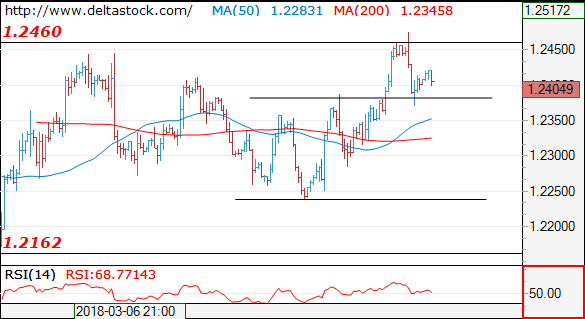
Current level - 1.2404
The short-lived spike to 1.2475 sets the finale of the rise since 1.2240 low and the bias is bearish, for a break through 1.2380, towards 1.2240.
| Resistance | Support | ||
| intraday | intraweek | intraday | intraweek |
| 1.2420 | 1.2560 | 1.2380 | 1.2160 |
| 1.2510 | 1.2560 | 1.2240 | 1.2090 |
 USD/JPY
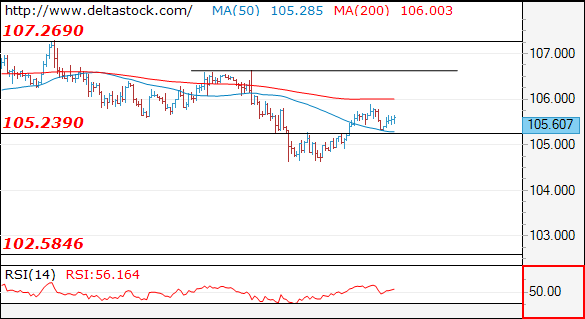
Current level - 105.60
My outlook is bearish, for a break through 105.20, towards 104.30.
| Resistance | Support | ||
| intraday | intraweek | intraday | intraweek |
| 105.90 | 108.30 | 105.20 | 104.30 |
| 106.60 | 110.40 | 104.30 | 102.50 |
GBP/USD
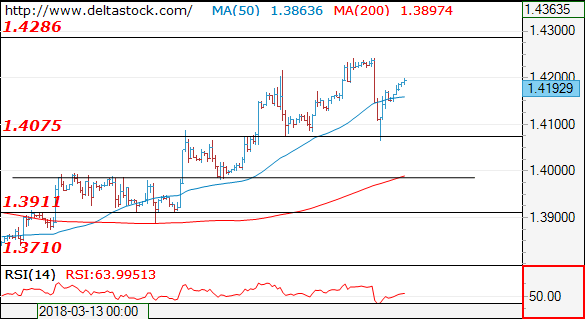
Current level - 1.4192
The massive sell-off at 1.4240 shows a reversal of the whole upmove since 1.3710 and the outlook here is bearish, for a slide through 1.4075, towards 1.3910.
| Resistance | Support | ||
| intraday | intraweek | intraday | intraweek |
| 1.4200 | 1.4280 | 1.4075 | 1.3710 |
| 1.4240 | 1.4340 | 1.3910 | 1.3620 |
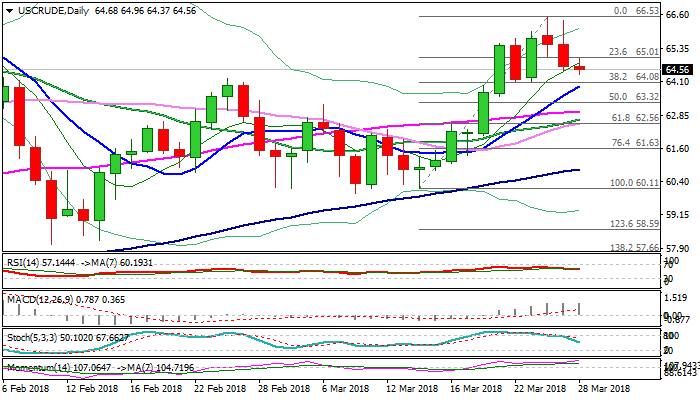
WTI OIL Remains Weak After Surprise Build In Oil Inventories, EIA Report Eyed For Fresh Signals
WTI oil holds in red for the third straight day end extends lower on Wednesday, after accelerating below $65 in late Tuesday on surprise build of US crude inventories.
API report, released late Tuesday, showed unexpected build of crude stocks by 5.3 million barrels compared to forecast for 1 million barrels build.
Oil price trades in corrective pullback from $66.53 (26 Mar high) where rally from $60 zone higher base stalled.
Corrective action was signaled by overbought studies and could extend further, as build of crude stocks had negative impact on oil price, already weighed by increasing US shale oil production, which threatens to further affect efforts of main world oil producers to stabilize oil markets by reducing production.
Daily techs remain in bullish setup and favor limited pullback (ideally to be contained at $64 zone, Fibo 38.2% of $60.11/$66.53 upleg / rising 10SMA) to keep bullish structure intact.
However, risk of deeper pullback on firm break below $64 pivot remains in play, with focus on today’s EIA crude stocks data.
Another upside surprise (weekly crude stocks are forecasted to rise by 0.28 million barrels) would put oil price under fresh pressure and risk extension towards $63 zone (55SMA).
Bullish scenario requires return and close above $65 handle to ease existing downside risk.
Res: 65.00, 65.50, 65.98, 66.40
Sup: 64.37, 64.08, 63.94, 63.32
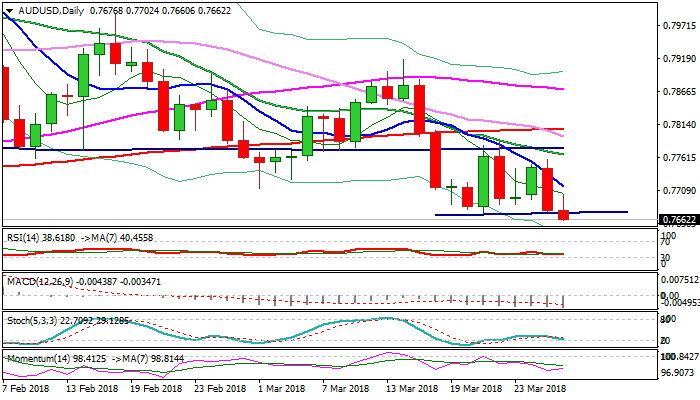
AUDUSD – Fresh Bearish Signal On Break Below Congestion Floor
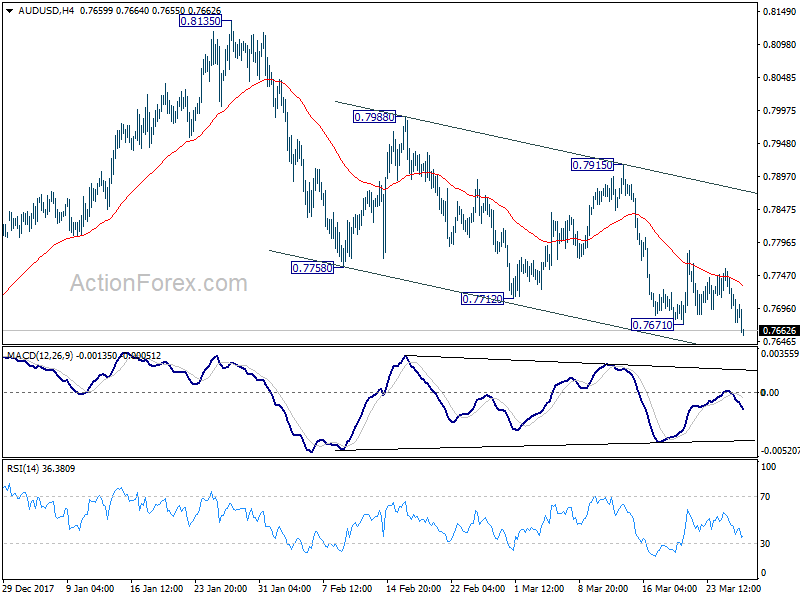
The Aussie dollar holds firmly in red on Wednesday and extends lower after strong fall on Tuesday, to hit new lows of over three months.
News that China prepares a list of tariffs for US goods, increased pressure on Aussie.
Today’s fresh weakness signaled eventual break through the floor of week-long congestion (0.7672) which generates strong bearish signal for continuation of larger downtrend from 0.8135 (2018 high).
Fresh bears eye next pivotal supports at 0.7650/41 (Fibo 76.4% of 0.7500/0.8135 rally / weekly cloud base), break of which could open way towards key med-term support at 0.7500 (11 Dec low).
Res: 0.7700, 0.7715, 0.7757, 0.7775
Sup: 0.7650, 0.7641, 0.7600, 0.7586
Today Is Another Quiet Day In Terms Of Global Data Releases With Only Tier-2 Releases
Market movers today
Today is another quiet day in terms of global data releases with only tier-2 releases.
In the UK, an economic survey from Bank of England is due out, which will give us more insight into companies’ investment intentions, wage growth etc.
In the US, we get the third release of Q4 GDP, pending homes sales in February and advance goods trade balance in February.
In both Sweden and Norway, retail sales for February are due out this morning (08:00 and 09:30 CET, respectively).
Selected market news
The US S&P500 ended 1.7% lower yesterday, as tech stocks plunged due to the story about the US blocking Chinese investments in tech companies (see more below) and poor risk appetite in general. The fall came after a good day on the European markets, where EURO STOXX 50 ended 1.2% higher. The bad mood in the US has spilled over to the Asian markets, where all the major indices are flashing red this morning. US 10Y Treasuries are now trading below 2.80%, the lowest since early February.
The North Korean dictator Kim Jong-Un has met with Chinese President Xi Jinping in a surprise visit to Beijing, where he said he is willing to denuclearise if the US and South Korea recognise the North Korean state and is still willing to meet with both the US and South Korea, see Bloomberg. Xi Jinping said it will remain a friend with North Korea because of to ‘strategic choices’.
According to sources, the Trump administration is considering to restrict Chinese investments in tech companies, see Bloomberg. Trump has given Treasury Secretary Mnuchin 60 days to come up with solutions after the results of the US investigation on Chinese theft of US intellectual property rights and this is likely one of them. The story was partly backed by comments from Commerce Secretary Wilbur Ross. We still expect the trade war to end up being more verbal than economical but in any case, it is going to be very slowly fought and not a theme that will go away for the next couple of months (at least),
In case you missed it, we published our Nordic Outlook yesterday with new macroeconomic forecasts for Denmark, Sweden, Norway and Finland. The recovery continues both in the world economy and in the Nordic countries but with a few more reservations than in our early January update.
According to The Times, the UK government may soon release its plan on the solution to the Irish border issue, which remains one of the biggest obstacles for the Brexit negotiations.
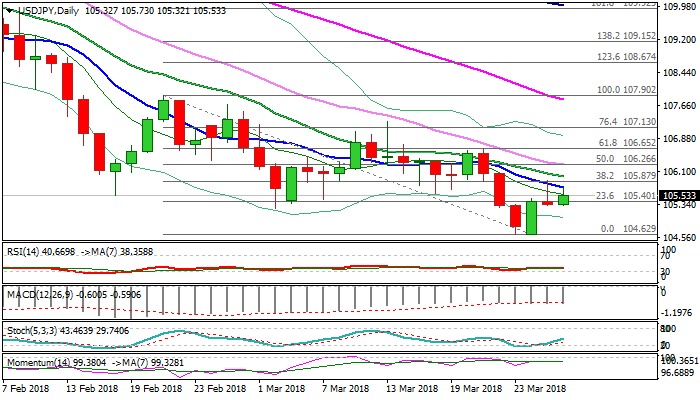
USDJPY – Downside Remains Vulnerable While Falling 10SMA Caps Recovery
Recovery action from 104.63 low shows signs of stall after Tuesday's extension higher was strongly rejected at key double-Fibonacci barrier at 105.87 (Fibo 61.8% of 106.64/104.63/Fibo 38.2% of 107.90/104.63 descend) and capped by falling 10SMA. Negative signal also comes from formation of Shooting Star on daily chart, with firmly bearish daily techs supporting the notion. The downside is expected to remain vulnerable while the price action stays capped by falling 10SMA (currently at 105.73). Sustained break higher would provide relief, however, recovery extension needs break above falling 30 SMA which tracks descend since early Jan (currently at 106.27) to generate stronger bullish signal and sideline existing bearish threats.
Res: 105.73, 105.87, 106.00, 106.27
Sup: 105.32, 105.24, 105.00, 104.63
GBPUSD – Bullish Outlook Above Rising 10SMA
Cable holds in red in early Wednesday's trading and capped by the upper boundary of bull-channel. Double rejection at 1.4244 on Mon/Tue and Tuesday's bearish close signal double-top formation which could trigger further easing, as profit-taking on month/quarter end would put sterling under increased pressure. On the other side, yesterday's strong downside rejection at 1.4065, where rising 10SMA contained dip and subsequent bounce left long-tailed daily candle, could be supportive. Daily studies are firmly bullish and supportive for fresh advance, with key supports at 1.4080/40 (rising 10SMA/Fibo 38.2% of 1.3711/1.4244 rally) required to hold extended dips and keep bulls in play.
Res: 1.4200, 1.4218, 1.4244, 1.4277
Sup: 1.4133, 1.4080, 1.4065, 1.4040