Sample Category Title
AUD/USD Mid-Day Outlook
Daily Pivots: (S1) 0.7649; (P) 0.7703; (R1) 0.7731; More...
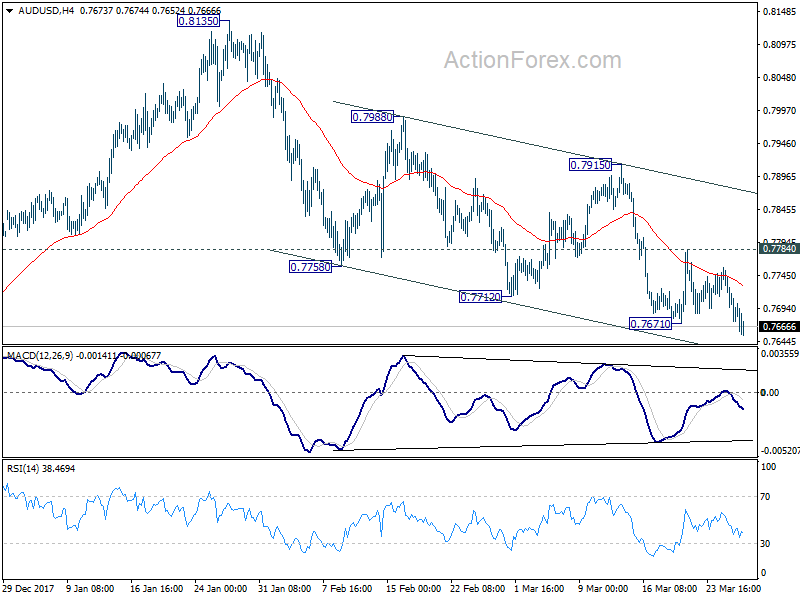
AUD/USD's break of 0.7671 indicates resumption of whole fall from 0.8135. Intraday bias is turned back to the downside for 0.7500 key support level next. At this point, we'll stay cautious on strong support from there to bring rebound. On the upside, break of 0.7784 minor resistance is needed to be the first sign of near term reversal. Otherwise, outlook will remain bearish in case of recovery.
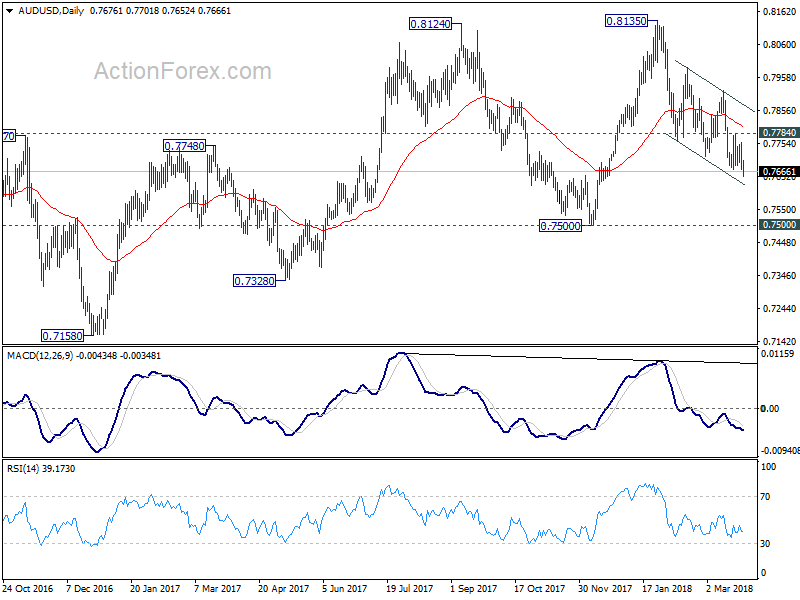
In the bigger picture, medium term rebound from 0.6826 is seen as a corrective move. It might still extend higher but we'd expect strong resistance from 38.2% retracement of 1.1079 to 0.6826 at 0.8451 to limit upside to bring long term down trend resumption. On the downside, break of 0.7500 support will now be an important signal that such corrective rebound is completed. In that case, AUD/USD would be heading back to 0.6826 low in medium term.
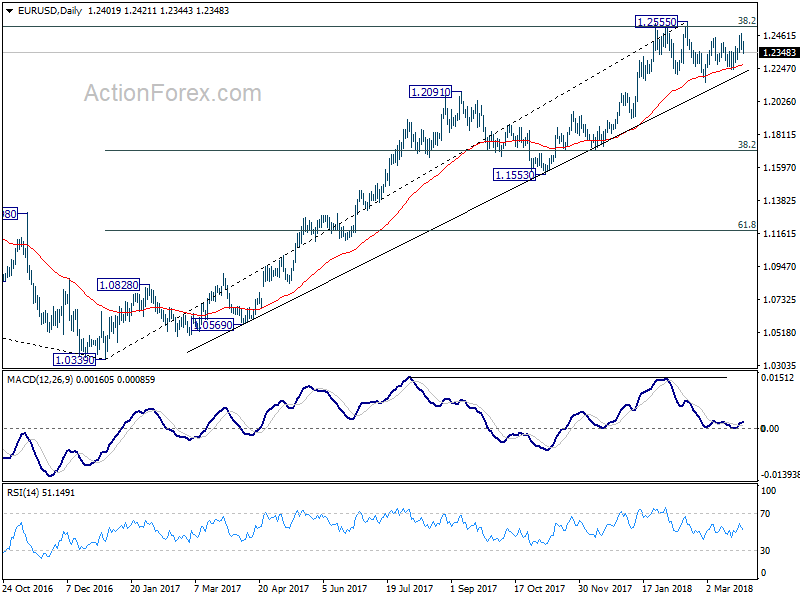
EUR/USD Mid-Day Outlook
Daily Pivots: (S1) 1.2356; (P) 1.2416 (R1) 1.2461; More....
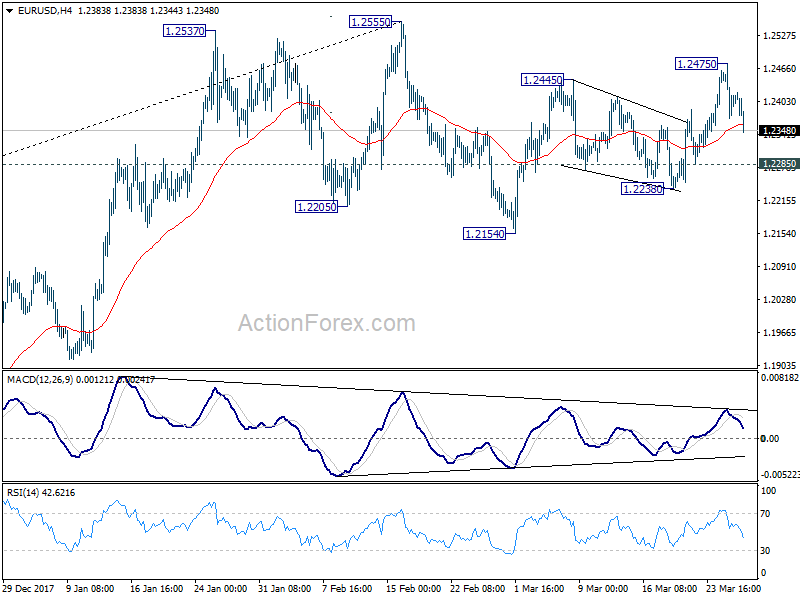
EUR/USD's retreat from 1.2475 extends lower today but it's staying above 1.2285 minor support. Intraday bias neutral and another rise remains mildly in favor. On the upside, above 1.2475 will target a test on 1.2555 high, which is close to 1.2516 key long term fibonacci level. We'd be cautious on reversal from there. But decisive break will carry larger bullish implications. On the downside, below 1.2285 minor support will turn bias to the downside for 1.2154 and possibly below.
In the bigger picture, key fibonacci level at 38.2% retracement of 1.6039 (2008 high) to 1.0339 (2017 low) at 1.2516 remains intact despite attempts to break. Hence, rise from 1.0339 medium term bottom is still seen as a corrective move for the moment. Rejection from 1.2516 will maintain long term bearish outlook and keep the case for retesting 1.0039 alive. Firm break of 1.1553 support will add more medium term bearishness. However, sustained break of 1.2516 will carry larger bullish implication and target 61.8% retracement of 1.6039 to 1.0339 at 1.3862 in medium term.
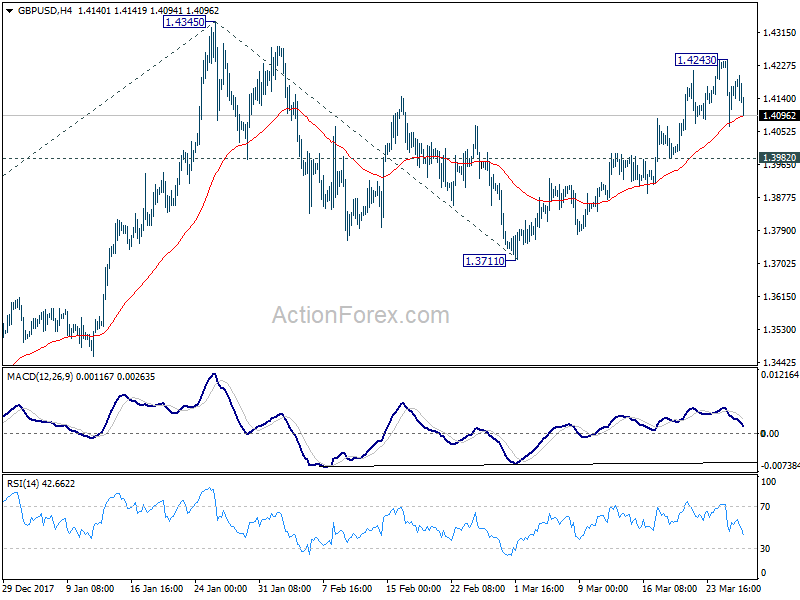
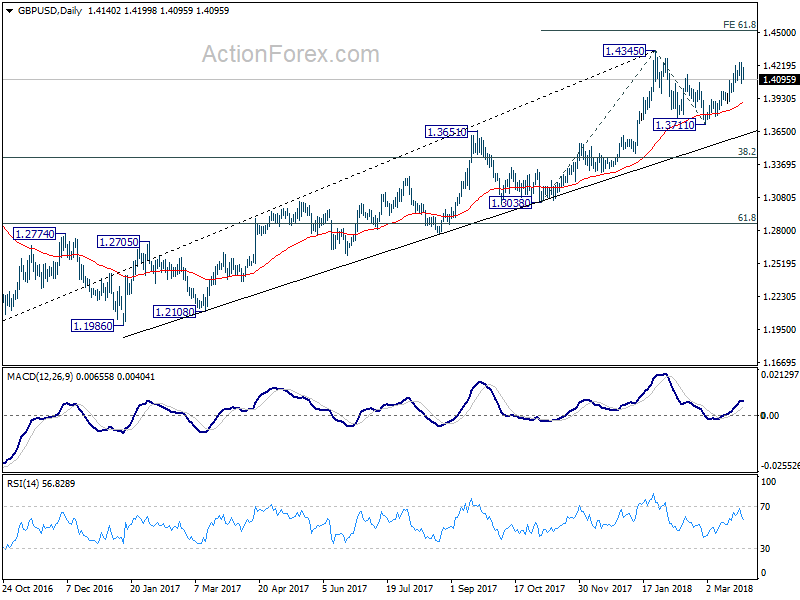
GBP/USD Mid-Day Outlook
Daily Pivots: (S1) 1.4068; (P) 1.4156; (R1) 1.4246; More....
GBP/USD is still bounded in consolidative trading below 1.4243 temporary top and intraday bias remains neutral. Further rise is expected with 1.3982 support intact. On the upside, above 1.4243 will target 1.4345 high first. Decisive break there will resume larger up trend and target 61.8% projection of 1.3038 to 1.4345 from 1.3711 at 1.4519 next. On the downside, however, firm break of 1.3982 will indicate completion of rebound from 1.3711. In that case, intraday bias will be turned back to the downside for retesting 1.3711.
In the bigger picture, as long as 1.3038 support holds, medium term outlook in GBP/USD will remains bullish. Rise from 1.1946 is at least correcting the long term down from 2007 high at 2.1161. Further rally would be seen back to 38.2% retracement of 2.1161 (2007 high) to 1.1946 (2016 low) at 1.5466. However, GBP/USD fails to sustain above 55 month EMA (now at 1.4259) so far. Break of 1.3038 support, will suggest that rise from 1.1946 has completed and will turn outlook bearish for retesting this low.
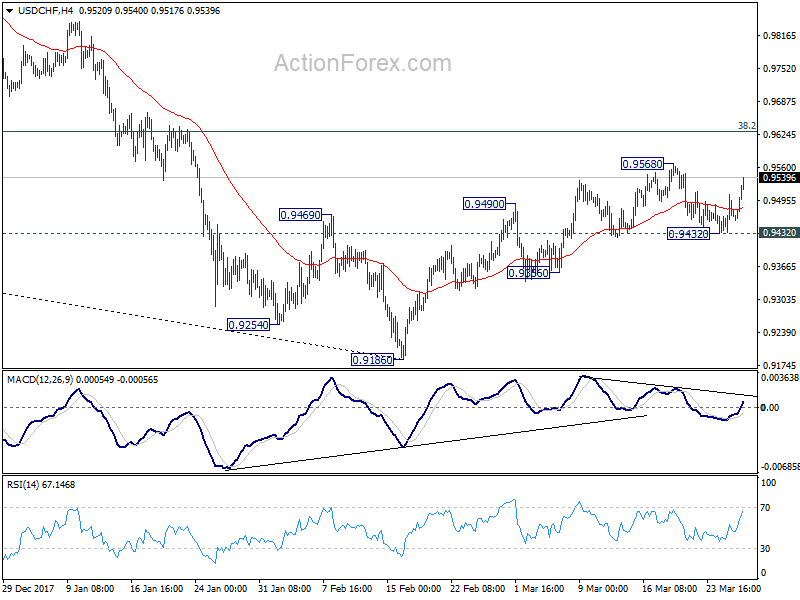
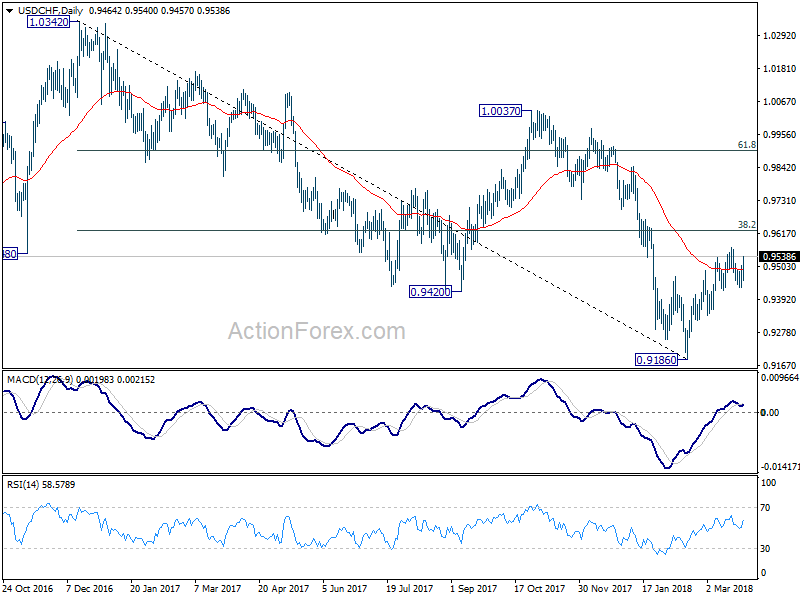
USD/CHF Mid-Day Outlook
Daily Pivots: (S1) 0.9442; (P) 0.9469; (R1) 0.9493; More...
While USD/CHF rebounds strongly today, there is no change in the near term outlook so far. Rebound from 0.9186 could extend higher. But we'd expect strong resistance from 0.9626 key fibonacci level to limit upside. On the downside, break of 0.9432 support will indicate near term reversal and completion of rebound from 0.9186. In this case, intraday bias will be turned back to the downside for retesting 0.9186 low. However, sustained break of 0.9626 will carry larger bullish implications and bring stronger rally.
In the bigger picture, fall from 1.0342 is seen as a medium term down trend. Main focus is on 38.2% retracement of 1.0342 (2016 high) to 0.9186 (2018 low) at 0.9626. Sustained break there will add to the case of trend reversal and target 61.8% retracement at 0.9900 and above). However, rejection from 0.9626 will maintain medium term bearishness for another low below 0.9186.
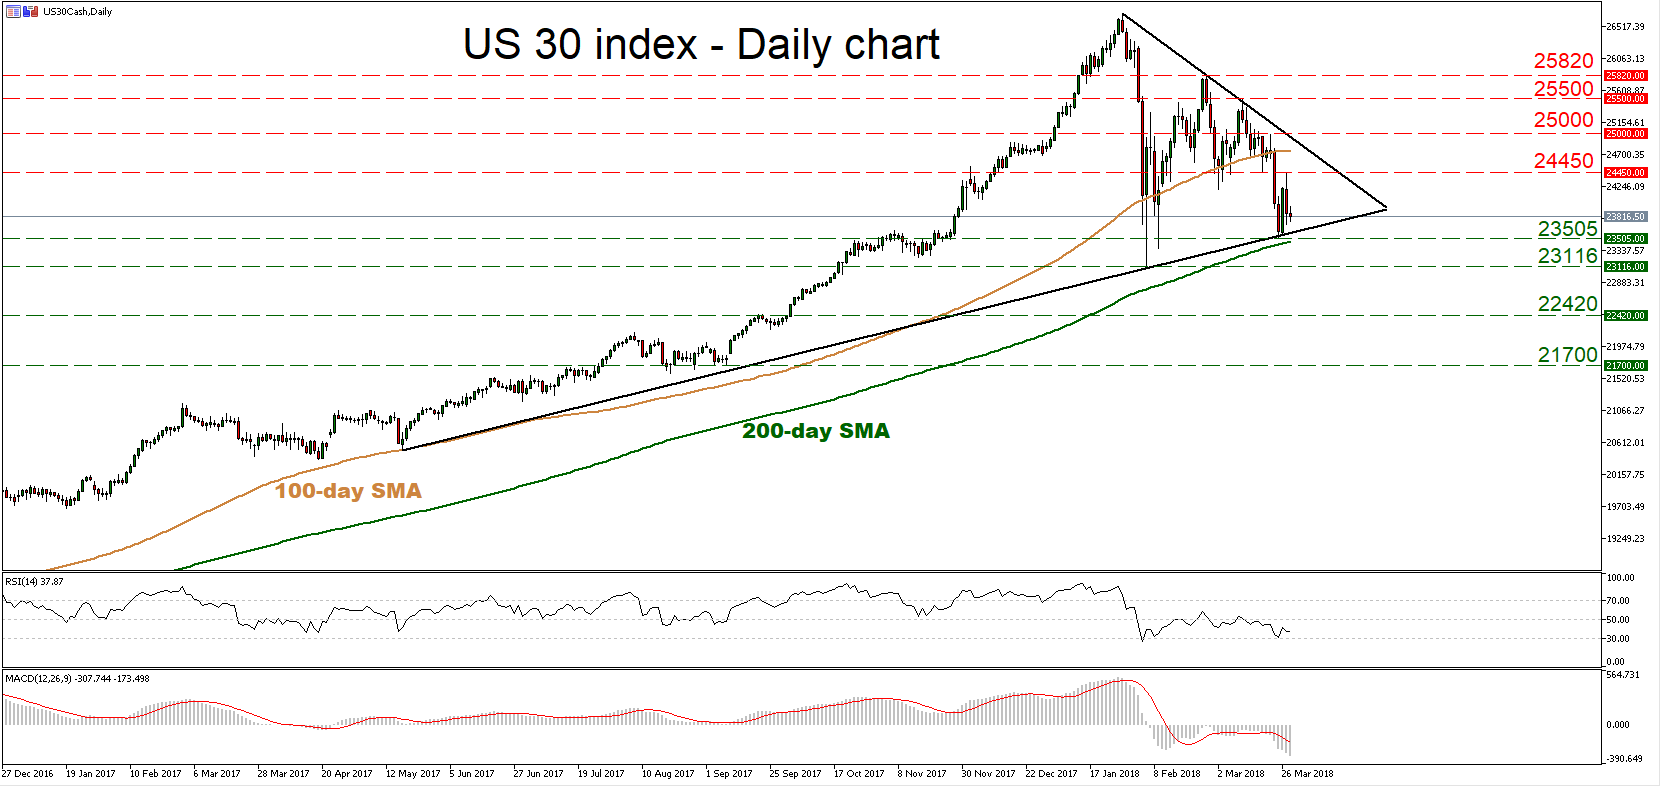
US 30 Index Finds Support Near Trendline and 200-Day SMA
The US 30 index has come under renewed selling pressure, falling back below its 100-day moving average (MA), but remaining slightly above the 200-day MA. Despite the latest pullback though, the index has not posted a fresh lower low, which makes one hesitant to trust further declines for now. Moreover, the price rebounded after it found support near the uptrend line taken from the lows of May 2017, enhancing the argument that the picture may not be entirely negative at the moment. Broadly, the index is trading within a triangle formation, with a break outside it likely to determine the next trend direction.
Looking at momentum oscillators on the daily chart though, they suggest further declines may be on the cards in the short-term. The RSI is below its neutral 50 line, detecting negative momentum, and is also pointing downwards. The MACD, already negative, lies below its trigger line.
In case of further declines in the index, immediate support may be found near the latest lows at 23,505, an area that also encapsulates the 200-day MA at 23,410. A downside break of that zone would open the way for the February bottom of 23,116. If sellers manage to push below that hurdle too, that would mark a lower low on the daily chart, increasing the probability for further bearish extensions. Support may be found initially near 22,420, identified by the September 20 top, with subsequent declines bringing the 21,700 barrier into focus, marked by the September 5 lows.
On the flipside, if the bulls retake control, price advances may stall initially near the latest highs at 24,450, and subsequently near the psychological figure of 25,000. A potential upside violation of 25,000 would also coincide with a break of the downtrend line taken from the index’s all-time high achieved on January 29, raising the likelihood for more advances. In such a case, the 25,500 and the 25820 levels could act as barriers to the upside, identified by the March 12 and the February 27 highs respectively.
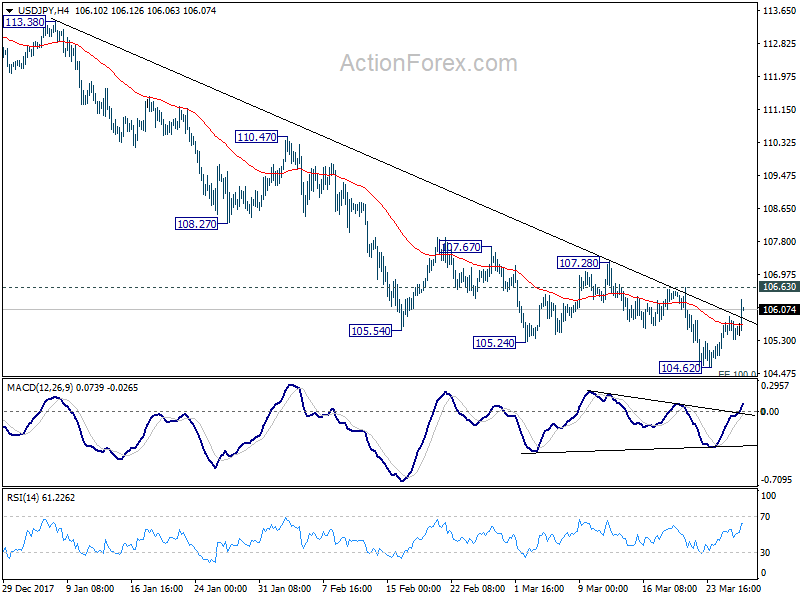
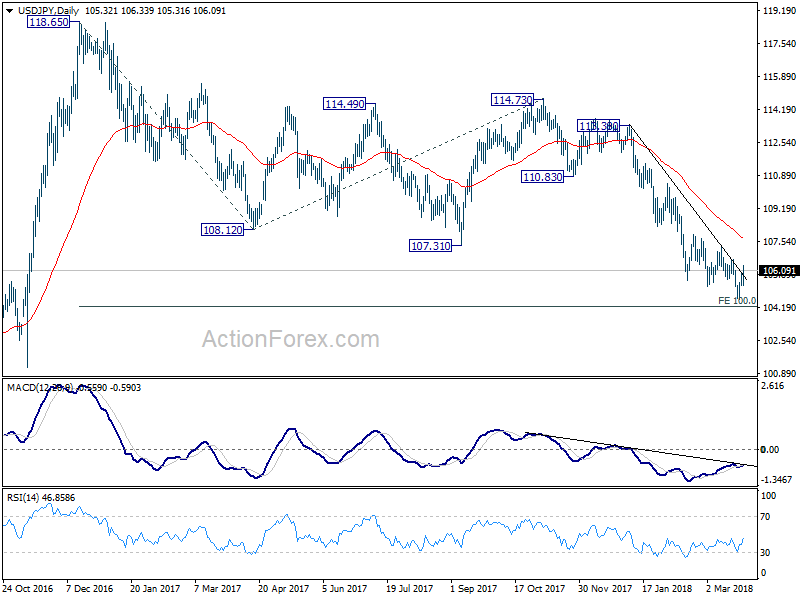
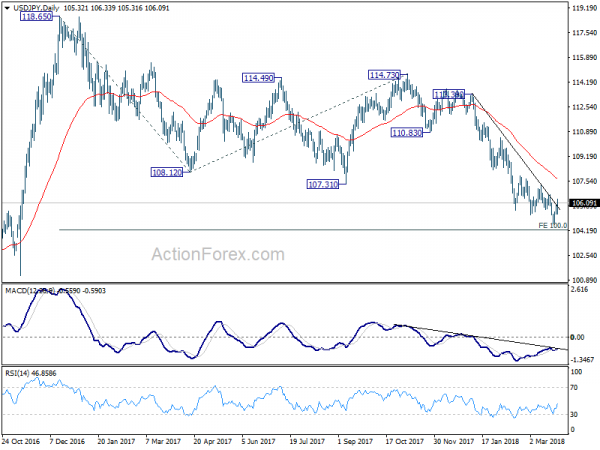
USD/JPY Mid-Day Report
Daily Pivots: (S1) 105.12; (P) 105.51; (R1) 105.71; More...
USD/JPY's rebound from 104.62 extends to as high as 106.33 so far today. But still, it's staying well below 106.63 resistance. Intraday bias remains neutral with near term outlook staying bearish. On the downside, break of 104.62 will resume larger fall fro 104.20 projection level first. Sustained break there will pave the way to 98.97 (2016 low). Nonetheless, break of 106.63 will indicate short term bottom and turn bias back to the upside for stronger rebound.
In the bigger picture, medium term down trend from 118.65 (2016 high) is still in progress and extending. Build up in downside momentum argues that it might be extending the whole corrective pattern from 125.85 (2015 high). 100% projection of 118.65 to 108.12 from 114.73 at 104.20 will be a key level to watch as firm break there could bring downside acceleration. And in that case, 98.97 key support level (2016 low) would at least be breached. This bearish case will now be favored as long as 108.12 support turned resistance holds.
Risk On Again as Stocks Futures Rebound on Facebook, Yen and Swiss Franc Dive
The pattern of risk on/risk off continues today. After opening lower, European indices pare back much losses with FTSE now back in black at the time of writing. US futures also point to slightly higher open. Tech stocks, who were the main reason of yesterday's selloff, recover mildly. Facebook's announcement of new privacy tools that streamline the process of personal data control is taken well by the markets. And as a result, Yen and Swiss France are steeping sold off entering into US session. Australian Dollar and Canadian Dollar are trying to stage a recovery, followed by Dollar. But after all, it'd quarter-end trading with markets in holiday mood. Those movements might no be again to persist.
Released from US today, Q4 GDP growth was finalized at 2.9% annualized, revised up from 2.5%. GDP price index was unchanged at 2.3%. Wholesale inventories rose 1.1% mom in February. Trade deficit widened slightly to USD -75.4b in February. From UK, CBI reported sales dropped to -8 in March. Germany Gfk consumer confidence rose 0.1 to 10.9 in April.
Trump pledges to maintain maximum sanctions and pressure on North Korea "at all cost"
US President Donald Trump responded to North Korean Leader Kim Jong-un's official visit to China. He tweeted that "received message last night from XI JINPING of China that his meeting with KIM JONG UN went very well and that KIM looks forward to his meeting with me. In the meantime, and unfortunately, maximum sanctions and pressure must be maintained at all cost!"
There is no official details regarding the purpose and content of the visit. It's seen as a symbolic visit of courtesy ahead of Kim's planned meeting with South Korean President Moon Jae-in in April, and US President Donald Trump in May. Kim should have explained his positions regarding the summits and sought China's position too.
China's Xinhua news agency reported Kim saying that "the issue of denuclearization of the Korean Peninsula can be resolved, if South Korea and the United States respond to our efforts with goodwill, create an atmosphere of peace and stability while taking progressive and synchronous measures for the realization of peace."
EC urged united stance on US tariffs
Bloomberg reported the European Commission urged the region's governments today to stand united in trade talks with the US, and be ready to "think out of the box fast". EU is seeking to follow South Korea to get indefinite exemption on the steel and aluminum tariffs by May 1. But, the option of re-negotiation of EU-US free trade agreement is ruled out by EC. Unilateral European concessions to the US is also ruled out.
It was also reported by Bloomberg that Germany is adopting a flexible approach in dealing with the US and is willing to offer concession to the US. Germany Chancellor Angel Merkel is believed to be ready to lower the 10% EU tariff on autos to avoid a trade dispute. But that is in total opposite position to France. President Emmanuel Macron is clear in his message that European steel and aluminum exports pose no security threat to the US. And the rules of international trade need to be "reinforced" to ensure such a level playing field.
New Zealand business confidence suggests 2-3% annual growth
New Zealand ANZ business confidence dropped to -20 in March, down from -19. That means a net 20% of businesses are pessimistic about the year ahead. ANZ noted in the release that "headline business confidence and firms' views of their own activity have trodden water in March, both little changed from the preceding month." Also, "belying the headline measures somewhat, all key activity indicators improved further, albeit while remaining well off their cycle highs." Also, "pricing indicators were broadly steady". ANZ also indicated that the growth indicator, which combines business and consumer confidence, continues to suggest growth around 2-3% y/y.
USD/JPY Mid-Day Outlook
Daily Pivots: (S1) 105.12; (P) 105.51; (R1) 105.71; More...
USD/JPY's rebound from 104.62 extends to as high as 106.33 so far today. But still, it's staying well below 106.63 resistance. Intraday bias remains neutral with near term outlook staying bearish. On the downside, break of 104.62 will resume larger fall fro 104.20 projection level first. Sustained break there will pave the way to 98.97 (2016 low). Nonetheless, break of 106.63 will indicate short term bottom and turn bias back to the upside for stronger rebound.
In the bigger picture, medium term down trend from 118.65 (2016 high) is still in progress and extending. Build up in downside momentum argues that it might be extending the whole corrective pattern from 125.85 (2015 high). 100% projection of 118.65 to 108.12 from 114.73 at 104.20 will be a key level to watch as firm break there could bring downside acceleration. And in that case, 98.97 key support level (2016 low) would at least be breached. This bearish case will now be favored as long as 108.12 support turned resistance holds.

 Economic Indicators Update
| GMT | Ccy | Events | Actual | Forecast | Previous | Revised |
|---|---|---|---|---|---|---|
| 00:00 | NZD | ANZ Business Confidence Mar | -20 | -19 | ||
| 06:00 | EUR | German GfK Consumer Confidence Apr | 10.9 | 10.7 | 10.8 | |
| 10:00 | GBP | CBI Reported Sales Mar | -8 | 7 | 8 | |
| 12:30 | USD | Advance Goods Trade Balance Feb | -75.4B | -74.1B | -75.3B | |
| 12:30 | USD | Wholesale Inventories M/M Feb P | 1.10% | 0.50% | 0.80% | |
| 12:30 | USD | GDP Annualized Q/Q Q4 T | 2.90% | 2.70% | 2.50% | |
| 12:30 | USD | GDP Price Index Q4 T | 2.30% | 2.30% | 2.30% | |
| 14:00 | USD | Pending Home Sales M/M Feb | 2.00% | -4.70% | ||
| 14:30 | USD | Crude Oil Inventories | -2.6M |
Canadian Dollar Subdued Ahead of US GDP
The Canadian dollar is trading sideways in the Wednesday session. Currently, USD/CAD is trading at 1.2877, down 0.11% on the day. On the release front, there are no Canadian indicators for a third straight day. In the US, Final GDP is expected to be revised upwards to 2.7%, after the initial reading of 2.5% back in February. US Pending Homes is forecast to rebound with a strong gain of 2.1%. On Thursday, US unemployment claims is forecast to tick up to 230 thousand, and UoM Consumer Sentiment is predicted to climb to 101.9 points. Canada will release the monthly GDP report.
The tariff dispute between the US and China has shaken up global stock markets and also caused volatility in the currency markets. The US dollar recorded losses last week, after President Trump’s dramatic announcement that he was imposing stiff tariffs on up to $60 billion in Chinese imports. China vowed to retaliate and slap imports on a range of US products. This move came on the heels of a blanket US tariff on steel imports. Although Trump backtracked and exempted Canada, Mexico and other countries from the steel tariffs, the threat of a global trading war has unnerved investors. This week, however, China was singing a more conciliatory tune, saying it would apply to the World Trade Organization to overturn the tariffs. The US has imposed the tariffs under a national security provision, but China has argued that the move is a trade barrier with the intent of protecting domestic producers. Although the dispute has not been resolved, the Chinese move has eased tensions and restored investor risk appetite, in the hope that both the US and China will climb down from their trees and reach some agreement instead of imposing tariffs on each other.
Negotiations over the NAFTA agreement continue, and positive statements from US negotiators have raised hopes that a new agreement will be reached between Canada, Mexico and the US. A key sticking point has been a US demand to increase the US content in vehicles made in NAFTA members, but the Trump administration has apparently backed down on this requirement. The gloomy air around the talks has improved, and there is cautious optimism that the sides can hammer out a new agreement in the next few weeks.
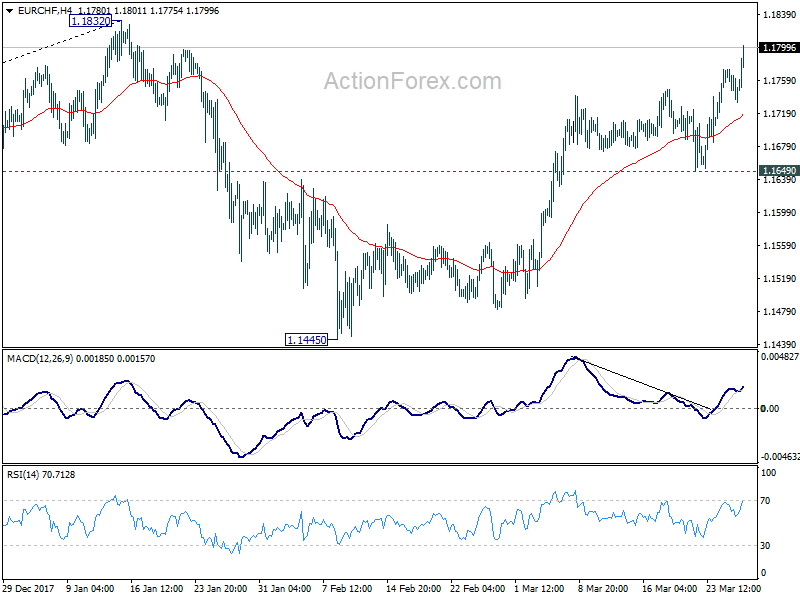
JPY and CHF lower as stocks rebound in premarket, EUR/CHF and GBP/CHF surge
US stocks futures reverse earlier loss and point to a higher open. The move was triggered by news that Facebook is going to streamline privacy settings. Facebook shares trade more than 1% higher in premarket. The development triggers intensified selling in JPY and CHF. Both are in deep red in 4H heatmap.
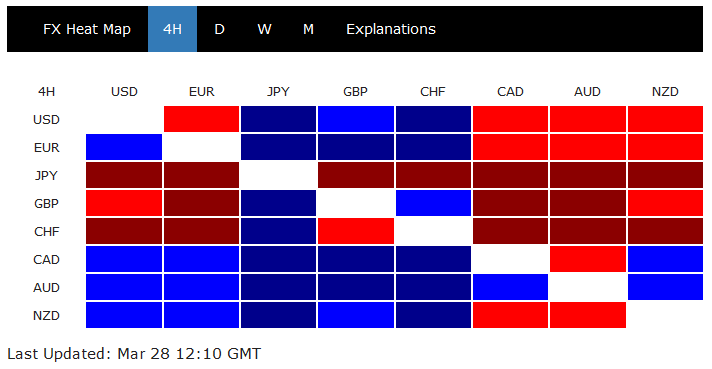 But for now, EUR/JPY is held well below 132.40 resistance, GBP/JPY below 150.92, and USD/JPY below 106.63. There is confirmation of bullish trend reversal in these pairs yet.
On the other hand, developments in CHF crosses look more promising. EUR/CHF is on track for a test on 1.1832 resistance.
GBP/CHF is even close to equivalent resistance at 1.3491.
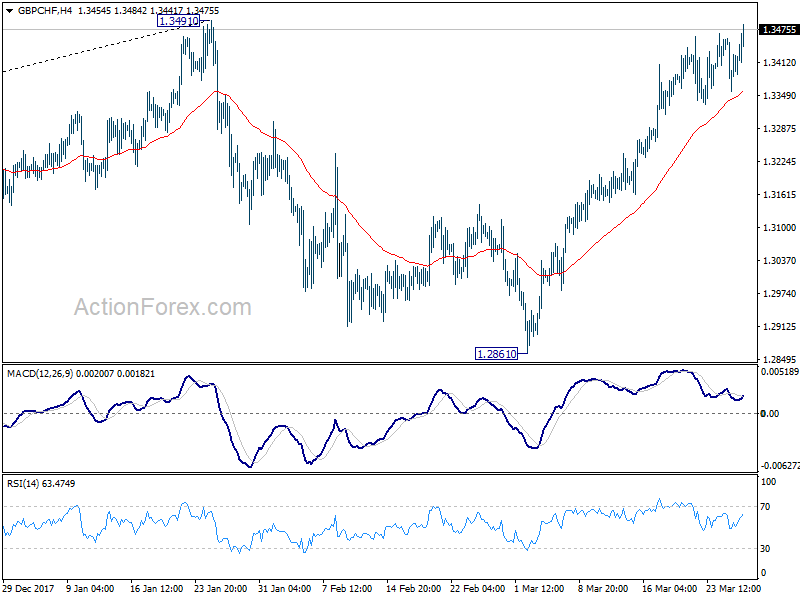 Based on current momentum, 1.1832 in EUR/CHF and 1.3491 in GBP/CHF could be taken out without much problem.
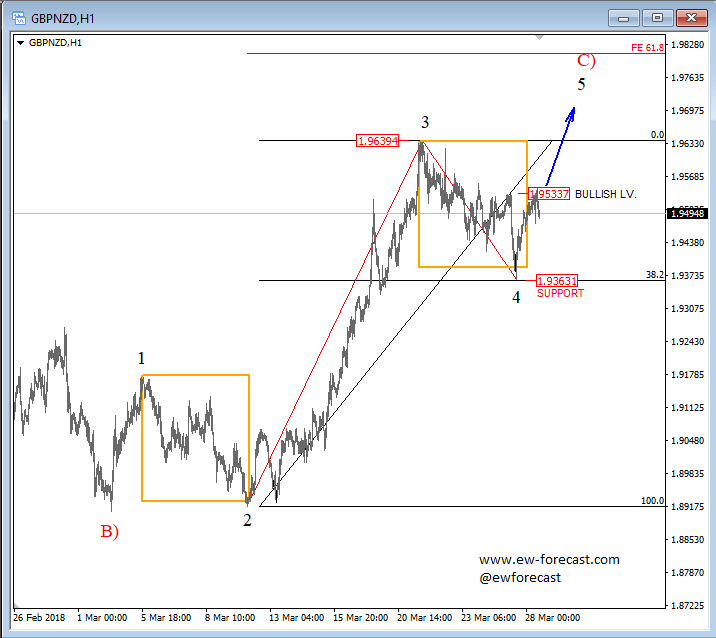
GBPNZD Having a Completed Correction and Eyeing For More Upside!
Good day traders, and welcome to a new update regarding the GBPNZD and its intra-day structure. Let's dig in!
On the hourly chart of GBPNZD we can see that price is unfolding a clear, impulsive probably five-wave structure, which we labelled as a higher degree wave C). If our analysis is correct, then we can see stronger pound in the next couple of trading sessions and possibly days. The reason why we think more upside may follow on the pair is a completed four-wave rally from the lows with the latest corrective leg from 1.9639 representing wave 4. Wave 4 is the fourth wave of an impulse, so if we have a completed wave 4 at the 1.936 support then current intra-day recovery can be final wave 5 in the making, which can take price even towards the 1.9760-1.9830 region. However, watch out for a bearish reversal, once wave 5 of C) fully shows up!
GBPNZD, 1h