Sample Category Title
Eco Data 3/28/18
[php_everywhere instance="1"]
Pound Dips as US Dollar Shows Broad Gains
The British pound has headed lower in the Tuesday session, erasing most of the gains seen on Monday. In North American trade, GBP/USD is trading at 1.4162, down 0.48% on the day. In the UK, the Financial Policy Committee released the minutes of its March meeting. In the US, CB Consumer Confidence dropped to 127.7, missing the forecast of 131.2 points. As well, the Richmond Manufacturing Index dropped sharply to 15 points, well off the estimate of 23 points. On Wednesday, the US releases Final GDP and the UK publishes CBI Realized Sales and GfK Consumer Confidence.
The Financial Policy Committee (FPC), which looks at the financial stability in the UK, took note of the likelihood of rate hikes during the year. In the minutes, policymakers stated that most households can afford their mortgages at current rate levels of 0.50%, but would have trouble if rates climbed to 2% or higher. The BoE is widely expected to raise rates by a quarter point in May, to 0.75 percent. Years of low rates have resulted in high levels of mortgage debt as well as consumer debt, and the FPC minutes are a clear signal that the BoE will need to factor in the impact on consumers as part of its rate policy.
The tariff spat between China and the US has shaken up global stock markets and also caused volatility in the currency markets. The US dollar lost ground after President Trump slapped stiff tariffs on Chinese products last week. However, fears of a global trading war which could spark a worldwide recession have eased this week, and the US dollar is higher, as investor risk appetite has improved. This follows the Chinese decision to file applications with the World Trade Organization regarding the tariffs, a move which could lead to an amicable resolution of the tariff spat between the two largest economies in the world.
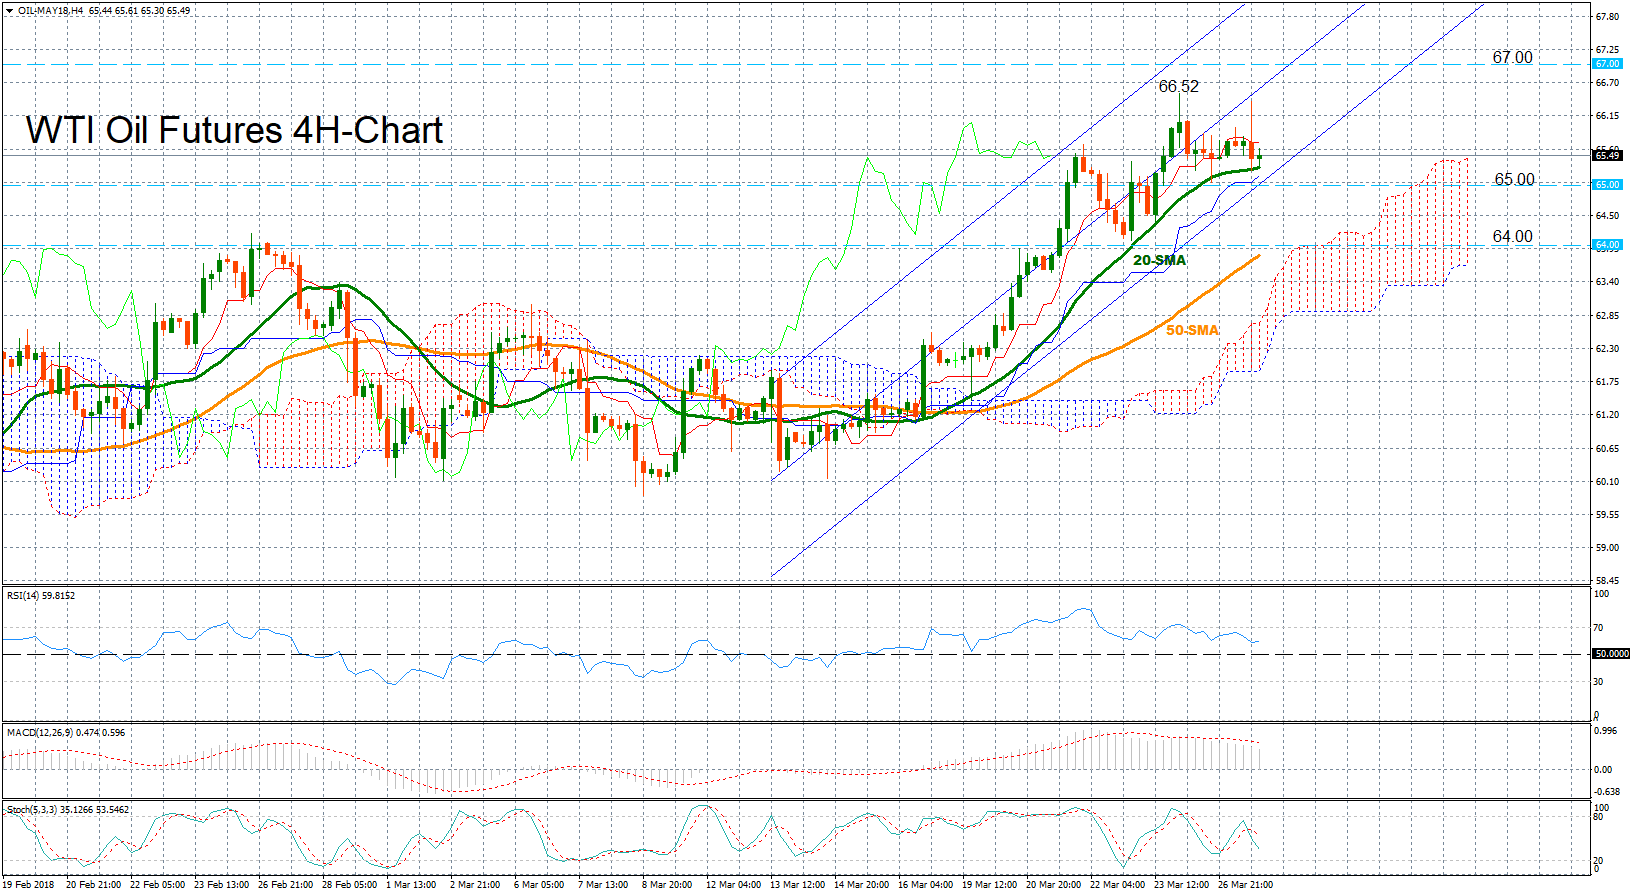
WTI Oil Futures Maintain Upward Pattern; Could Weaken in Short-Term
WTI oil futures for May delivery look fairly bullish in the 4-hour chart, continuing to trade inside an ascending channel since the mid of March. Yesterday the market touched a two-month high at 66.52, coming closer to break the three-year peak of 66.63 hit around the end of January.
Looking at momentum indicators, the RSI has slowed down further today after touching overbought territory yesterday, signaling that the market could weaken in the near-term. Stochastics have already posted a bearish cross, with the blue %K line moving below the red %D line, while the MACD continues to lose strength below its red signal line but still holds in positive territory, the latter being indicative of a positive trend. Yet, as long as the market continues to develop far above the Ichimoku cloud and the bullish cross between the 20- and the 50-period simple moving averages stays in place, the trend is likely to remain on the upside.
In case prices decline, the 20-period SMA, which currently stands at 65.28 could offer nearby support as it did in the past two weeks. A big step below from here could drive prices down to the bottom of the channel to the 65.00 key-mark, while a substantial close under this level could trigger the start of a downtrend. Then from here, the focus could shift to the 64.00 handle.
Alternatively, a push higher could meet today’s peak of 66.38, which lies near the middle of the channel. Further above, the attention could turn to the previous top of 66.52 which if broken could open the way towards the three-year high of 66.63 and the 67.00 psychological level.
US Final GDP for Q4 among the Few Events for USD this week
The US will release the final estimate of GDP for Q4 2017 on Wednesday, at 1230 GMT. While these data may be viewed as somewhat outdated given that Q1 is now almost over, they could still gather some attention in a quiet calendar week, especially in case of a notable deviation from what is anticipated.
The US economy has been humming along nicely in recent quarters, growing at a pace of more than 2%, as a robust labor market and healthy consumer spending remained the pillars of economic expansion. The final reading of GDP for Q4 is expected to confirm that, by revising economic growth higher to a 2.7% annualized rate, from 2.5% in the second estimate. The anticipated upward revision is probably owed to stronger-than-expected construction spending and manufacturer inventories data that were released after the second estimate of Q4 GDP. Alongside the GDP print, the US will also release the final core PCE price index for Q4, though this is projected to remain unrevised at 1.9% annualized.
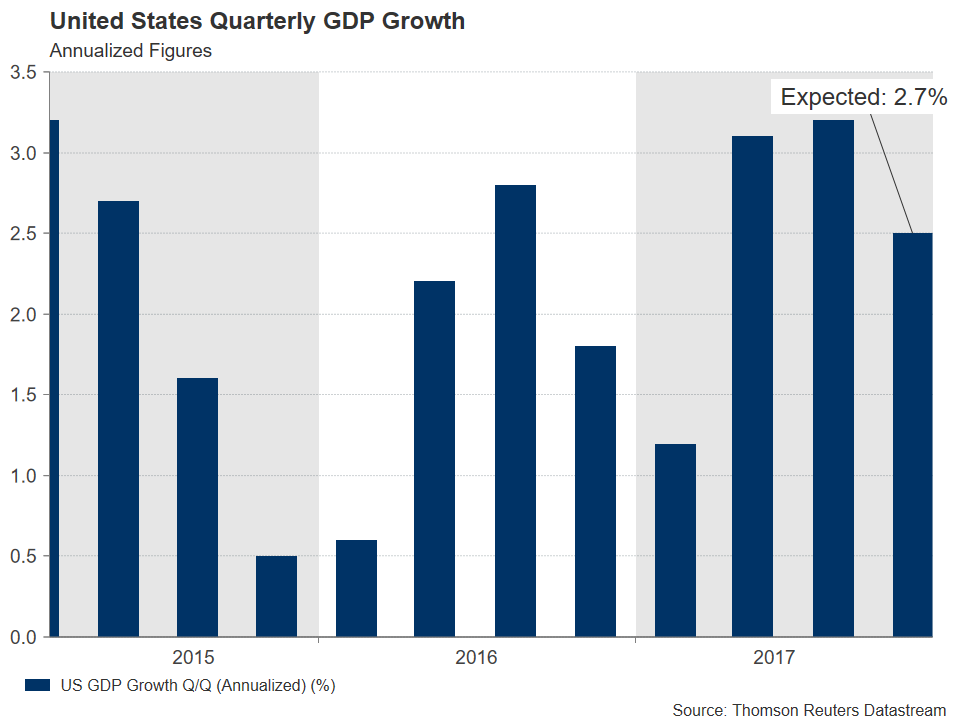 Remember these data only refer to the quarter ending in December, so they will not capture any positive-growth effects arising from the recently-passed tax cuts, nor any negative effects owed to the latest uncertainties over global trade. Investors looking for such impacts will probably have to wait for the release of the first estimate of GDP for Q1 2018, due in late April.
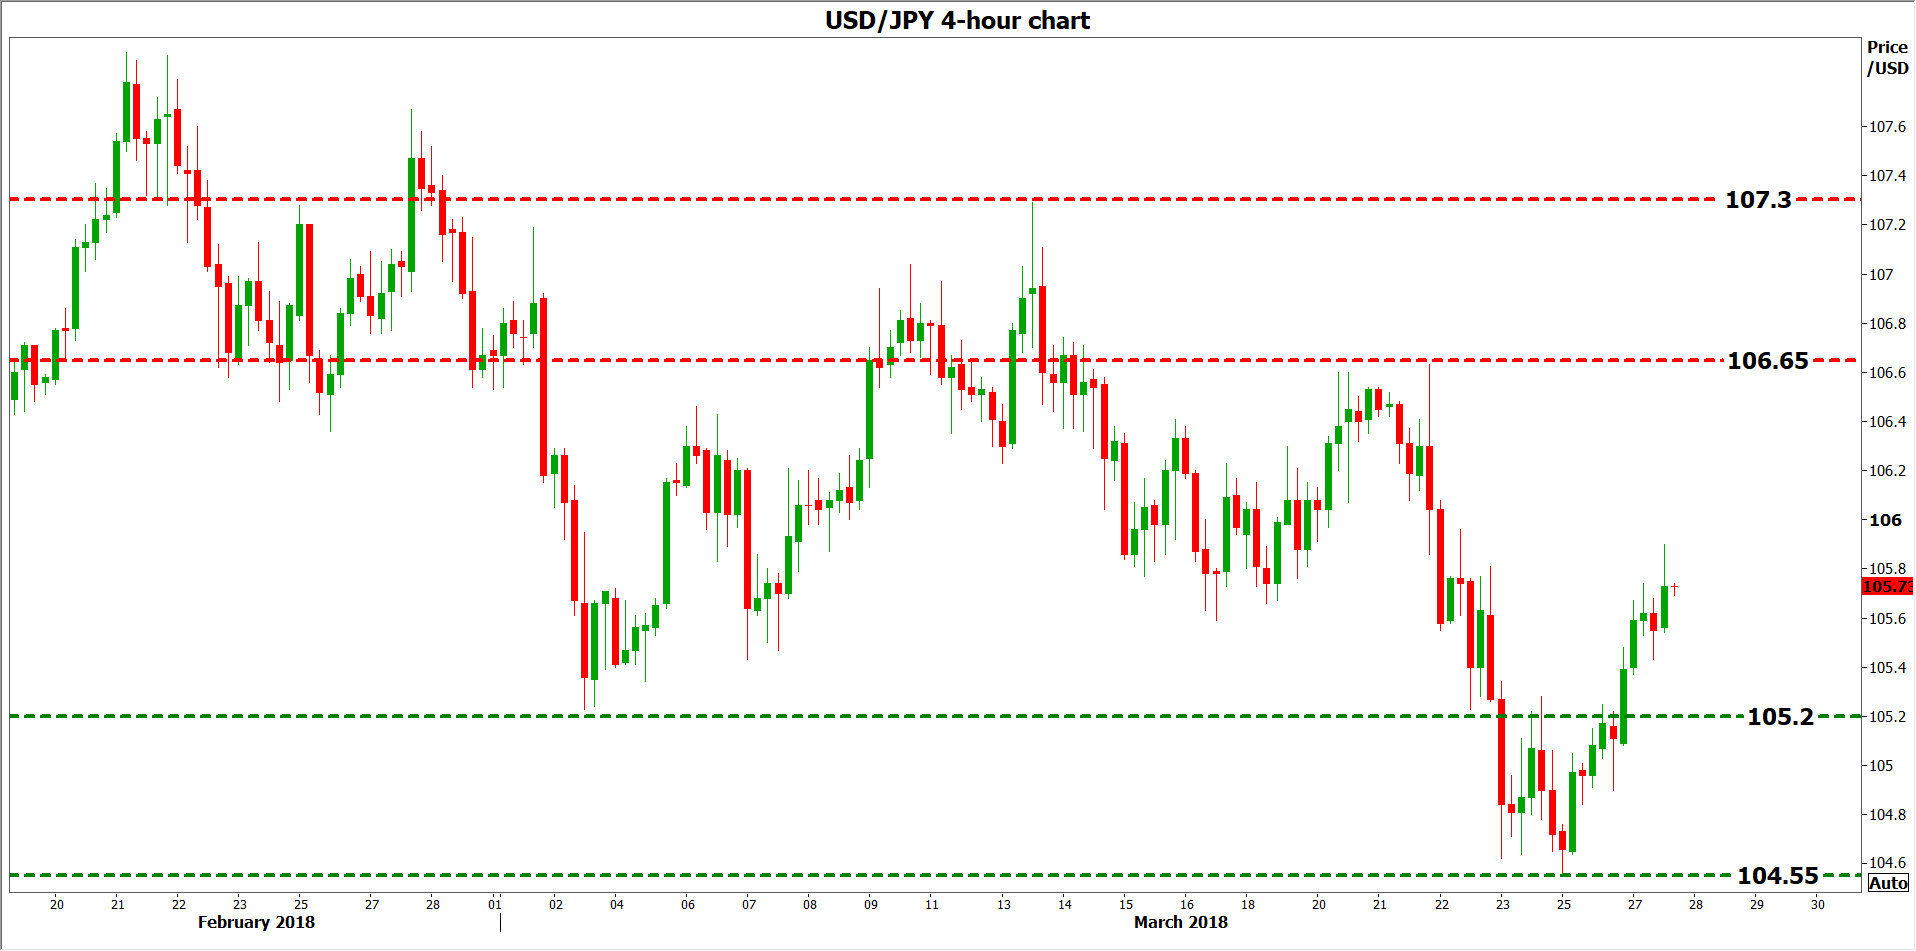
Still, the Q4 data could attract some attention, considering how quiet the economic calendar is this week. Following the latest Fed rate hike, markets see practically no chance of another move at the next meeting in May, but see a 78% probability for a hike at the gathering after that, in June. A higher-than-anticipated revision in the final GDP print could amplify the case for a June hike and thereby, help the dollar recover somewhat. Dollar/yen may spike higher and aim for a test of the 106.65 territory, marked by the March 21 highs. A potential upside break of that area could open the way for a test of the March 13 top, at 107.30.
Conversely, a disappointment in these data – for example growth staying unrevised at 2.5% – could bring the US currency under renewed selling interest. Dollar/yen could edge lower and test the 105.20 barrier, identified by the March 2 lows. If the bears manage to break below that zone, support may be found near the pair’s recent lows, at 104.55.
 Finally, perhaps the most important drivers for the dollar’s near-term direction will be the core PCE price index, as well as personal income and spending figures for February, all of which will be released on Thursday. Besides data, any updates on the trade front will also be crucial for the greenback. Intensifying trade concerns usually cause flows into US Treasuries, resulting in lower US yields and hence, a weaker US currency.
Japanese Yen Dips as Tariff Tensions Ease
USD/JPY has posted gains in the Tuesday session, continuing the upward movement we saw on Monday. In the North American session, USD/JPY is trading at 105.61, up 0.20% on the day. On the inflation front, Japanese Services Producer Price Index ticked lower to 0.6%, missing the forecast of 0.7%. The Bank of Japan Core CPI remained unchanged at 0.8%, edging above the estimate of 0.7%. In the US, CB Consumer Confidence dropped to 127.7, missing the forecast of 131.2 points. As well, the Richmond Manufacturing Index dropped sharply to 15 points, well off the estimate of 23 points. On Wednesday, the US releases Final GDP and Japan will publish Retail Sales.
The tariff spat between China and the US has shaken up global stock markets and also caused volatility in the currency markets. The safe-haven Japanse yen gained 1.2% last week and hit 5-month highs, as risk appetite sagged after US President Trump slapped tariffs on China on Thursday. However, fears of a global trading war which could spark a worldwide recession have eased this week, and the yen is lower, as investor risk appetite has improved. This follows the Chinese decision to file applications with the World Trade Organization regarding the tariffs, a move which could lead to an amicable resolution of the tariff spat between the two largest economies in the world.
Japanese inflation remains around 1 percent, well below the Bank of Japan target of around 2 percent. BoJ officials have consistently said that it will not reduce its ultra-accommodative monetary policy until inflation moves closer to target. With the rebound in the Japanese economy, there has been speculation that the BoJ could tighten its policy, which could cause some volatility from the yen.
US durable goods reports ended the week on a high note, but the dollar still lost ground on Friday. Core Durable Goods Orders rebounded with a strong gain of 1.2%, crushing the estimate of 0.5%. This marked the strongest gain since July 2016. Durable Goods Orders jumped to an 8-month high, with a gain of 3.1%. The reading easily beat the forecast of 1.6%. The US manufacturing sector continues to expand at an impressive clip, a result of stronger global growth and a cheaper US dollar, which makes US goods less expensive for foreign buyers.
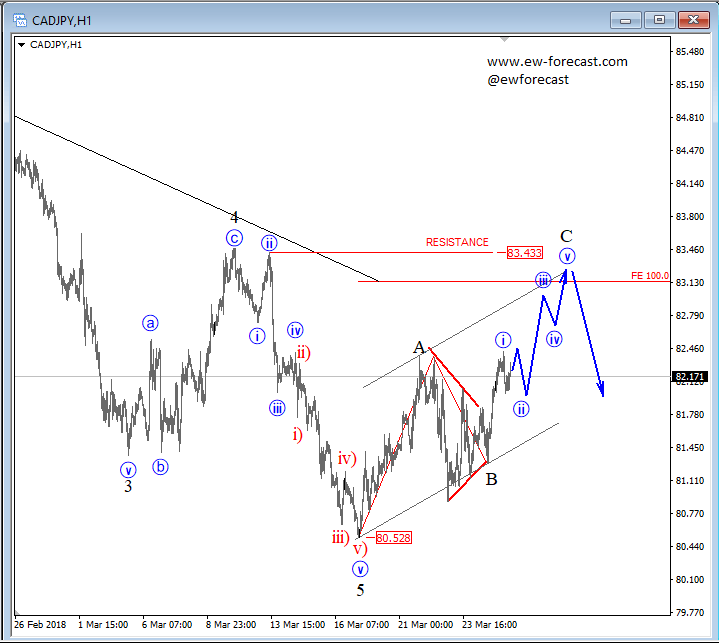
Elliott Wave Analysis: CADJPY Unfolding A Three-Wave Correction; 83.40 Offers Resistance
CADJPY is rising for the past few weeks, away from 80.53 level where we labelled end of a bigger wave 5 and a bigger bearish cycle. Now, the current three-wave rise that can be in the making we see it as corrective, meaning we think the price can slowly slow down and later make a new reversal to the downside. As we can see our first wave A and our second wave B fully shown up, and the most interesting thing involves wave B, where an EW triangle unfolded. As we know a triangle unfolds only prior to the final wave, meaning only one more push higher can follow on the pair, before we may see a new turning point. Ideally, we now see wave C in progress, which can see limited upside and a reversal near the 83.13-83.43 level, and near the upper channel line.
CADJPY, 1H
Sunset Market Commentary
Markets
Global core bonds eked out small, technically insignificant, gains today. End-of-month extension buying, rather soft ECB comments and disappointing EMU eco data (see below) suggested that Bund gains could have been bigger. European stock markets opened very strong, but hovered near those levels afterwards. US stock markets continue to build on the freezing of trade tensions between the US and China. The US yield curve bull steepens at the time of writing with yields 2 bps (2-yr) to 1 bp (30-yr) lower. Changes on the Germany yield curve vary between -0.5 bps (2-yr) and -1.1 bp (5-yr). The belly of the curve outperforms the wings. Peripheral yield spreads vs Germany narrow up to 4 bps (Greece, Portugal).
The euro had a good run yesterday as a better risk sentiment mostly supported non-USD currencies, excluding USD/JPY. EUR/USD took a breather in Asia this morning. At the start in Europe, it looked that a further rise in equities would also lead to a further congruent rise of USD/JPY, EUR/JPY and EUR/USD. The latter filled offers in the 1.2475 area. However, the euro rally stalled. We didn't see a specific trigger or event. Interest rate differentials were little changed. EC confidence data were softer than expected. They weren't the trigger for the move, but provided a good excuse for some additional selling. Both EUR/USD and EUR/JPY had lost more than half a big figure around noon. The move was also due to some improvement in dollar sentiment (both DXY and USD/JPY were upwardly oriented). The price pattern from Europe basically persisted early in US dealings. EUR/USD trades currently slightly below 1.24. USD/JPY is changing hands around 106.75. Over the previous days USD softness prevailed. This picture is tentatively amended today.
Sterling performed quite well over the previous days. Brexit uncertainty moved to the background and the market focus was on a potential BoE rate hike in May. However, the sterling rally ran into resistance today, both against the euro and against the dollar. In order-driven trade, EUR/GBP captured a strong bid, despite a downside intraday reversal of EUR/USD. End of month related buying might have been in play. Whatever the reason, EUR/GBP returned to the high 0.87 area, but a further easing of EUR/USD finally capped the rally. EUR/GBP trades currently near 0.8770. Last week's downside test is rejected. The 0.8652/0.8968 ST consolidation pattern is again in place. Cable also reversed yesterday's rebound.
News Headlines
Lending to non-financial corporations grew just 3.1% in February, slowing from a post-crisis high of 3.4%. The annual growth rate of the M3 measure of money supply, seen by some as a precursor of economic activity, was 4.2%, below 4.6% consensus. EC confidence data disappointed in March, with the headline reading declining from 114.2 to 112.6 (113.3 forecast). Spanish inflation accelerated less than expected in March, from 1.2% Y/Y to 1.3% Y/Y (1.5% Y/Y expected).
Most ECB governors sounded rather dovish today. ECB Makuch said that he saw no convincing signs at this stage that inflation will return to the central bank's 2% target. ECB Nowotny indicated that the central bank doesn't want to shock markets by ending APP at once at the end of September 2018. However he sees a clear possibility to reduce stimulus afterwards. ECB Liikinen warned that "A gradual tightening of monetary policy will rest on a more solid basis when indications of inflation rates to potentially temporarily exceed 2% become more prominent in inflation expectations". ECB Vasiliauskas indicated that the ECB can probably agree with the market forecast of a change in interest rate in the first half of 2019.
US consumer confidence dropped moderately in March, dollar and stock lack direction
US Conference Board consumer confidence dropped moderately in March to 127.7, missing expectation of 131.0 But it stayed close to 18 year high at 130 in February.
Reaction to the data is muted though. Dollar rebounded earlier today, but it's struggling to extend gain in US session so far.
 Stocks also struggle to find a direction as DOW is trading nearly flat.
USDJPY: Remains On Corrective Recovery Higher
USDJPY: The pair extended its recovery on Tuesday opening the door for more strength to occur. On the downside, support lies at the 105.00 level where a break if seen will aim at the 104.50 level. A cut through here will turn focus to the 104.00 level and possibly lower towards the 103.50 level. On the upside, resistance resides at the 106.00 level. Further out, we envisage a possible move towards the 106.50 level. Further out, resistance resides at the 107.00 level with a turn above here aiming at the 107.50 level. On the whole, USDJPY faces further upside pressure on recovery.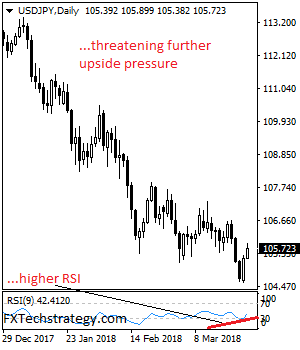
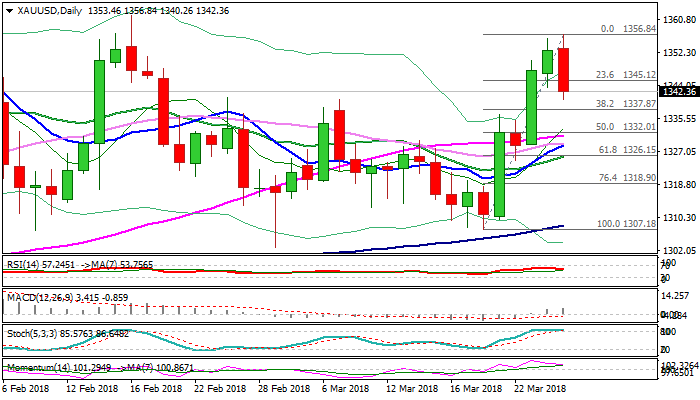
Spot Gold – Pullback on Stronger Dollar Faces Strong Support from Thick Daily Cloud Top
Spot Gold pulled back from new high at $1356 (the highest since 16 Feb) on Tuesday, as fresh strength of the US dollar on hopes that stronger conflict between US and China regarding tariffs could be avoided, pressured yellow metal’s price.
Renewed risk appetite reduced demand for safe-haven assets, resulting in gold price falling around 1% so far.
Pullback tested support at $1340 (former highs of 26 Feb/07 Mar) and pressures strong supports at $1337/35 (Fibo 38.2% of last week’s $1307/$1356 rally/daily cloud top) break of which could generate stronger bearish signal for extend correction.
Slow stochastic is reversing in overbought territory on daily chart and would additionally support fresh bears.
However, daily techs are in full bullish setup and current pullback looks like corrective action ahead of fresh upside, with extended dips to be ideally contained by the top of thick daily Ichimoku cloud.
Bearish scenario sees penetration of daily cloud and test of cluster of MA supports between $1331 and $1325, break of which is needed to confirm reversal.
Res: 1345; 1350; 1356; 1361
Sup: 1340; 1337; 1335; 1331