
Sample Category Title
Gold Price Back In Bullish Zone Above $1,340
Key Highlights
- Gold price made a nice upside move and traded above the $1,330 and $1,340 resistances against the US Dollar.
- There was a break above a crucial contracting triangle with resistance at $1,318 on the 4-hours chart of XAU/USD.
- The Chicago Fed National Activity Index (CFNAI) posted a rise from 0.02 (revised) to 0.88 in Feb 2018.
- Today, the S&P/Case-Shiller Home Price Indices report (Jan 2018) will be released, which is expected to register a rise of 6.2% (YoY).
Gold Price Technical Analysis
There was a solid support formed near $1,306 in gold price against the US Dollar. The price traded higher and broke the $1,330 and $1,340 resistance levels.
During the upside move, the price cleared the 50% Fib retracement level of the last downside move from the $1,340.47 high to $1,306.90 low. More importantly, there was a break above a crucial contracting triangle with resistance at $1,318 on the 4-hours chart of XAU/USD.
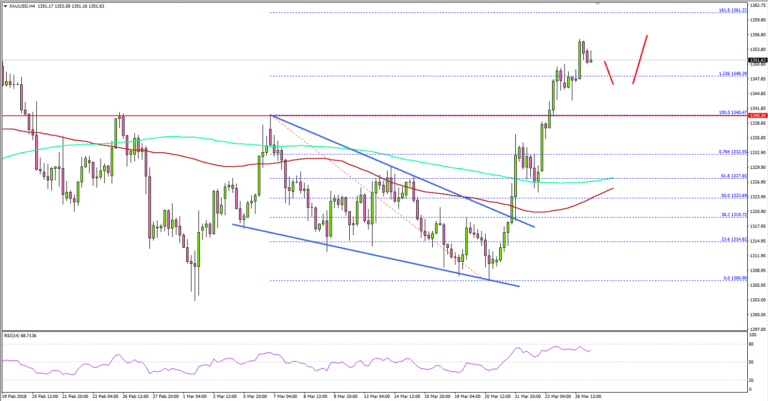
The upside move was strong and the price succeeded in settling above the $1,330 level, 200 simple moving average (green, 4-hour) and the 100 simple moving average (red, 4-hour).
Lastly, there was a break above the last swing high of $1,340. These all are positive signs. If buyers remain in control, the price could test the 1.618 Fib extension level of the last downside move from the $1,340.47 high to $1,306.90 low.
On the downside, the broken resistance at $1,340 is likely to act as a support. The most important support is close to the $1,328 level and the 200 simple moving average (green, 4-hour).
Overall, the market sentiment is positive and the price is likely to remain in a bullish zone above the $1,340 support level.
Economic Releases to Watch Today
- Euro Zone Business Climate Index for March 2018 – Forecast 1.40, versus 1.48 previous.
- Euro Zone Economic Sentiment Indicator for March 2018 – Forecast 113.4, versus 114.1 previous.
- S&P/Case-Shiller Home Price Indices for Jan 2018 (YoY) – Forecast +6.2%, versus +6.3% previous.
Goldman Sachs bullish on gold price, and our technical view on XAU/USD
Goldman Sachs published a note that's bullish on gold price yesterday and expected it to outperform over the coming months. It's forecasting four Fed hikes this year, which is one more than FOMC's own projection. And the bank admitted that its upbeat view on gold is "counter-intuitive".
However, the report pointed to empirical data for the past six tightening cycles of Fed, and found gold has "outperformed post rate hikes four times". And according to their analysts, "the dislocation between the gold prices and US rates is here to stay".
It added that the bullish view was also driven by higher inflation, rising EM wealth and increased risk of equity correction. Also, it's a likely a function of investors "waiting on the sidelines" and the becoming interested in Gold again once the tightening "catalyst" has passed.
Our technical view
From our technical view, gold's recent jump from 1307.32 suggests that consolidation pattern from 1366.05 has completed. And, rise from 1236.66, and the larger choppy up trend, is ready to resume. Based on the near term pattern, Gold will likely target 100% projection of 1236.66 to 1266.05 from 1307.32 at 1436.07.
 However, bear in mind that gold is now close to an important long term fibonacci level. That is, 38.2% retracement of 1920.94 to 1046.54 at 1380.56. Gold failed this fibonacci resistance once back in 2016. And felt heavy approaching it twice since then. Add that to the fact that rise from 1122.81 is clearly not impulsive looking. For now, we'd be skeptical on gold bullish momentum ahead. And 61.8% projection of 1236.66 to 1266.05 from 1307.32 at 1386.88 is the hurdle to overcome.
Fed Mester supports gradual rate hike, against a steep path
Cleveland Fed President Loretta Mester she supports gradual rate hike "this year and next year". At the same time, she's "against a steep path" in tightening because "we want to give inflation time to move back to goal". She sounds optimistic saying that "this year is shaping up to be another good year for the economy." And for monetary policymakers, the task is to "calibrate policy to this healthy economy so that the expansion is sustained."
The government's tax cut poses "some upside risk" to the forecast, and Mester expects a better read on household spending "over the next several months". Globally, she noted that "for the first time in many years, economic activity around the world is picking up and forecasts for global growth are being revised up." And, "this should have a positive feedback effect on the U.S. economy via exports."
Meanwhile, she warned that trade developments are a "risk to the forecasts". And the uncertainty "may not be resolved quickly". But it didn't change her outlook for the over economy yet.
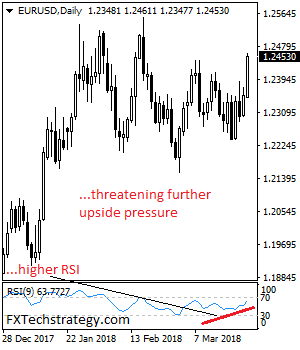
EURUSD – Faces Further Upside Pressure
EURUSD - The pair looks to follow through higher on the back of Monday strong gain. On the upside, resistance comes in at 1.2500 level with a cut through here opening the door for more upside towards the 1.2550 level. Further up, resistance lies at the 1.2600 level where a break will expose the 1.2650 level. Conversely, support lies at the 1.2400 level where a violation will aim at the 1.2350 level. A break of here will aim at the 1.2300 level. Below here will open the door for more weakness towards the 1.2250. All in all, EURUSD faces further upside recovery threats.
Jump First Ask Later
Jump first ask later
U.S. stocks surged higher Monday, as Trade war concerns appear to have decreased, with both China and the US suggesting that solutions to the trade impasse may be forthcoming.
Over the weekend and on Monday, there were productive backroom negotiations to ease trade tensions between the US and China and the markets naturally fed on this positivity. Indeed markets were positioning for an epic equity plunge but instead were left monumentally unwinding equity market shorts. But keep in mind big positive moves in stock markets do start with massive short covering rallies so we could be in for a significant extension.
Mnuchin said. “I’m cautiously hopeful we reach an agreement.” So equity investors do what they have done best this year, and with a great deal of success mind you, jump first ask later.
But markets have been at the mercy of the trade rumour mills, and with the sparse economic this week they continue to be so but remain bizarrely singularly focused on trade. In fact, even ignoring a good risk aversion signal when over 100 Russian diplomats were expelled from Nato countries after the fallout from the UK poisoning scandal. But perhaps correctly so as the markets have been relishing the fact that there was no swift and potential market establishing trade response from China. Obviously, one road no one wanted to go down.
Oil Markets
Oil traders are catching their breath after last week bullish run. But more significantly, we’re nudging against considerable resistance levels USD 70 Brent USD 67 WTI, areas where there’s thought to be a higher propensity for US shale producers to come back online.
While US Baker Hughes rig counts tend to lose influence amidst the waves of heightened geopolitical risk, the rig count numbers are moving ever so close to the 1000 mark, which is raising some concerns over increased production level.
But with the drop in last weeks inventory data, traders were positioning more aggressively premised on sensitivity to geopolitical risk factors, but even despite few bearish signals, and an apparent truce in the trade wars, oil traders are respecting these levels and banking profits while taking some overextended risk off the table.
Gold Markets
Gold prices continue to ratchet higher as the US dollar weakens despite equity markets rebounding on easing concerns about the likelihood of a trade war between China and USA. But realistically there are plentitudes of market turmoil in the making that continue to make gold the go-to place to hedge risk. Middle East tension remains on the boil, and the NATO expulsion of Russian diplomats would typically be an excellent risk-off trade and worth monitoring for a possible escalation
Currency Markets
The dollar is getting whacked with the nasty stick, but hardly surprising as the bar for USD dollar strength remains incredibly low.
The Euro
After being stuck in the mud the past month the break above 1.2400 provided a powerful signal and suggested the markets are looking to get back into riding a possible ECB shift in policy
The Japanese Yen
Opportunity in the making as the USDJPY should stand the most to gain for USD dollar weakness. However, the street has been unwinding over subscribed short USDJPY risk hedges which have been dominating flow. Complicating matters is a holiday-shortened week which from a liquidity perspective will throw a bit of a monkey wrench into the works. But tempting to re-engage shorts none the less.
The Malaysian Ringgit
The stars are beginning to align again with the Ringgits fortunes especially with the market under-positioned MYR should see the Ringgit grind towards the 3.87 level
Look for equity and bond inflow to accelerate as risk on takes over the market while buoyant oil prices provide ancillary support
Risk Trades Roar
A softened tone from China sparked a complete reversal of Friday's worries in a massive rally for stock markets. The New Zealand dollar was the top performer while the yen lagged. The Asia-Pacific calendar is light but new RBNZ governor Adrian Orr may make comments has he takes up the role. Below is the weekly video for Premium subscribers, shedding light on the remaining 7 trades.
What a difference a weekend makes. Chinese Premier Li Keqiang promised China would open up further and eliminate technology transfers along with balanced trade. Signs of a concession towards the US sparked a massive reversal in risk trades and the biggest one-day rally in US equities since 2015.
The S&P 500 gained 70 points, or 2.7%, to 2658 in a jump from the 200-day moving average. FX wasn't quite as euphoric as yen crosses climbed around 1% but they weren't as negative on the way down either. The drop and reversal underscores how sensitive the market is to trade at the moment. It's overshadowing nearly everything else.
Despite a diminished threat of a trade war, the US dollar still suffered on most fronts. Technically, the euro broke above the March high to the best since Feb 15. Cable climbed to the highest since Feb 1 and is approaching a cluster or resistance around the 2018 highs.
Who Faces the Risk of Collateral Damage from U.S. Tariffs?
Some countries could be indirectly affected by a Sino-American trade war via their exports to China, which are assembled into final products and re-exported to the United States.
Taiwan Appears to Have the Most to Lose
The bilateral trade deficit that the United States incurs with China has widened significantly over the past two decades (top chart). Indeed, the red ink that the United States racked up with China totaled $375 billion in 2017, nearly one-half of the total American trade deficit in goods last year.
Due in part to this bilateral trade deficit, the Trump administration recently announced tariffs on Chinese goods that will affect at least $50 billion worth of goods, and China has responded with some modest retaliatory measures. In a worst case scenario, tit-for-tat retaliation, should it develop, could spiral into an all-out trade war between the world's two largest economies. China generally imports raw materials and unfinished products, assembles the inputs and exports finished goods. As shown in the middle chart, China incurs sizeable deficits in trade in primary products and large surpluses in trade in manufactured goods. In the event of a trade war, Chinese exports to the United States could be significantly affected. Consequently, countries that export raw materials and intermediate inputs to China could be indirectly affected by a Sino-American trade war. Which countries would be most at risk of collateral damage?
To answer this question, we turned to the Trade in Value Added (TiVA) database that is compiled by the Organisation for Economic Cooperation and Development (OECD). Our analysis shows that Taiwan would be the economy with the most to lose from a trade war between mainland China and the United States (bottom chart). Specifically, products that are exported from Taiwan to the mainland, assembled into final products and subsequently re-exported to the United States account for 1.5 percent of total value added in Taiwan. This finding makes intuitive sense due to the significant amount of exports from Taiwan to the mainland, which in 2017 totaled almost $90 billion (nearly 30 percent of total Taiwanese exports). Taiwan is followed by Korea, Malaysia and Hong Kong. With the exception of Chile, South Africa and Costa Rica, all the countries with the most indirect export exposure to the United States (via exports to China) are in Asia.
There are some caveats to keep in mind. First, the most recent data in the TiVA database are from 2011. (The database is very extensive, and the OECD does not update it on a regular basis.) Given solid growth in Chinese exports to the United States since 2011 - they grew 4 percent per annum between 2011 and 2017 - indirect export exposure to the United States is probably a bit higher today than in 2011. That said, none of the countries in the bottom chart, with the possible exception of Taiwan, have so much indirect export exposure to the United States that they would be at risk of recession from a Sino-American trade war. And if cooler heads prevail in Washington and Beijing, then the risk of even a modest slowdown in economic growth in those countries would recede even further.
Eco Data 3/27/18
[php_everywhere instance="1"]
XAU/USD – Gold Rally Continues on Tariff Jitters
Gold has posted considerable gains in the Monday session, after recording sharp gains on Friday. In North American trade, the spot price for an ounce of gold is $1355.40 up 0.55% on the day. There are no data releases on the schedule. The markets will be listening closely to speeches from three FOMC members – William Dudley, Loretta Mester and Randal Quarles. On Tuesday, the key events is CB Consumer Confidence.
US durable goods reports ended the week on a high note, but the dollar still lost ground on Friday. Core Durable Goods Orders rebounded with a strong gain of 1.2%, crushing the estimate of 0.5%. This marked the strongest gain since July 2016. Durable Goods Orders jumped to an 8-month high, with a gain of 3.1%. The reading easily beat the forecast of 1.6%. The US manufacturing sector continues to expand at an impressive clip, a result of stronger global growth and a cheaper US dollar, which makes US goods less expensive for foreign buyers.
Are we headed for a global trade war? There are some worrying signs, as US President Trump slapped 25% tariffs on up to $60 billion worth of Chinese imports on Thursday. Trump said that the tariffs are needed to address the massive trade deficit with China, which stands at $375 billion. For its part, China wasted no time in threatening to retaliate, saying it was planning to impose tariffs on 128 US products, which would amount to $3 billion in imports. The tariffs directed against China come on the heels of tariffs on steel imports coming into the US, although the US has promised exemptions to the EU and other trading partners. There is serious concern that these moves could ignite a global trade war, and if the US tariffs remain in place, as downturn in the Chinese economy could spread and possibly a global recession.
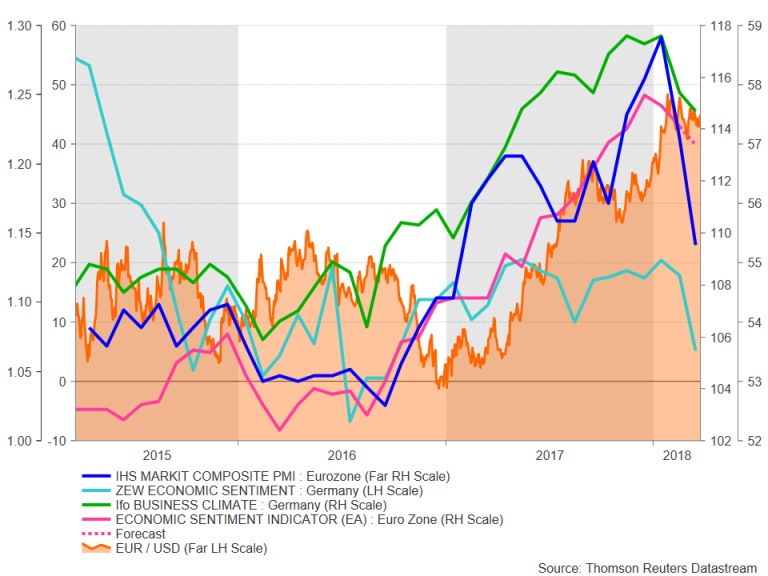
Eurozone Economic Sentiment Expected to Ease in March; Will the Euro Follow Lower?
As the euro races past the $1.24 level again, recent data out of the Eurozone does not appear to support this renewed bullishness for the single currency. Business confidence gauges for the region are all pointing to a softening in economic activity during the first quarter of 2018, with the March data, in particular, showing a notable slowdown. The European Commission’s economic sentiment index due on Tuesday will be the last of the major surveys for March and will likely join the others in dipping downwards.
The economic sentiment index is expected to decline from 114.1 in February to 113.4 in March, which would make it a six-month low. It’s sub-components, the business climate, industrial sentiment and services sentiment indices are also forecast for a fall in March. Only the consumer confidence measure is not expected to decline and instead to remain unchanged at February’s level.
 Investors do not yet seem worried about the apparent slowdown as most economists still expect the euro area economy to expand by 0.7% quarter-on-quarter in the first three months of the year – slightly above the prior quarter’s 0.6% rate. Also, some easing in momentum is to be expected given the steady acceleration in growth and business confidence throughout 2017.
However, with Europe’s recovery in a large part being driven by rising exports, growing trade tensions have already started to dampen business morale across the bloc, especially in Germany. Should the tensions escalate into a full-blown trade war with the United States as well as with China (note that like the US, the European Union is also unhappy about China dumping cheap steel into European markets), the Eurozone recovery could become at risk. Another reason for the slowdown could be the stronger euro. IHS Markit reported a sharp drop in Eurozone export orders in its report for the March flash composite PMI.
On the positive side, with the German coalition deal now in place, the timing is ripe for Chancellor Angela Merkel and France’s Emmanuel Macron to press ahead with Eurozone reforms. And with Brexit talks now making progress as well, investor optimism for the region is unlikely to deteriorate dramatically even if trade war risks were to materialize.
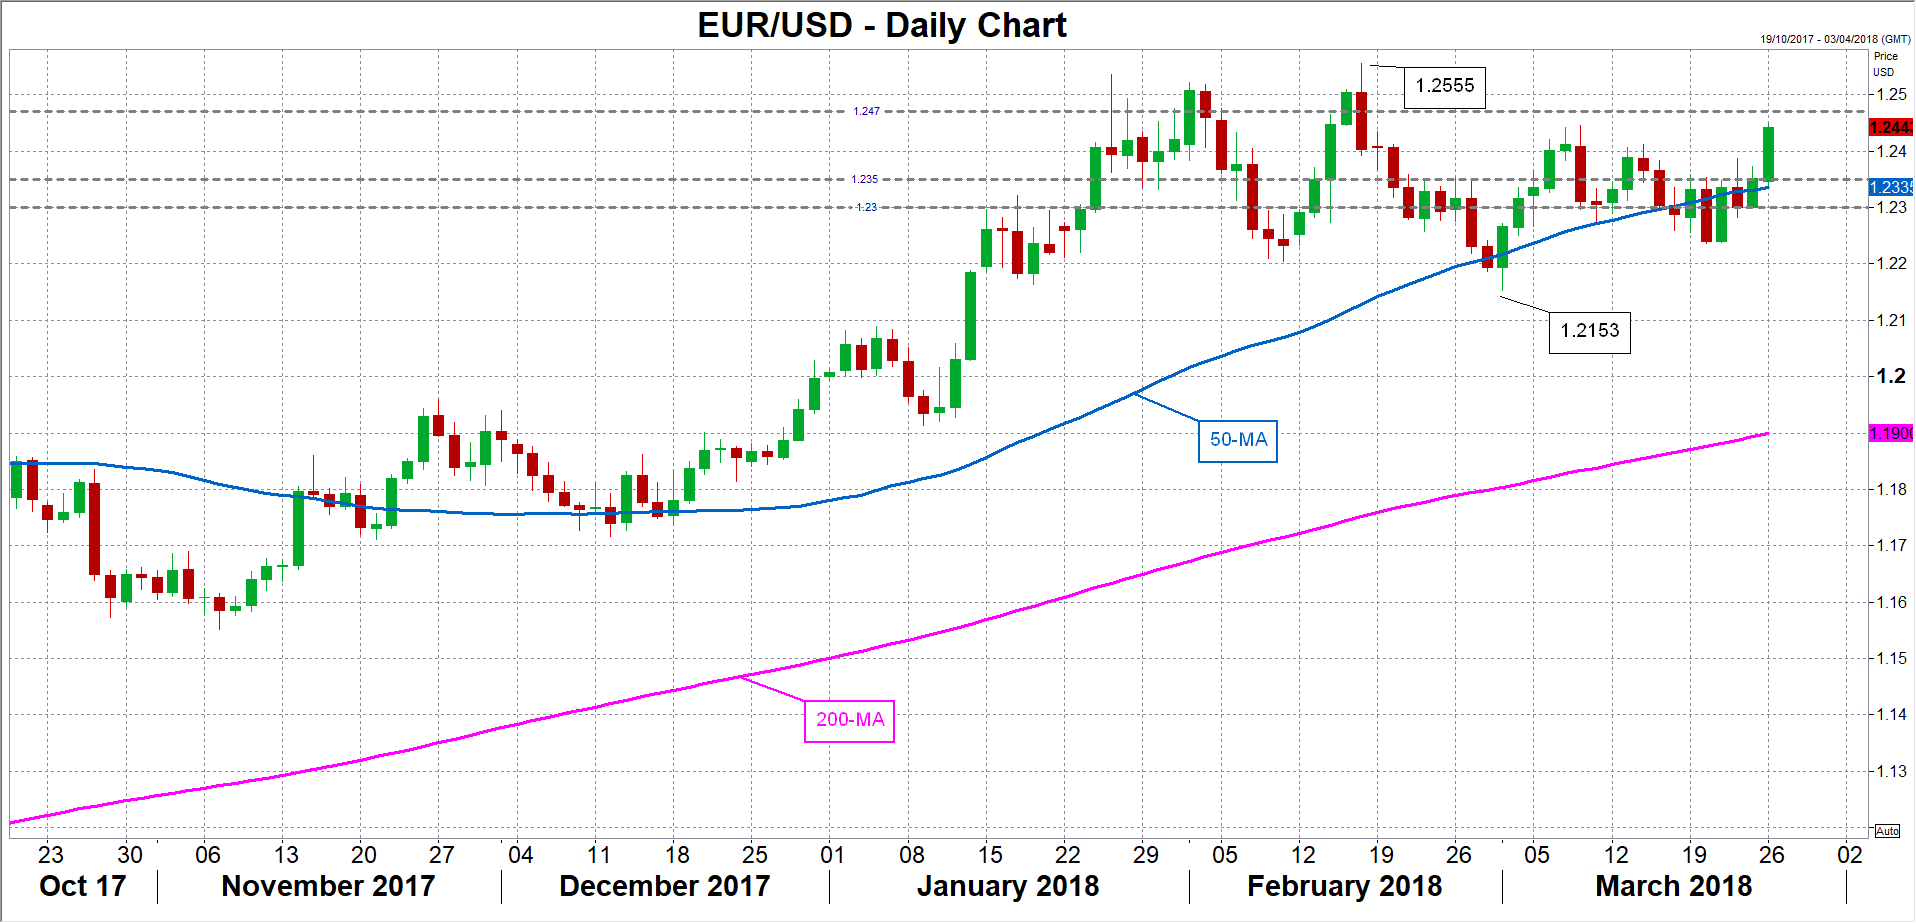 While the April data will likely be more telling about whether or not the slowdown is temporary or an indication that the Eurozone growth momentum has peaked, the euro could still see some reaction to the economic sentiment index should there be a downside surprise against the backdrop of week-long gains for the single currency. In such an event, the euro could retreat back towards the $1.2350 area, which is near its 50-day moving average. Deeper losses could see the $1.23 level providing support. However, a positive figure on Tuesday could help the euro extend its gains and push it towards $1.2470 (the 78.6% Fibonacci retracement of the downleg from 1.2555 to 1.2153).