Sample Category Title
Japanese Yen Dips, Inflation Reports Next
USD/JPY has posted gains in the Monday session. In the North American session, USD/JPY is trading at 104.97, up 0.22% on the day. It’s a quiet start to the week, with no US data releases. We’ll hear from three FOMC members – William Dudley, Loretta Mester and Randal Quarles. Japan will release an inflation indicator, the Services Producer Price Index. This inflation indicator is expected to remain unchanged at 0.7%. On Tuesday, the Bank of Japan releases Core CPI and the US publishes CB Consumer Confidence.
US durable goods reports ended the week on a high note, but the dollar still lost ground on Friday. Core Durable Goods Orders rebounded with a strong gain of 1.2%, crushing the estimate of 0.5%. This marked the strongest gain since July 2016. Durable Goods Orders jumped to an 8-month high, with a gain of 3.1%. The reading easily beat the forecast of 1.6%. The US manufacturing sector continues to expand at an impressive clip, a result of stronger global growth and a cheaper US dollar, which makes US goods less expensive for foreign buyers.
The safe haven yen gained 1.2% last week and hit 5-month highs, as risk appetite sagged after US President Trump slapped tariffs on China on Thursday. The punitive measure could affect up to $60 billion worth of Chinese imports. Trump said that the tariffs are needed to address the massive trade deficit with China, which stands at $375 billion. For its part, China wasted no time in threatening to retaliate, saying it was planning to impose tariffs on 128 US products, which would amount to $3 billion in imports. The tariffs directed against China come on the heels of tariffs on steel imports coming into the US, although the US has promised exemptions to the EU and other trading partners. There is serious concern that these moves could ignite a global trade war, and if the US tariffs remain in place, as downturn in the Chinese economy could spread and possibly a global recession.
DOW feels heavy around 24000, Euro gains upside momentum
DOW opened notably higher today and breached 24000 handle to 24044.39. But it quickly lost momentum. For the moment, it's feeling heavy from 24000. Current fall from 25449.15 is seen as resuming the decline from 26616.71 to 23360.29. Ideally, if our view is current, any interim recovery should be brief and there should be near them downside acceleration through 23360.29 support. And, break of 24453.14 resistance is needed to indicate bottoming. Otherwise, DOW will more likely have a take on 23360.29 than not.
 In the currency markets, after some strong momentum in early US session, Euro is now trading as the strongest one for today, overtaking NZD.
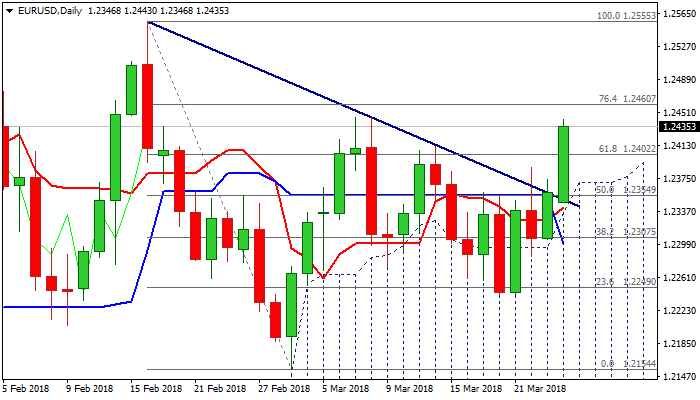
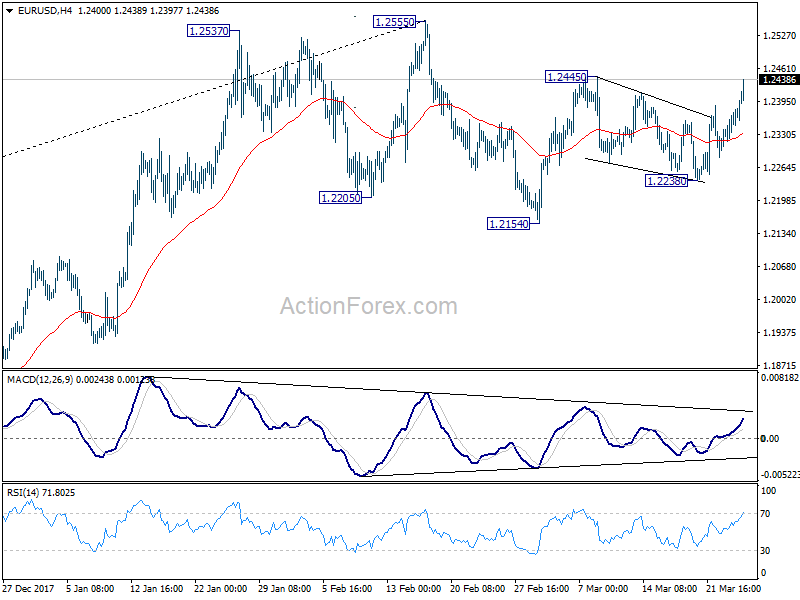
 In particular, EUR/USD's breach of 1.2445 resistance is now setting up the pair for a test on 1.2555 high.
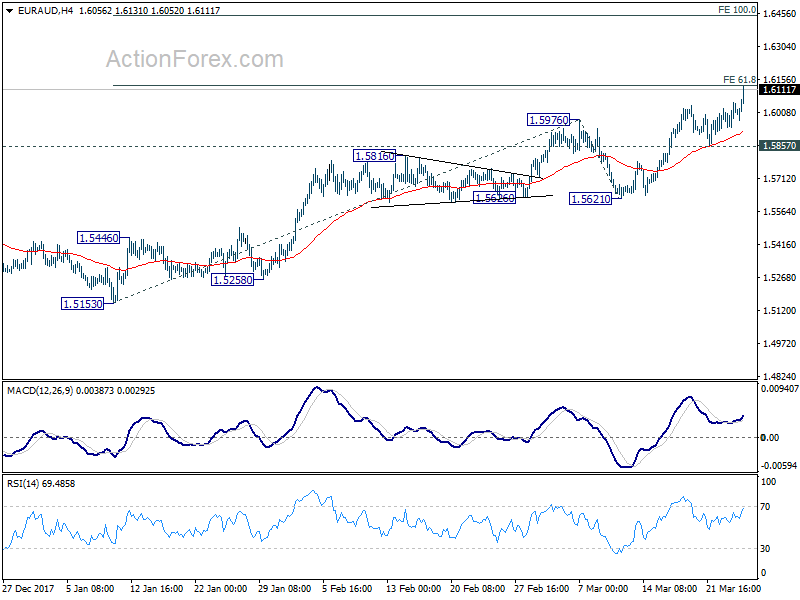
 EUR/AUD has met upside target of 61.8% projection of 1.5130 to 1.5976 from 1.5621 at 1.6130 first. With current solid momentum, it should be on track to 100% projection at 1.6444.
Gold at One-Month Highs; Rally Could be Overstretched
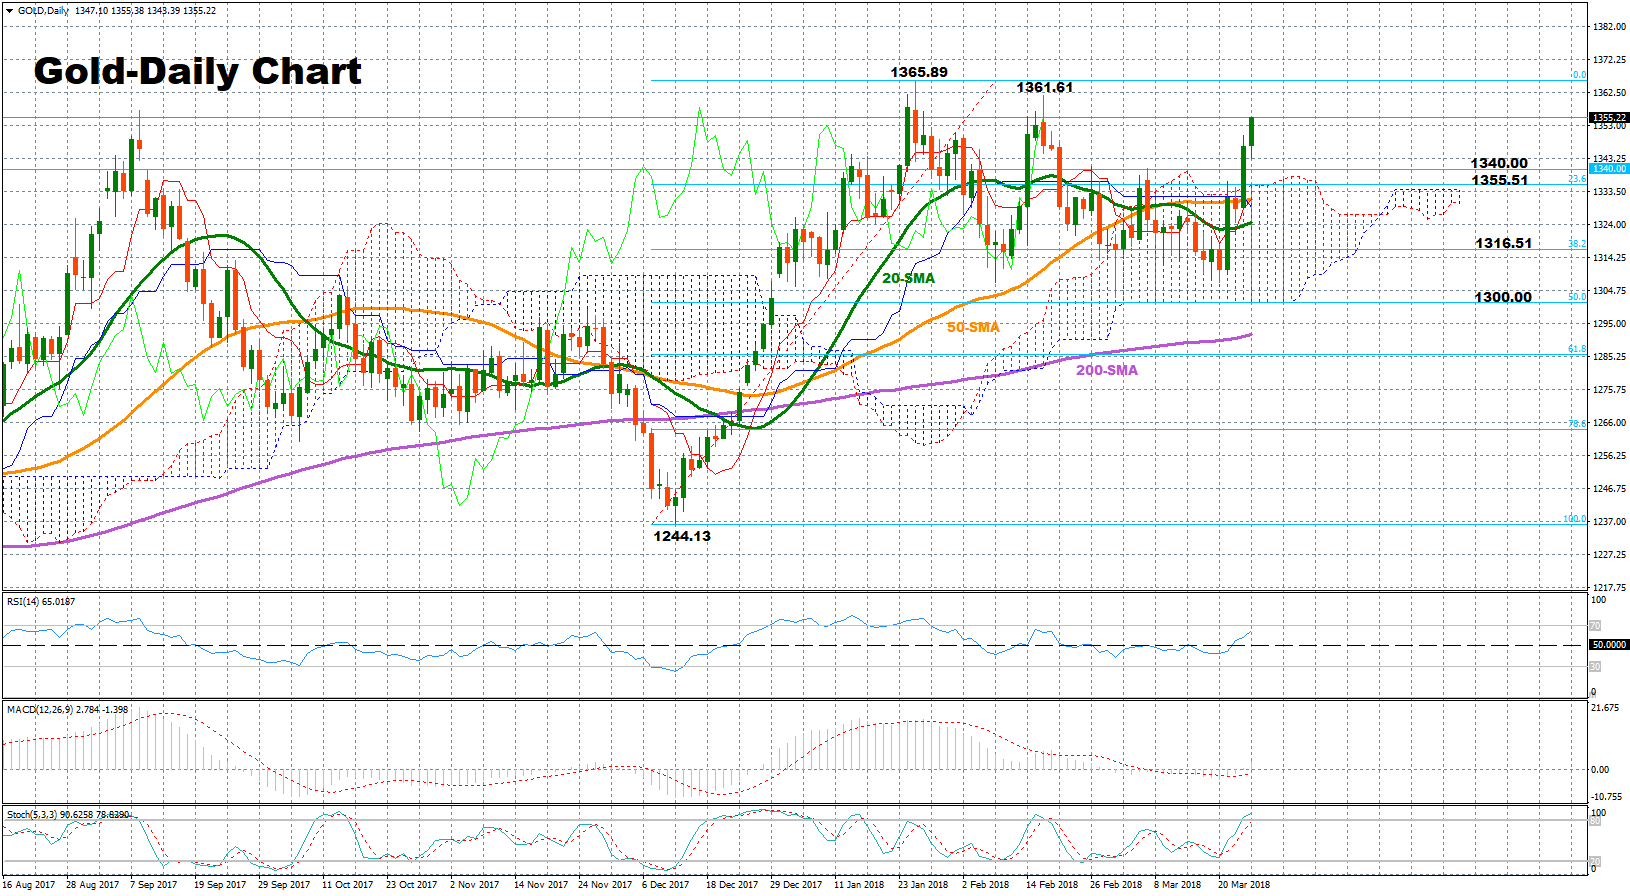
Gold rallied during the past week, jumping from three-week lows to one-month highs. Price action is currently taking place above the Ichimoku cloud and the moving average lines, sending bullish signals for the trend of the market, but momentum indicators suggest that any weakness in the short-term should not be a surprise.
The RSI is picking up speed above its neutral threshold of 50, though, it is not far away from overbought levels, hinting that maybe there is not much space left for additional gains. The fast stochastics support this view as well, as the indicator has already reached overbought territory above 80; if the blue %K line consequently moves below the %D line to record a bearish cross, the next price move could be to the downside. The MACD barely holds above zero but is above its red signal line, giving some positive signals.
Should the bullish sentiment in the market strengthen, gold could break the 1360 key-level, reaching February’s high of 1361.61. Further above, the next stop could be at the more than 1 ½ -year high of 1365.89 which if broken could bring the uptrend started in mid-December into play. Then from here, the door could open to the 1370 handle.
On the other hand, if prices lose ground, support could come around 1340, a frequently congested area from mid-January onwards, before the focus shifts to the 23.6% Fibonacci of 1355.51 of the upleg from 1244.13 to 1365.89, where the upper bound of the Ichimoku cloud is also roughly located. Looking further down, the area between the 50- and the 20-day simple moving average lines (1331.22 – 1323.55) could come into view ahead of the 38.2% Fibonacci of 1316.51. However, only a break below the 1300 key mark would decisively bring a bear market outlook into play.
Turning to the medium-term outlook, the market structure remains positive given gold’s performance over the last three months. Moreover, as long as market action holds above the 50-day SMA and the bullish cross between the 50- and the 200-day SMA holds in place, the trend is likely to stay on the upside.
Sunset Market Commentary
Markets:
Global core bonds lost slightly ground today as stock markets got some breathing space following last week’s sell-off. Chinese/US comments over the weekend suggest that common sense might eventually prevail in trade talks. US Treasuries underperformed German Bunds ahead of this week’s supply operation which starts tonight with a $30bn 2-yr Note auction. US yields rise by 0.9 bps (30-yr) to +2.9 bps (5-yr). German yields add 0.8 bps to 1.2 bps with the belly of the curve outperforming the wings. 10-yr yield spread changes vs Germany range between -1 bp (Spain) and +3 bps (Italy). Spain continues to outperform vs Italy. S&P upgraded the Spanish rating last Friday from BBB+ to A- (positive outlook). Italian Lega Nord leader Salvini said he would start talks with 5SM leader Di Maio to form Italy’s next government. From a market point of view, such populist government, is the least favored outcome.
Global risk sentiment improved today as markets saw tentative signs that the US tried to solve issues with its trading partners (including China) via bilateral negotiations. (US) Equities rebound after Friday’s sell-off. Core bond yields rose slightly. The US/German interest rate differential widened marginally. However, it didn’t help the dollar much. USD/JPY cautiously regained the 105 barrier. EUR/JPY and EUR/USD also maintained a good bid. Technical considerations and option-related activity were said to support the single currency. The data were second tier and no real driver for currency trading. EUR/USD rebounded north of 1.24. EUR/JPY regained the 130 mark. EUR/USD holds in the 1.2155/1.2555 consolidation pattern. However, the price action both in USD/JPY and even more in EUR/USD suggests that any dollar rebound needs unequivocally positive news. Markets want more clarity that there is no meaningful negative fall-out from the trade tensions on US/ global growth. That news isn’t available at this stage.
Sterling remained well bid today. Cable extended gains north of 1.42. EUR/GBP also traded with a slightly negative bias even as EUR/USD rebounded. The pair is holding a tight range roughly between 0.8745 and the 0.8720 area. UK Finance Loans for housing declined more than expected in February, but the release had no (negative) impact on sterling. Both in cable and in EUR/GBP remain key technical resistance levels, respectively at 1.4345 and 0.8768/52, within striking distance.
News Headlines:
The French public deficit declined from 3.4% of GDP in 2016 to 2.6% of GDP in 2017. The French government only anticipated the deficit to be reduced to 2.9%. It was the first time in a decade for France to meet the EU’s 3.0% deficit rule. Spain’s budget Minister reported that his country recorded a 3.11% budget deficit in 2017.
China's crude oil futures started trading today on decent volumes. Many expect the Chinese INE oil future to become a third global price benchmark alongside Brent and WTI crude.
South African bond yields declined to the lowest level in almost three years and the rand extended gains after Moody’s Investors Service left the country’s credit rating at investment grade (Baa3) and lifted the outlook to stable.
IMF head Lagarde said euro zone leaders should set up a "rainy day fund" to help cushion member states in economic downturns.
EURUSD Extends Rally on Fresh Risk Sentiment as Trade War Concerns Fade
The Euro gained pace and surged through initial barriers at 1.2402/12 (Fibo 61.8% of 1.2555/1.2154 pullback/14 Mar lower top), as fears about trade war started to fade, bringing risk sentiment back to play. The single currency is in strong bullish acceleration on Monday, which extends last Friday's rally and marks 0.75% advance for the day so far, identical to 21 Mar post-Fed rally. Bulls pressure next pivotal barrier at 1.2446 (07/08 Mar double-top), break of which would signal that 1.2555/1.2154 corrective phase might be over. Fresh bullish momentum is building on daily chart and supports the rally along with daily MA's in firm bullish setup. Sustained break above bear-trendline off 1.2555 high was strong bullish signal, as thickening daily cloud which contained last week's downside attack, remains as strong support and continues to underpin the advance. We look for today's close above broken Fibo barrier at 1.2402 to generate bullish signal and confirm extension of recovery leg from double-bottom at 1.2240.
Res: 1.2446; 1.2460; 1.2500; 1.2522
Sup: 1.2412; 1.2402; 1.2388; 1.2370
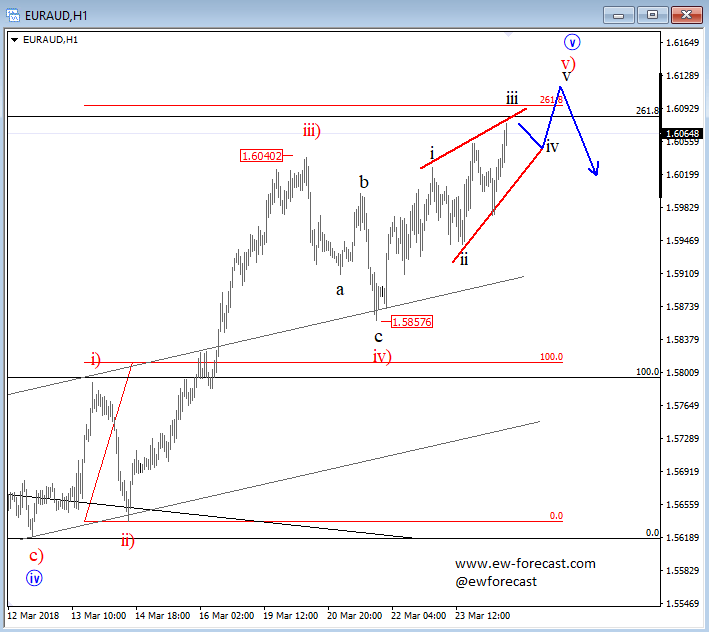
Elliott Wave Analysis: GBPAUD and EURAUD Looking For A Reversal
GBPAUD is currently trading bullish, but don't fall too much in love with the trend, as we think that current three-wave rally away from 1.7100 area can be the final piece of a bigger, complex correction. That said, we see price unfolding final stages of wave C of Y), that can see limited upside near the upper channel line, and near the Fibonacci ratio of 100.0 (where wave A would equal wave C). There a new bearish reversal can follow.
GBPAUD, 4H
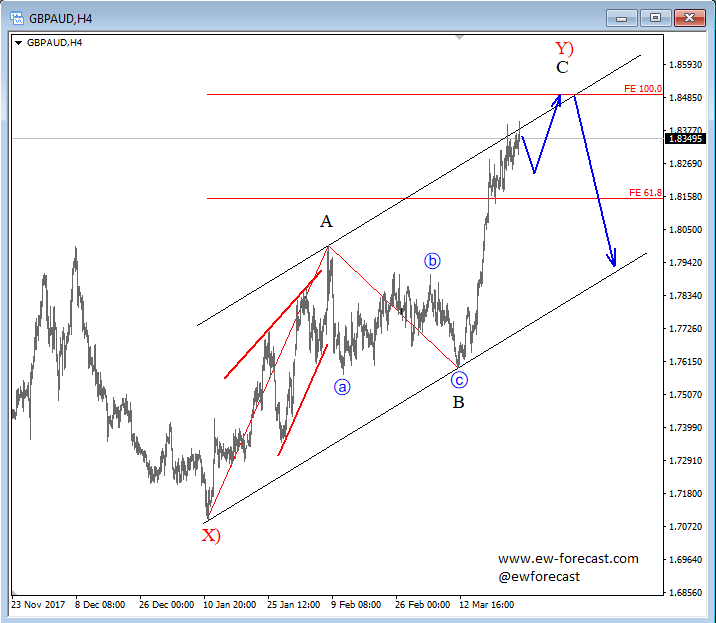
GBPAUD
Now looking at the EURAUD pair, notice that there is a nice similarity between the two pairs. Here we also expect the price to find a top in the near-term, and later make a new bearish reversal lower. Specifically, we see sub-wave v) of five in the making which can see a possible resistance zone and a bearish reversal around the 1.6080-1.6120 area.
EURAUD, 1H
EUR/USD Mid-Day Outlook
Daily Pivots: (S1) 1.2308; (P) 1.2341 (R1) 1.2384; More....
EUR/USD surges to as high as 1.2438 and intraday bias is back to the upside for 1.2445 resistance. Break will resume whole rebound form 1.2154 and target 1.2555 high which is close to 1.2516 key long term fibonacci level. Decisive break there will carry larger bullish implications. On the downside, however, firm break of 1.2238 will turn bias back to the downside, to resume the fall from 1.2555 through 1.2154.
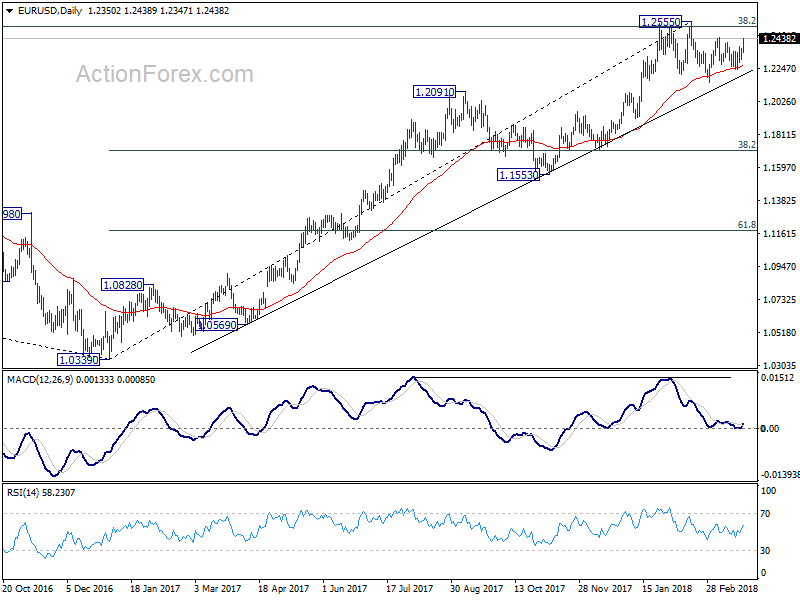
In the bigger picture, key fibonacci level at 38.2% retracement of 1.6039 (2008 high) to 1.0339 (2017 low) at 1.2516 remains intact despite attempts to break. Hence, rise from 1.0339 medium term bottom is still seen as a corrective move for the moment. Rejection from 1.2516 will maintain long term bearish outlook and keep the case for retesting 1.0039 alive. Firm break of 1.1553 support will add more medium term bearishness. However, sustained break of 1.2516 will carry larger bullish implication and target 61.8% retracement of 1.6039 to 1.0339 at 1.3862.
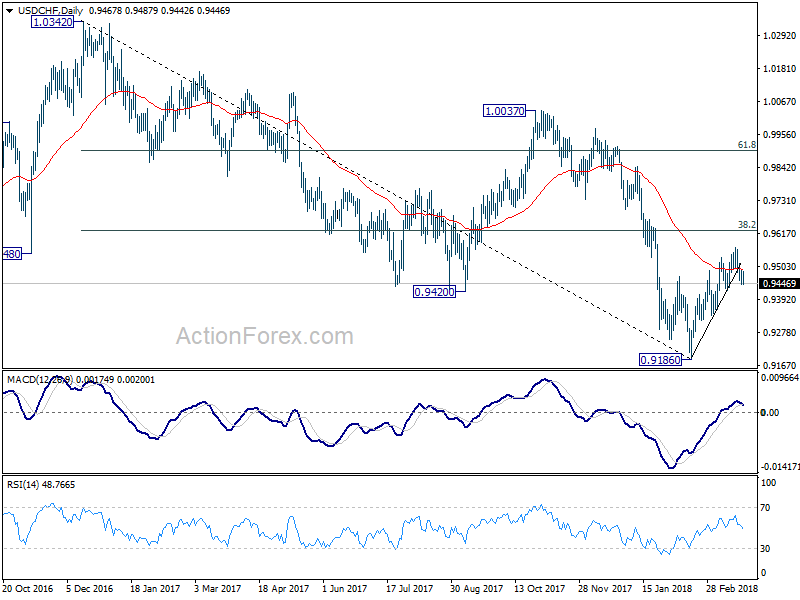
USD/CHF Mid-Day Outlook
Daily Pivots: (S1) 0.9442; (P) 0.9469; (R1) 0.9493; More...
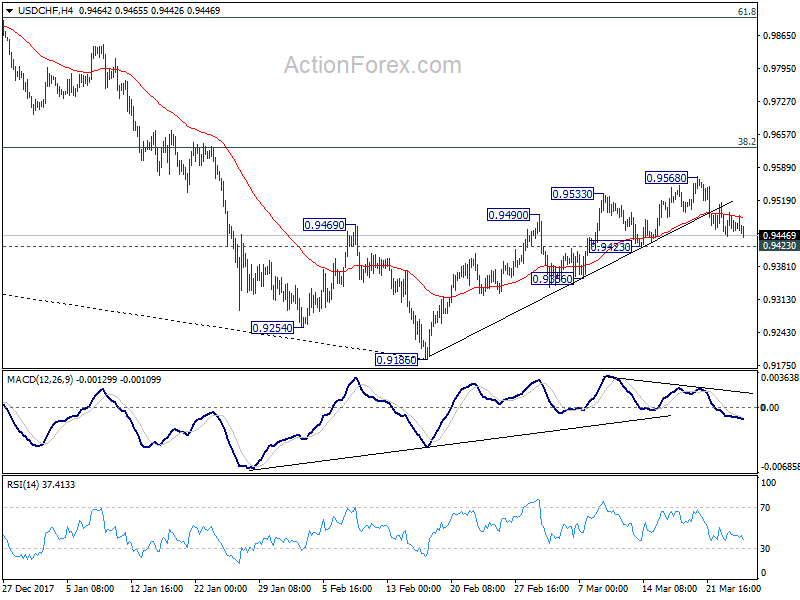
No change in USD/CHF's outlook and intraday bias remains neutral. As noted, rebound from 0.9186 might not be finished yet. But considering divergence condition in 4 hour MACD, even in case of another rise, upside should be limited by 0.9626 key fibonacci level. Break of 0.9432 support will indicate near term reversal and completion of rebound from 0.9186. In this case, intraday bias will be turned back to the downside for retesting 0.9186 low. However, sustained break of 0.9626 will carry larger bullish implications.
In the bigger picture, fall from 1.0342 is seen as a medium term down trend. Main focus is on 38.2% retracement of 1.0342 (2016 high) to 0.9186 (2018 low) at 0.9626. Sustained break there will add to the case of trend reversal and target 61.8% retracement at 0.9900 and above). However, rejection from 0.9626 will maintain medium term bearishness for another low below 0.9186.
USD/JPY Mid-Day Outlook
Daily Pivots: (S1) 104.45; (P) 104.89; (R1) 105.16; More...
A temporary low is in place at 104.62 with 4 hour MACD crossed above signal line. Intraday bias is turned neutral first. But recovery should be limited below 106.63 resistance to bring fall resumption. Below 104.62 will target 104.20 projection level first. Sustained break there will pave the way to 98.97 (2016 low).
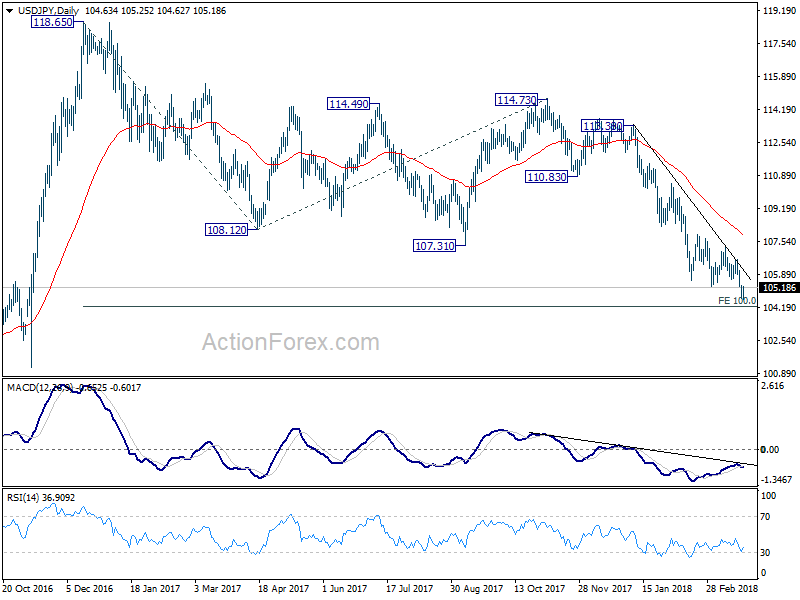
In the bigger picture, medium term down trend from 118.65 (2016 high) is still in progress and extending. Build up in downside momentum argues that it might be extending the whole corrective pattern from 125.85 (2015 high). 100% projection of 118.65 to 108.12 from 114.73 at 104.20 will be a key level to watch as firm break there could bring downside acceleration. And in that case, 98.97 key support level (2016 low) would at least be breached. This bearish case will now be favored as long as 108.12 support turned resistance holds.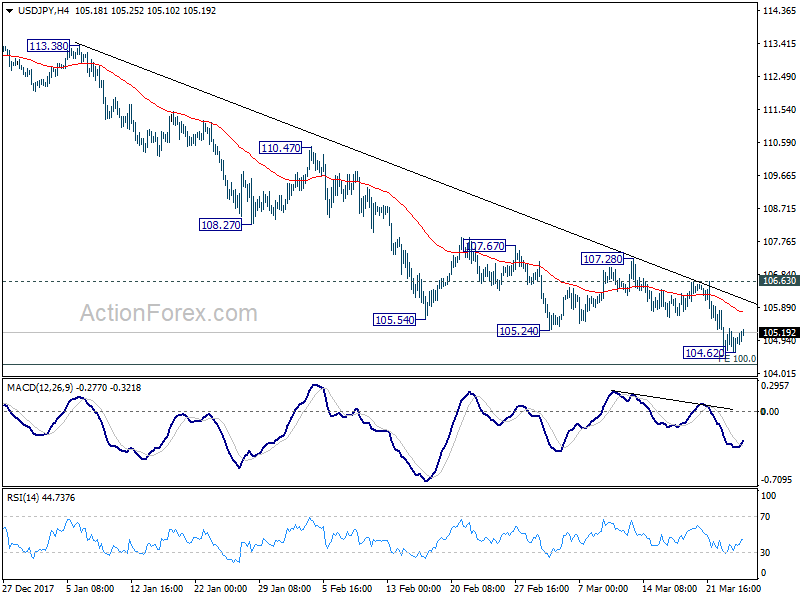
GBP/USD Mid-Day Outlook
Daily Pivots: (S1) 1.4085; (P) 1.4128; (R1) 1.4173; More....
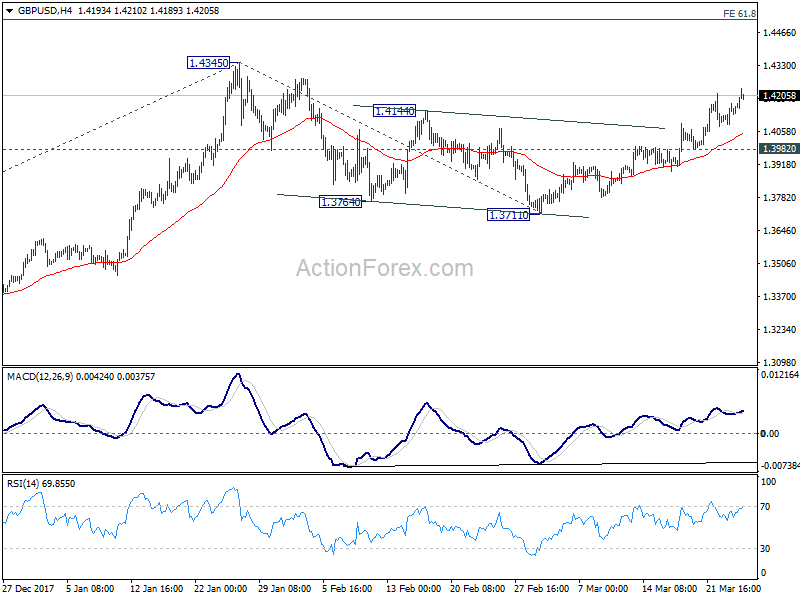
GBP/USD's rally continues today and reaches as high as 1.4234 so far. Intraday bias remains on the upside for 1.4345 high. Decisive break there will resume larger up trend and target 61.8% projection of 1.3038 to 1.4345 from 1.3711 at 1.4519 next. On the downside, break of 1.3982 support is needed to indicate completion of the rebound from 1.3711. Otherwise, outlook will stay cautiously bullish even in case of retreat.
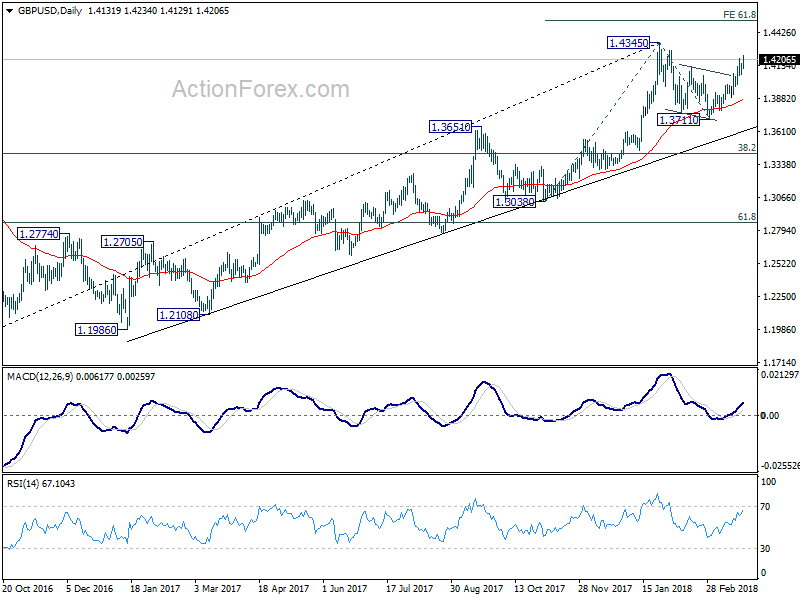
In the bigger picture, as long as 1.3038 support holds, medium term outlook in GBP/USD will remains bullish. Rise from 1.1946 is at least correcting the long term down from 2007 high at 2.1161. Further rally would be seen back to 38.2% retracement of 2.1161 (2007 high) to 1.1946 (2016 low) at 1.5466. However, GBP/USD fails to sustain above 55 month EMA (now at 1.4259) so far. Break of 1.3038 support, will suggest that rise from 1.1946 has completed and will turn outlook bearish for retesting this low.