Sample Category Title
New Zealand February Trade Balance Above Expectations
New Zealand February trade balance above expectations
New Zealand economy is showing signs of recovery following recent February trade balance data given at NZD 217million (consensus: -100 million) or USD 157 million, its highest rate after NZD -655 million deficit in January. On the downside however, New Zealand 12 months trade balance remains at NZD -3 billion. Exports rose by NZD 4.46 billion (previous: NZD 4.31 billion) while imports increased by NZD 4.24 billion (previous: NZD 4.94 billion).
Royal Bank of New Zealand agreed to implement a second mandate alongside price stability on Monday, consisting of maximum employment, in line with Fed’s existing dual mandate implemented in the 1970s. The mandate will be enshrined in law this year. New Zealand treasuries remain unchanged following the announcement. 2-year and 10-year yields are given at 1.88% (+0.17) and 2.78% (+0.18).
On forex side, we notice the strong increase of non-commercial long NZD futures positions increasing by 19’626 (previous week: -2’816), amounting to 44% of total open interest contracts, thus signaling traders’ tendency to dump the greenback. The trend might continue into that direction, supposing further weakness from the USD. Accordingly, we suspect the USD/NZD to head along the 1.37 range.
Why is HKD weakening?
The Hong Kong dollar is falling against the US dollar, even though markets are comfortable with China’s outlook, Reasons we can rule out are positivity around the greenback, worries about Hong Kong’s domestic growth or a straight attack on the currency peg.
So what is it? Widening in LIBOR-HIBOR spreads suggest that this is a traditional interest rate arbitrage. Carry traders are buying USD for the yield, so selling HKD. The Hong Kong Monetary Authority has plenty of reserves to defend the peg, and automatic, self-adjusting interest rates should kick in at the upper range, where HKMA will switch to selling USD and buying HKD. This will lower liquidity and drive up HKD rates, discouraging carry traders.
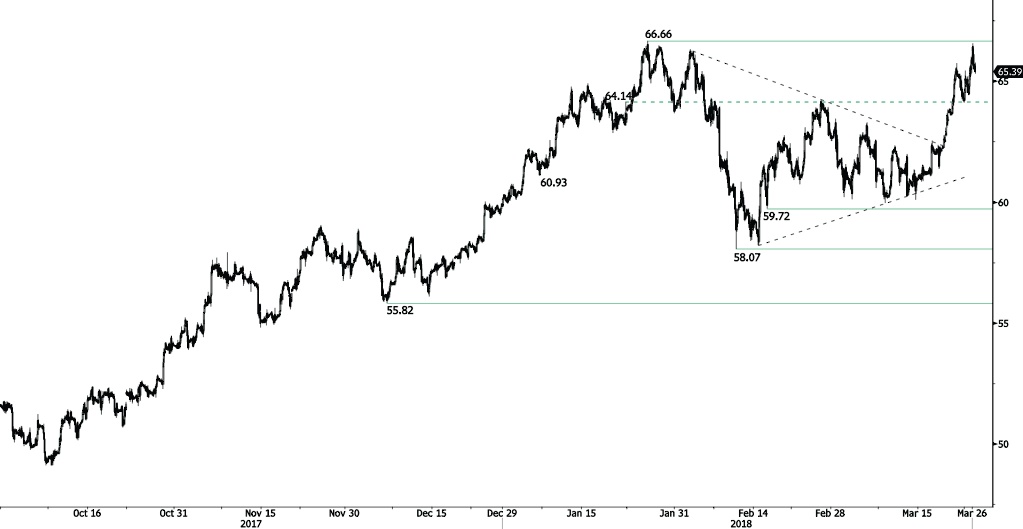
CRUDE OIL Failing To Break Resistance At 66.66
Crude oil bullish trend pauses below hourly resistance at 66.66 (25/01/2018 high), currently trading at 65.45 and expected to decrease along the 65.20 range. The technical structure suggests short-term downward moves.
In the long-term, crude oil has recovered after its sharp decline last year. However, we consider that further weakness is very likely. For the time being, the pair lies in an upside trend since June 2017. Support lies at 42.20 (16/11/2016) while resistance is located at 77.83 (20/11/2014). Crude oil is trading largely above its 200 DMA.
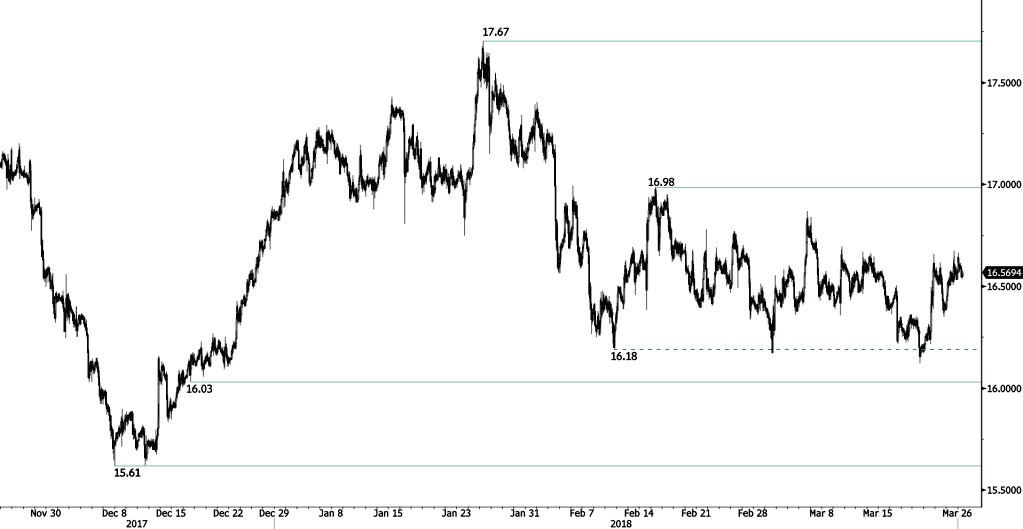
SILVER Slight Increase
Silver is trading indistinctly along the 16.60 range, expected to head higher at 16.65. Silver is contained between hourly support and resistance given at 16.03 (18/12/2017 low) and 16.98 (15/02/2018 high). The short-term technical structure suggests short-term rising moves.
In the long-term, the trend remains negative/ sideways. Further downside is very likely. The pair is trading below its 200 DMA. Resistance is located at 21.58 (10/07/2014 high). Strong support can be found at 11.75 (20/04/2009).
China’s WTO embassador Zhang Xiangchen: “Lock this beast back into the cage”
Zhang Xiangchen, China's Deputy International Trade Representative and WTO embassador urged the organization complained about US unilateral tariffs at a WTO meeting today. He criticized that "US is setting a very bad precedent by bluntly breaching its commitment made to the world" as it has agreed not to apply such tariffs without TWO approval. And he urged WTO members to jointly "lock this beast back into the cage of the WTO rules".
He added that "unilateralism is fundamentally incompatible with the WTO, like fire and water. In the open sea, if the boat capsizes, no one is safe from drowning." And, "we shouldn't stay put watching someone wrecking the boat. The WTO is under siege and all of us should lock arms to defend it."
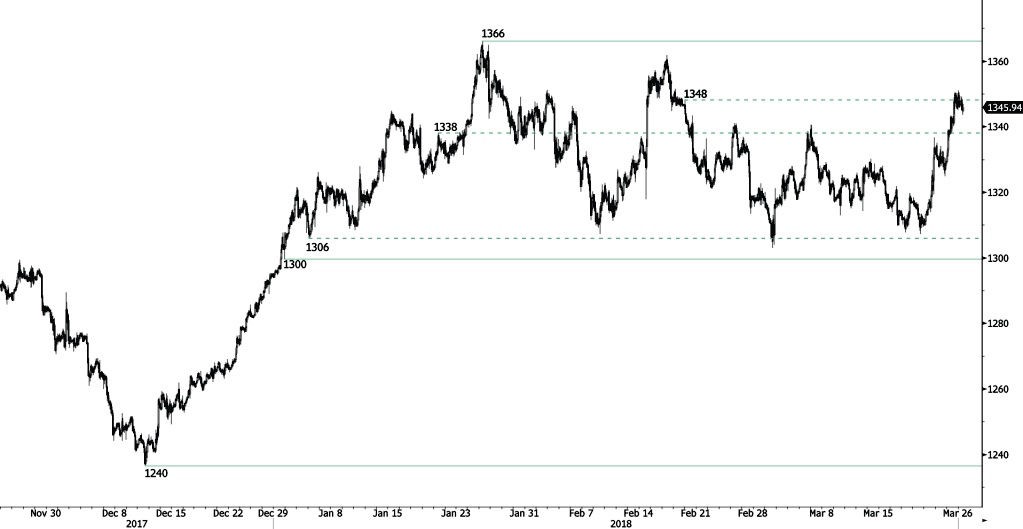
GOLD Pausing Before Another Leg Higher
Gold is stabilizing at the 1346 range following recent rise at 1351, breaking hourly resistance at 1348 (20/02/2018 high). Expected to remain at the 1344 range. Hourly support and resistance are now given at 1300 (29/12/2017 low) and 1366 (25/01/2018 high). The technical structure suggests short-term consolidation.
In the long-term, the technical structure suggests that there is a growing upside momentum. A break of 1'392 (17/03/2014) is required to confirm it. A major support can be found at 1'045 (05/02/2010 low).
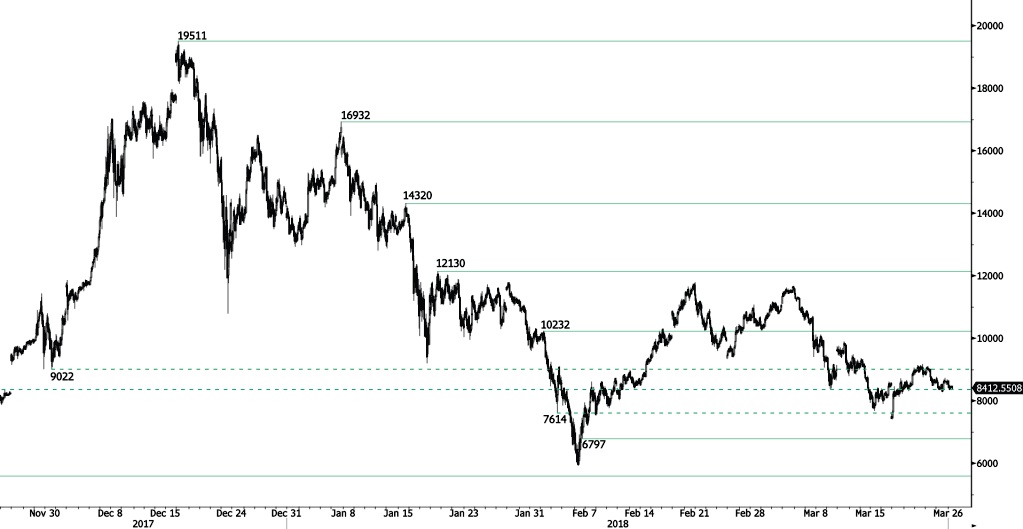
BITCOIN Continued Bearish Consolidation
Bitcoin is trading sideways at the 8400 range following recent rise at 9096 (22/03/2018 high). Bitcoin is expected to head along the 8370 range. The pair is contained between hourly support and resistance given at 6797 (06/02/2018 low) and 10232 (01/02/2018 high). The technical structure suggests further short-term sideways trading moves.
In the long-term, the digital currency has had an exponential growth but also presented important downturns. There is decent likelihood that the currency could stabilize between 7'000 - 12'000 in 2018. Bitcoin is approaching its 200 DMA (7000 range).
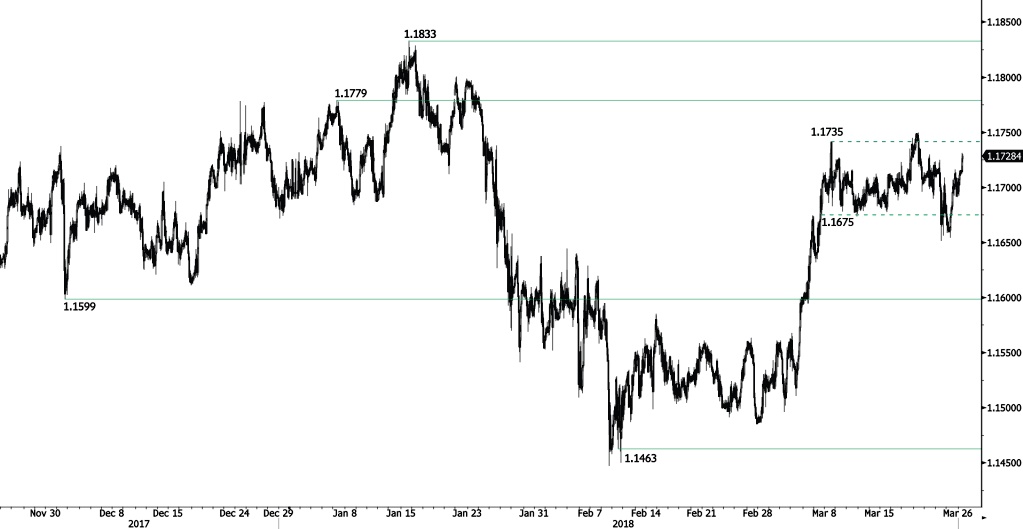
EUR/CHF Slight Decline
EUR/CHF is slightly decreasing following recent rise at 1.1733, expected to decrease along the 1.1715 range. Hourly support and resistance remain at 1.1599 (01/12/2017 low) and 1.1779 (05/01/2018 high). The short-term technical structure suggests short-term decrease.
In the longer term, the technical structure has reversed. Strong resistance is given at 1.20 (level before the unpeg). Yet, the ECB's slowing QE program is likely to cause buying pressures on the euro, which should weigh in favour of the EUR/CHF. Support can be found at 1.0234 (20/04/2015 low).
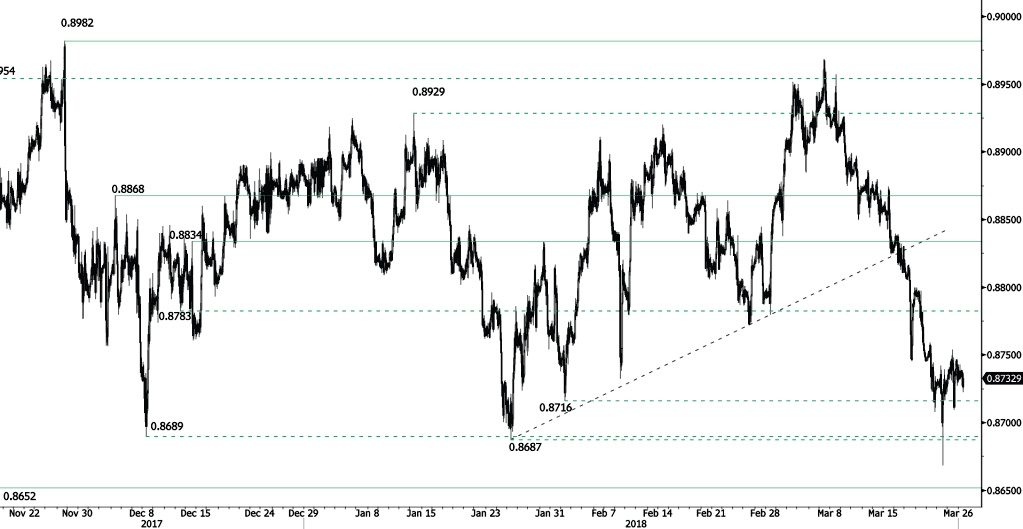
EUR/GBP Bullish Consolidation
EUR/GBP is trading sideways along the 0.8730 range following recent decline at 0.8668 (22/03/2018 low). The pair is expected to increase slightly at 0.8740 in the short-term. Hourly support and resistance are given at 0.8687 (25/01/2018 low) and 0.8834 (14/12/2017 high). The technical structure suggests shortterm sideways trading moves.
In the long-term, the pair has largely recovered from 2015 lows. The technical structure suggests further upside pressure. Strong resistance can be found at 0.9500 (psychological level) while support remains at 0.8304 (05/12/2016 low). The pair is trading below its 200 DMA.
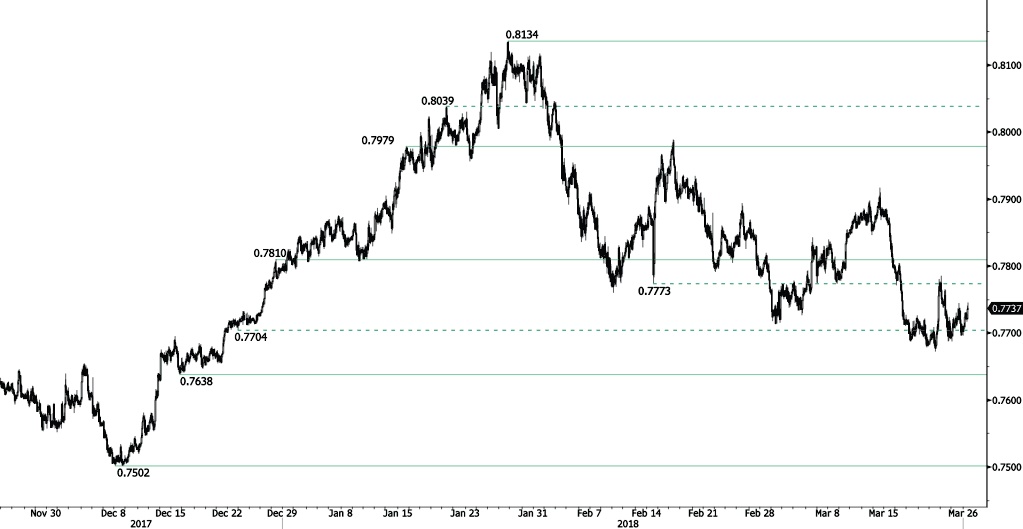
AUD/USD Ready To Bounce Higher
AUD/USD is bouncing off from 0.7696 low, approaching the 0.7744 high from 23/03/2018 and expected to rise along the 0.7745 range. Hourly support and resistance are given at 0.7638 (15/12/2017 low) and 0.7810 (28/12/2017 high). The technical structure suggests shortterm increase.
In the long-term, the upward trend slows down after failing to reach key resistance at 0.8164 (14/05/2015 low). Key support stands at 0.6009 (31/10/2008 low). A break of the key resistance at 0.8164 (14/05/2015 high) is needed to invalidate our long-term bearish view.
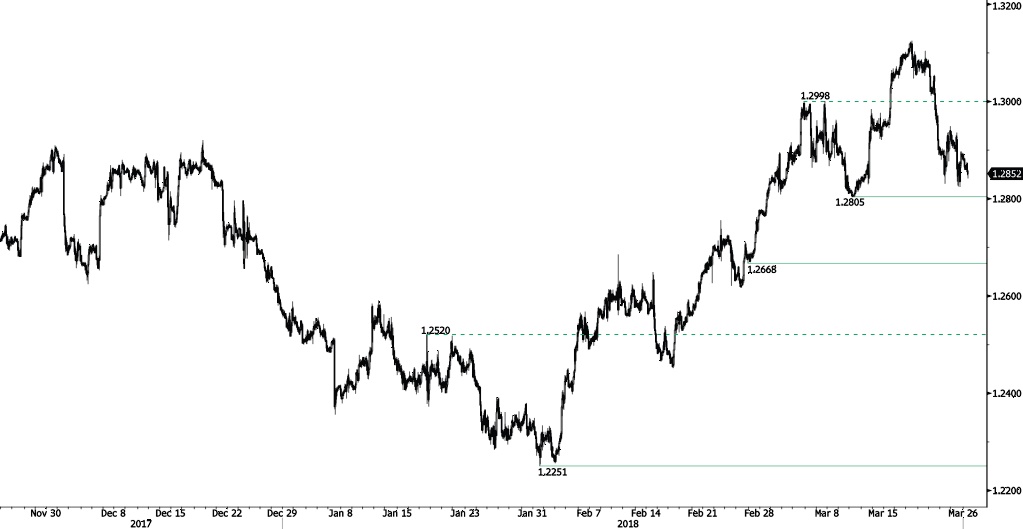
USD/CAD Bouncing Off
USD/CAD is bouncing off from 1.2825 low, currently trading along the 1.2852 range and expected to increase at 1.2880. Hourly support and resistance are given at 1.2805 (12/03/2018 low) and 1.3308 (23/06/2017 high). The shortterm technical structure suggests short-term increase.
In the longer term, the pair is trading between resistance point at 1.3805 (05/05/2017 high) and support at 1.2128 (18/06/2015 low). Strong resistance is given at 1.4690 (22/01/2016 high). The pair is likely to head lower. The pairs is trading above its 200 DMA.