Sample Category Title
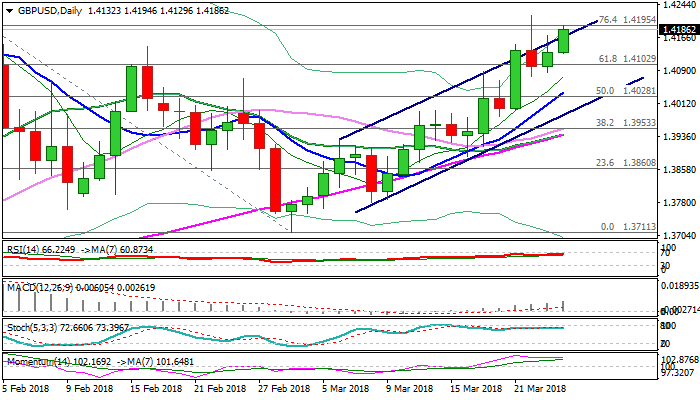
Technical Outlook: GBPUSD – Bulls Probe Again Above Bull-Channel Resistance Line
Cable stands at the front foot at the beginning of the week, maintaining bullish sentiment on last week’s positive news from Brexit negotiations and strong data. Bulls probe again above cracked bull-channel resistance line (1.4176), in attempts to retest last week’s spike high at 1.4218 (the highest since 02 Feb).
Bullish daily studies are supportive for further advance which could extend towards double-top at 1.4277 (01/02 Feb) on firm break of 1.4218 high and expose key barrier at 1.4255 (the highest since June 2016 Brexit vote).
Broken Fibo 61.8% support at 1.4102 is expected to contain and guard lower pivot at 1.4053 (daily Tenkan-sen).
Res: 1.4218, 1.4277, 1.4300, 1.4344
Sup: 1.4171, 1.4144, 1.4129, 1.4102
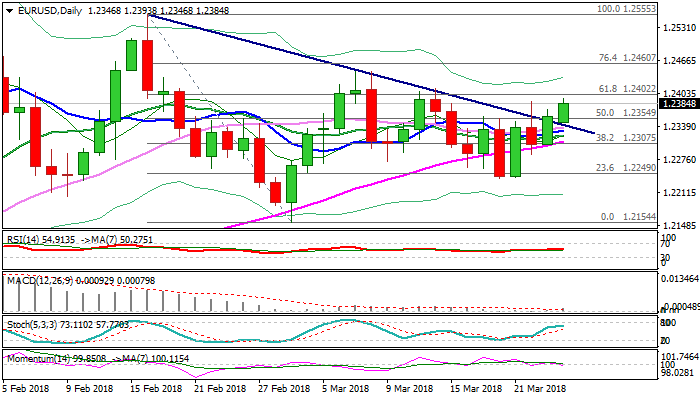
Technical Outlook: EURUSD – Bulls Eye Pivots At 1.2402/12 After Eventual Close Above Trendline Resistance
The Euro remains firm tone on Monday and extends last Friday's rally which resulted in eventual close above bear-trendline off 1.2555 high.
Fresh bulls probe above last week's high at 1.2388 and look for test of next pivots at 1.2402/12 (Fibo 61.8% of 1.2555/1.2154 pullback / 14 Mar lower top), to generate fresh bullish signal on break.
Rising top of thick daily cloud continues to underpin recovery, along with daily MA's in full bullish setup.
Lack of momentum could be limiting factor for bulls, as 14-d momentum is probing into negative territory, however, dip-buying strategy will remain favored while the price holds above cloud top / broken bear-trendline (1.2336).
Res: 1.2355, 1.2388, 1.2412, 1.2446
Sup: 1.2300, 1.2240, 1.2172, 1.2136
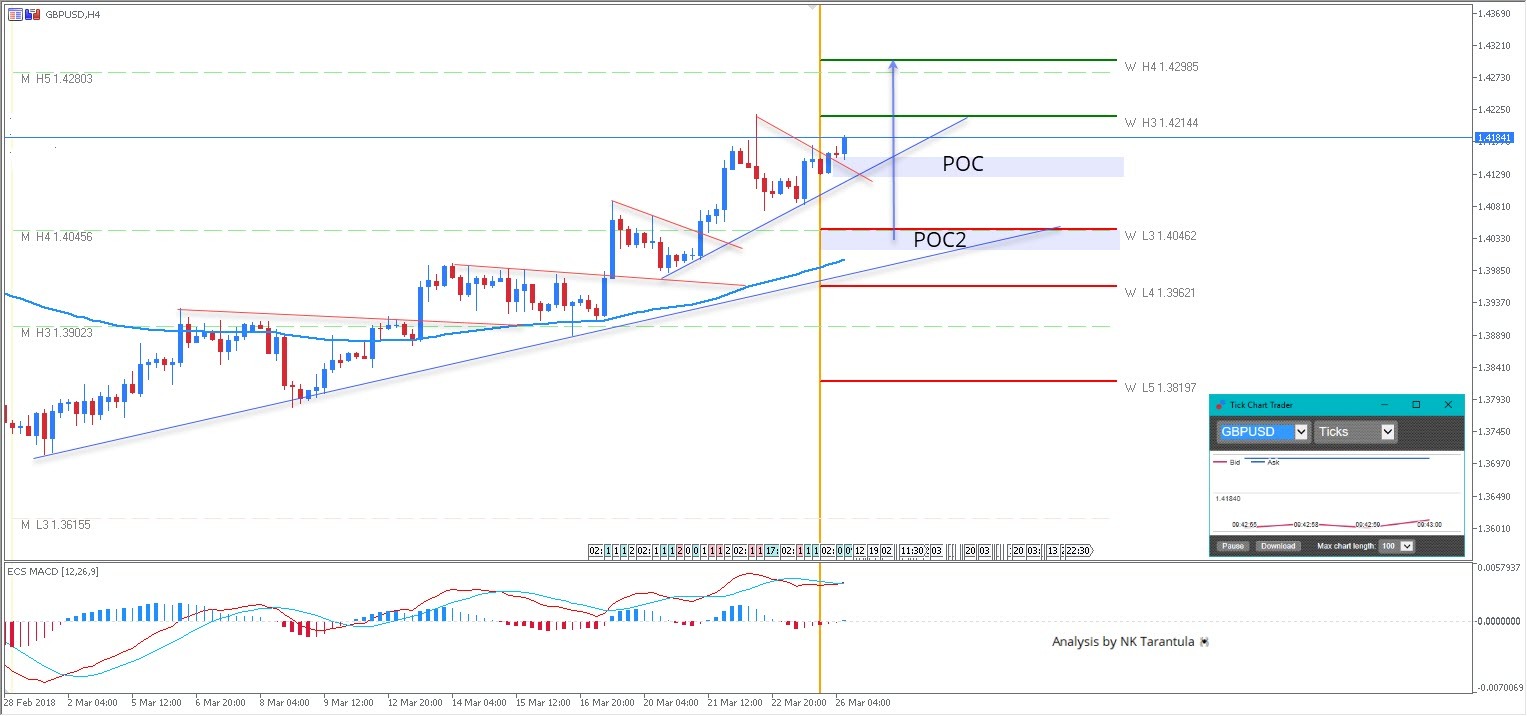
GBP/USD Technical Zig-Zag For Uptrend Continuation
The GBP/USD is in a strong uptrend that is clearly visible as higher high/higher low pattern in a sturdy zig-zag motion. This is technical uptrend is targeting W H3 1.4214-1.4230 and if daily candle closes above we might see 1.4298 in upcoming days as I showed in the Fxstreet.com Forecast Poll. Retracement towards 1.4115-30 (POC) could possibly be used for new long positions. Even a drop towards 1.4030-45 could still be used for buying the dip as the uptrend is strong as long as the price is kept above M H3- 1.3902.
W H3 - Weekly Camarilla Pivot (Weekly Interim Resistance)
W H4 - Weekly Camarilla Pivot (Strong Weekly Resistance)
M H4 - Daily Camarilla Pivot (Very Strong Monthly Resistance)
M L3 – Daily Camarilla Pivot (Monthly Support)
M L4 – Daily H4 Camarilla (Very Strong Monthly Support)
POC - Point Of Confluence (The zone where we expect price to react aka entry zone)
Daily Wave Analysis: EUR/USD Tests Key Resistance Zone For Bounce Or Breakout
Currency pair EUR/USD
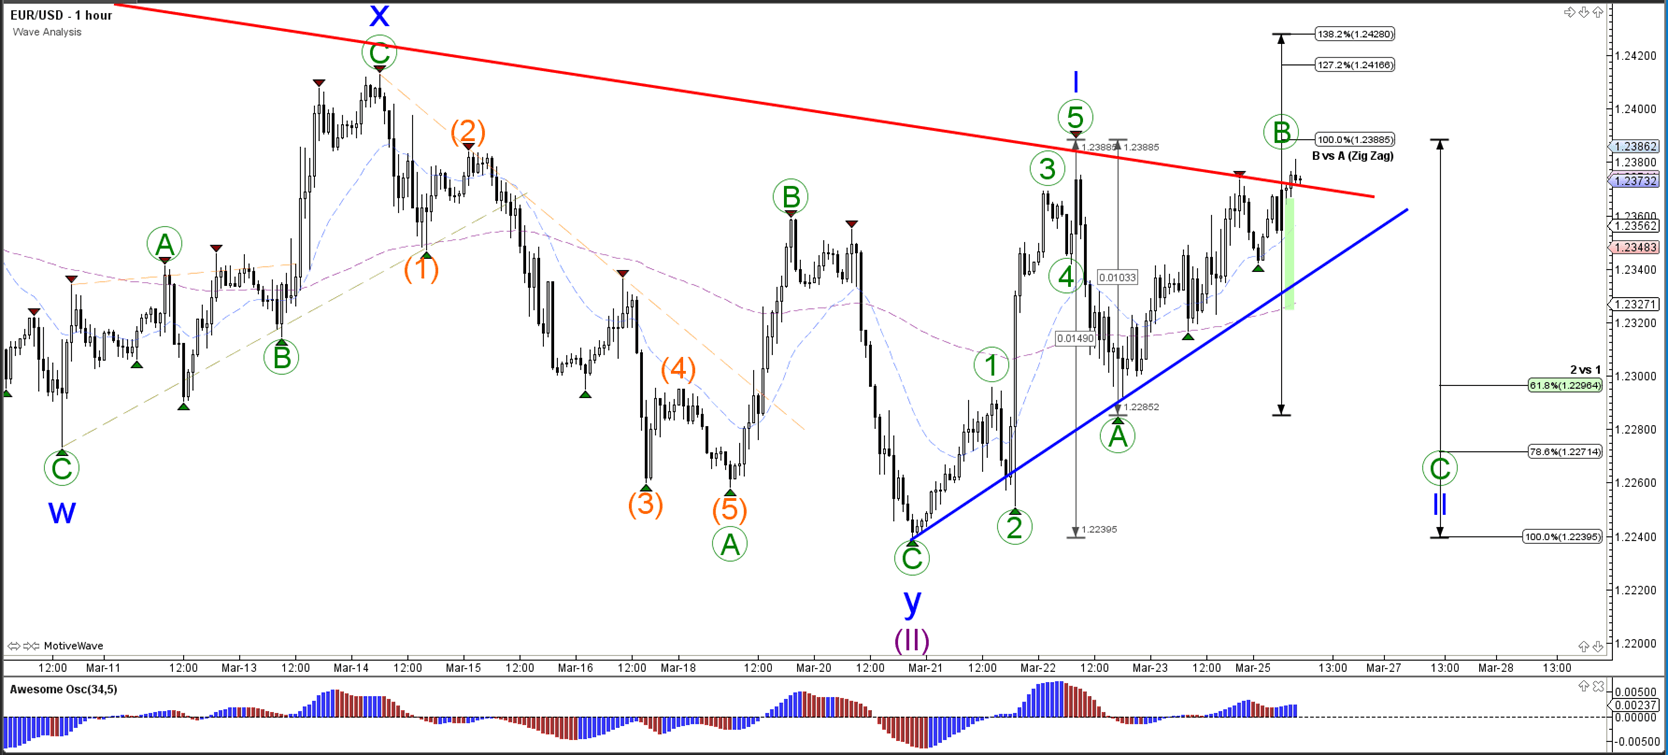
The EUR/USD is testing the resistance trend line (red). A bullish break could start a potential wave 3 (blue) of 3 (purple) whereasa break below the support zone (green) could indicate a larger trend change.
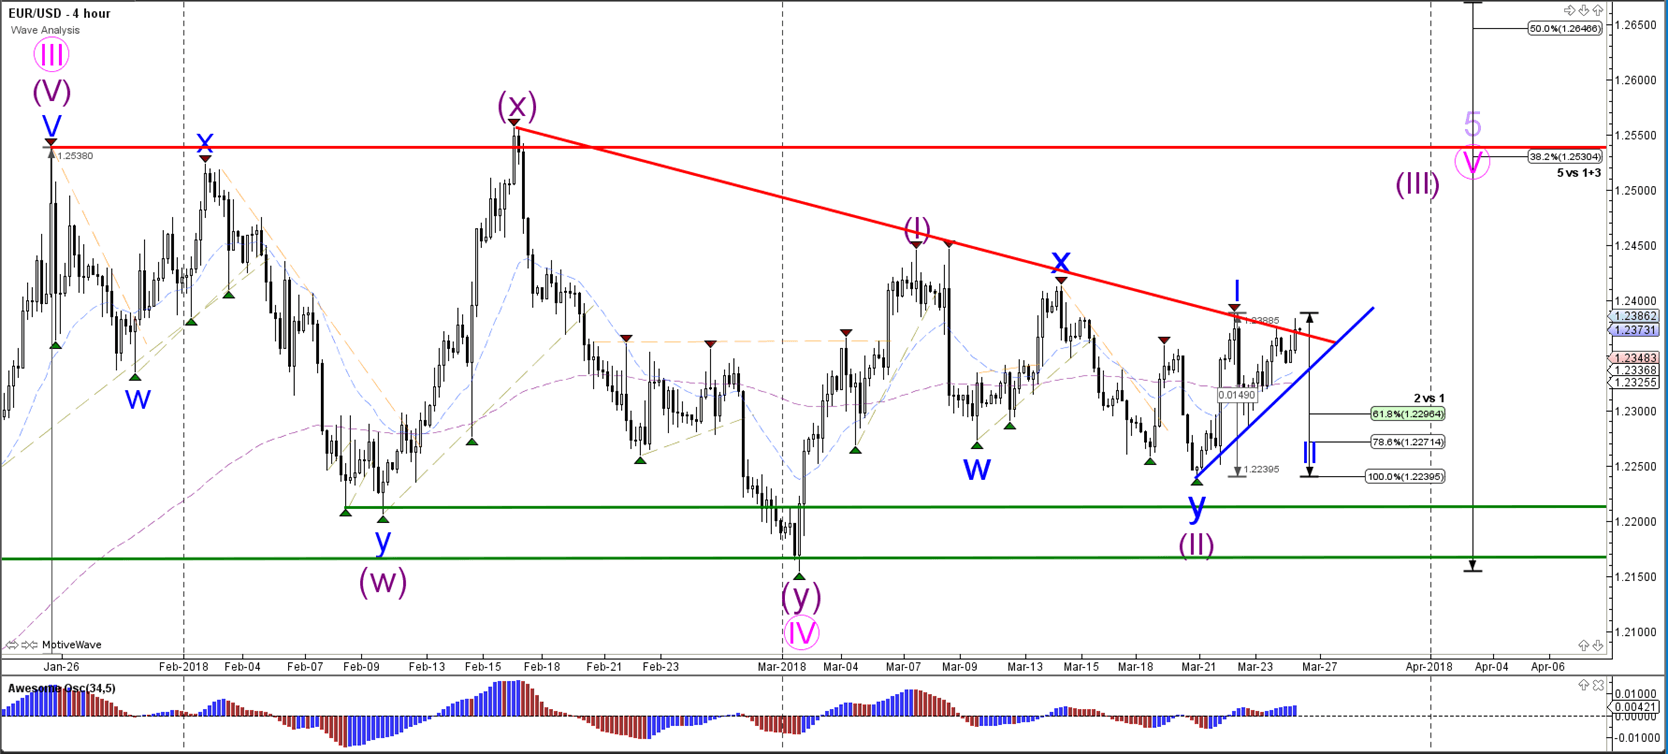
The EUR/USD could be building An ABC correction (green) within wave 2 (blue). A break above the trend line at 138.2% Fib increases the chance of a bullish breakout and the fact that wave 2 (blue) has been completed.
Currency pair GBP/USD
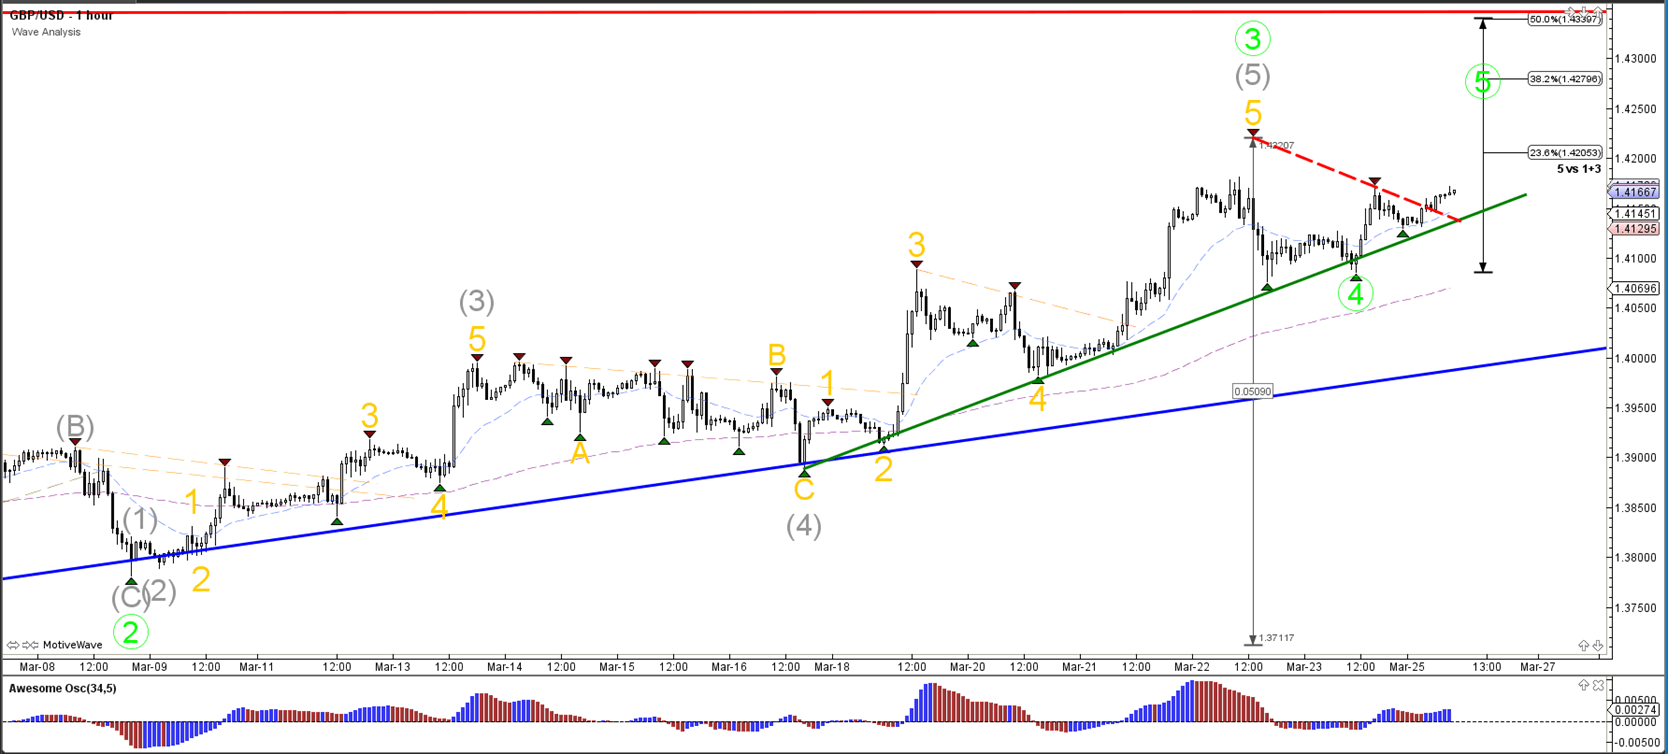
The GBP/USD is in a strong uptrend which is getting closer to testing the previous top (red).Price could now be building a wave 4 (green) retracement.
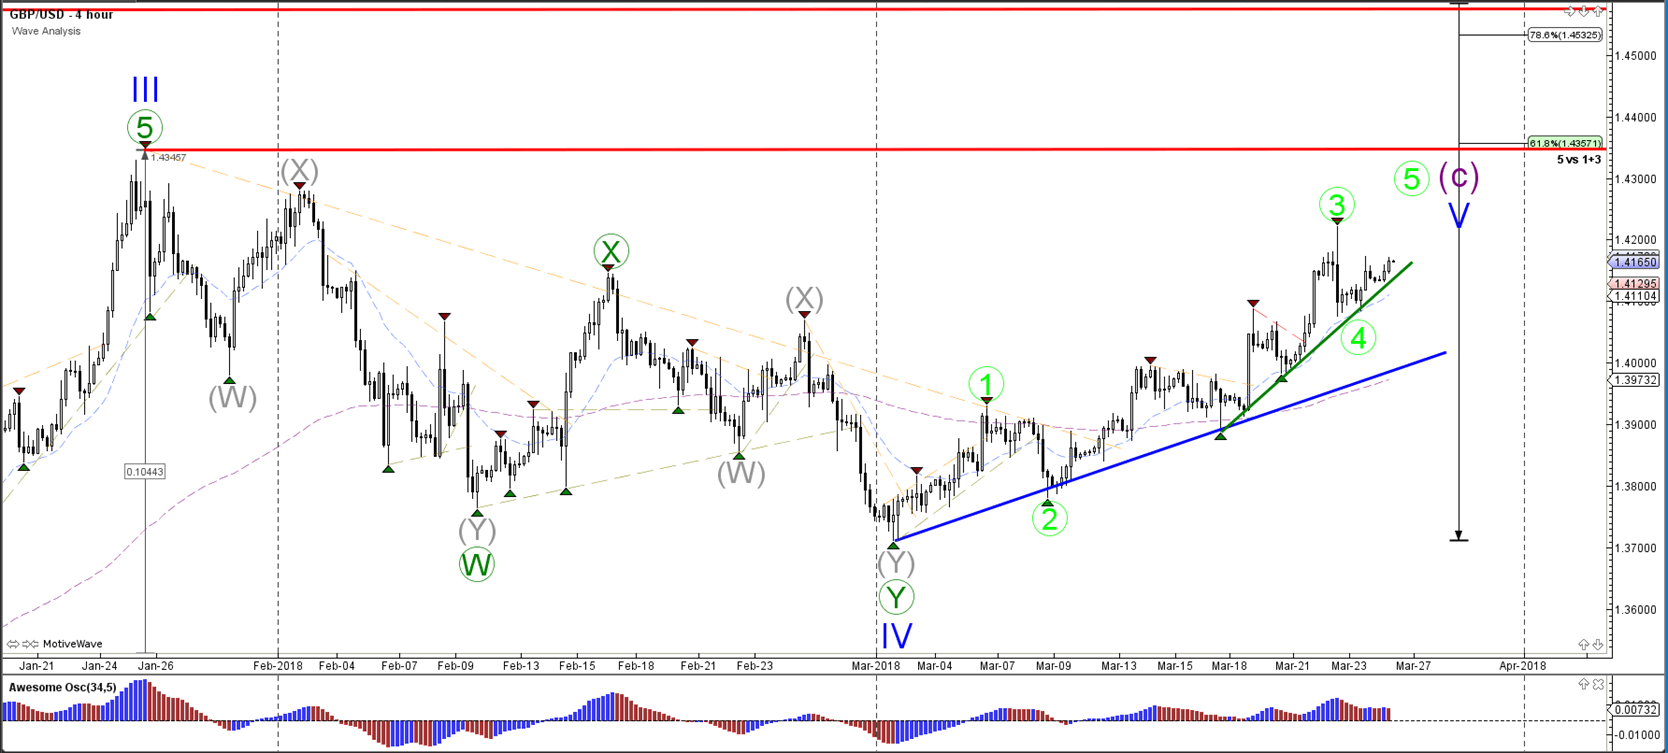
The GBP/USD seems to have completed a wave 4 (green) retracement. A break below support (green) could expand the wave 4 correction whereas a break above 1.42 could indicate the start of wave 5 (green).
Currency pair USD/JPY
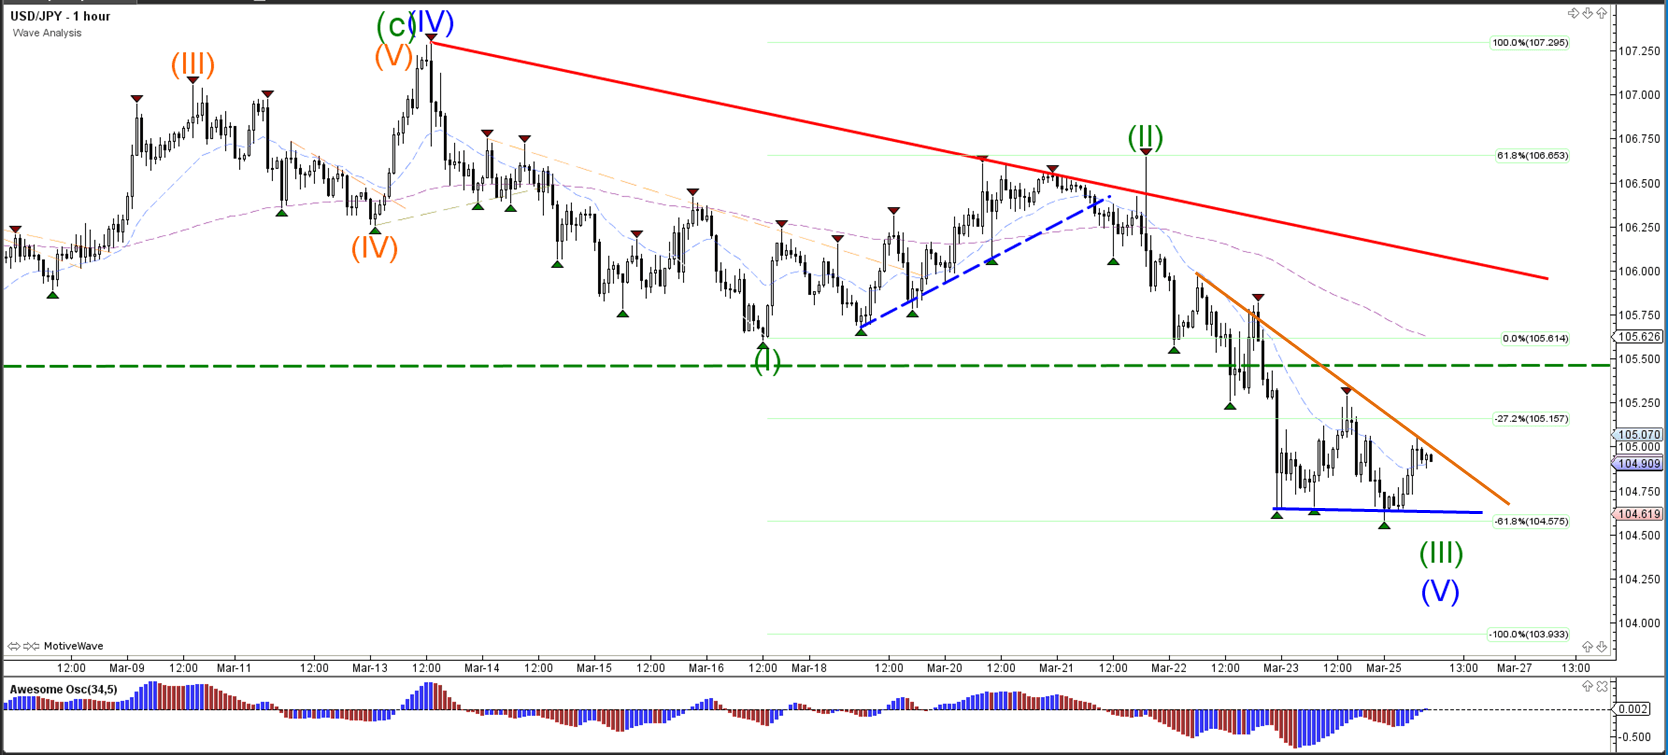
The USD/JPY downtrend is building a consolidation zone below the broken support.
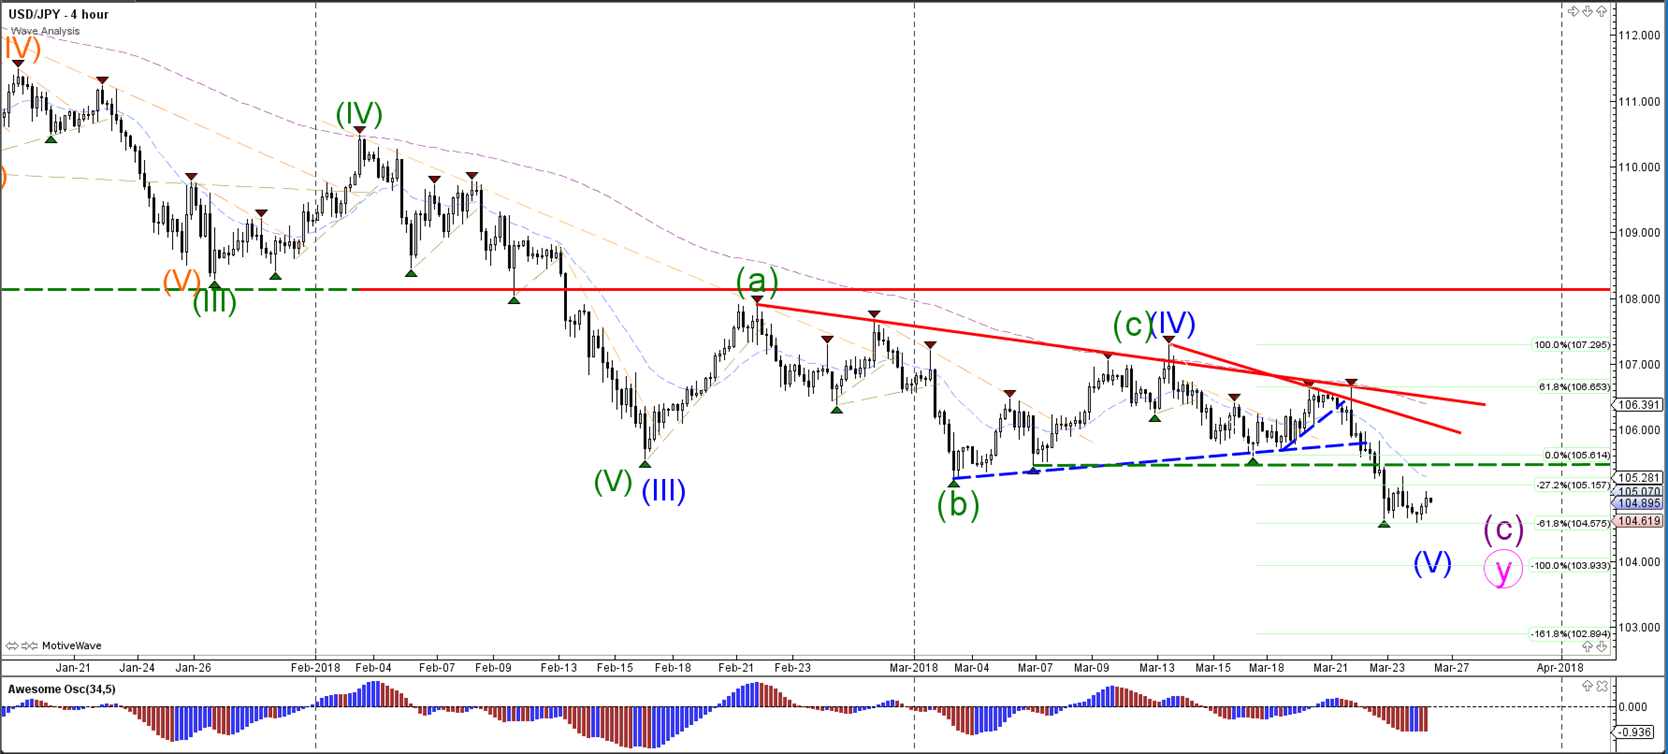
The USD/JPY could be building a descending wedge chart pattern. A break below support could indicate a bearish breakout whereas a bullish break would run into resistance at the broken support (dotted green).
Trade Concerns Remain In Focus This Week
Financial markets remain on high alert as the U.S.-China trade war fears are providing the needed incentive for bears to take control. Friday's sell-off in U.S. equities was ugly, after President Trump announced plans to impose tariffs on up to $60 billion of Chinese imports. The new proposal dragged the S&P 500 down by 2.1% and sent the Dow Jones Industrial Average into correction territory (a 10% fall from its 2018 peak). It was the worst week for the S&P 500 since January 2016 and the fourth worst performance since 2010.
Currently, it remains unclear whether we are headed into a massive trade war. I still believe that President Trump is using his “Art of the Deal” tactics to get better trade deals, while China is following Sun Tzu's philosophy to “win the war with no battle”.
U.S. Treasury Secretary Steven Mnuchin commented over the weekend that he is cautiously optimistic that an agreement would be reached between the U.S. and China, and this would likely calm the markets when the U.S. trading session kicks off. However, the longer the “wait and see” mode lasts, the more pressure will be felt in the equities market. After all, many companies will need to adjust their expansion and capital spending plans according to the new developments. This will certainly impact investor's confidence and risk global economic growth, which has been the key pillar of the nine-year-old bull run.
Last week's risk-off mode did not provide any relief for the greenback. Instead of gaining on the equities sell-off, the U.S. dollar fell to its lowest level against a basket of currencies in five weeks. The biggest risk to the U.S. dollar is China reducing or just scaling back purchases of U.S. Treasury bonds. China holds $1.1168 trillion in U.S. debt as of January, or about 18.7% of all foreign holdings of U.S. bonds, and the U.S. cannot afford to lose the biggest purchaser, when it is currently expanding its budget deficit.
This week's final reading on U.S. and U.K. Q4 economic growth isn't likely to move markets. However, the U.S. consumer will be under the spotlight with consumer confidence, personal income and spending due for release. These sets of data, including the PCE report, are likely to cause slight volatility.
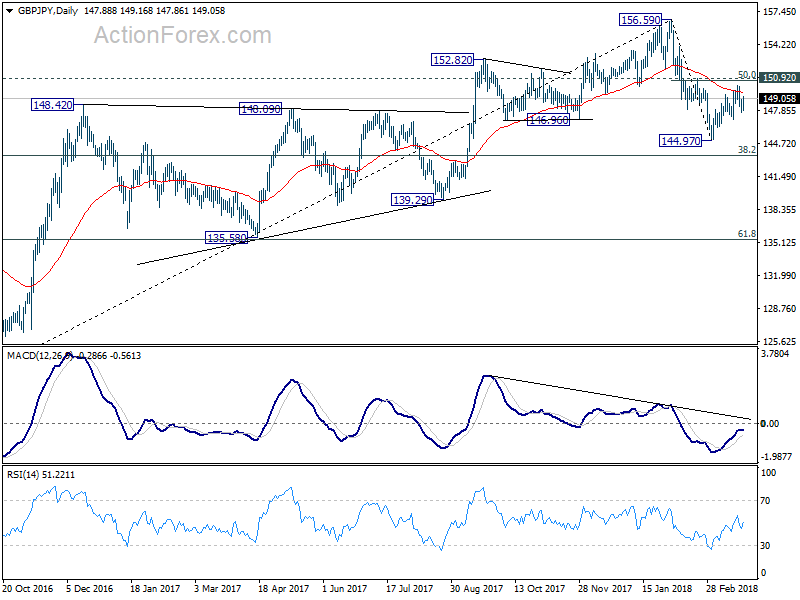
GBP/JPY Daily Outlook
Daily Pivots: (S1) 147.42; (P) 148.19; (R1) 148.72; More...
Intraday bias in GBP/JPY remains neutral at this point. While another rise cannot be ruled out, we maintain the view that rebound from 144.97 is a corrective move. Therefore, strong resistance is expected from 150.92 (50% retracement of 156.59 to 144.97 at 150.78) to bring fall resumption. On the downside, below 147.03 will bring retest of 144.97 low first. Break will extend the decline from 156.59 to 143.51 medium term fibonacci level next. However, sustained break of 150.92 will pave the way back to retest 156.69 high.
In the bigger picture, the case for medium term reversal continues to build up. There is bearish divergence condition in daily MACD. 146.96 support was taken out. And GBP/JPY was rejected by 55 month EMA. Break of 38.2% retracement of 122.36 to 156.59 at 143.51 will pave the way to 61.8% retracement at 135.43 and below. This will now be the preferred case as long as 150.92 resistance holds.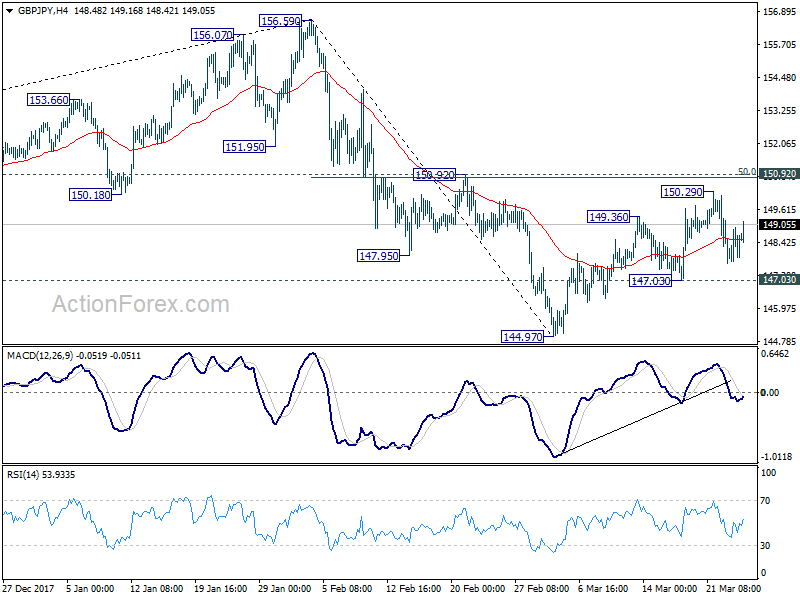
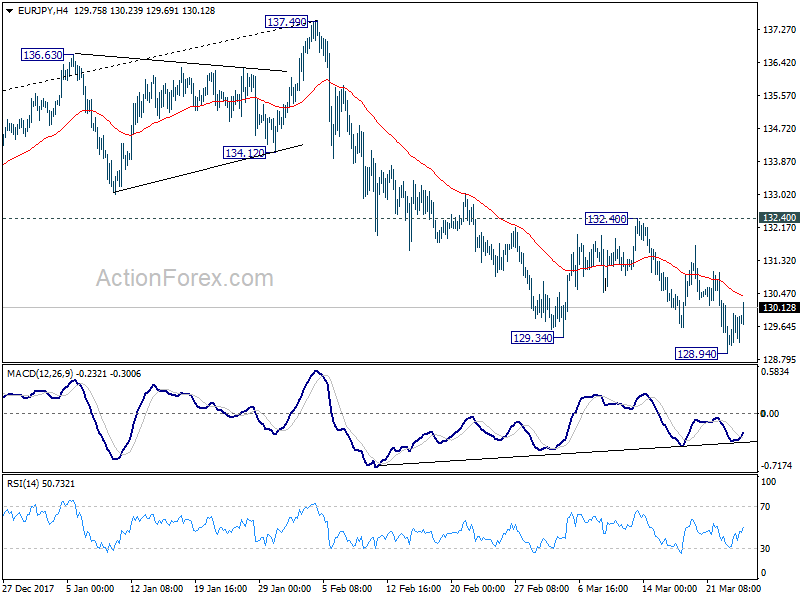
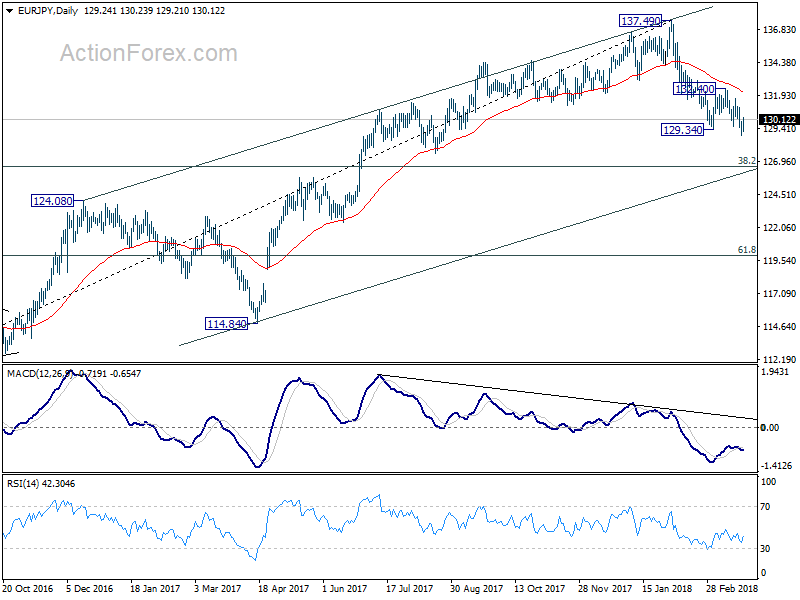
EUR/JPY Daily Outlook
Daily Pivots: (S1) 128.86; (P) 129.42; (R1) 129.90; More....
Today's recovery pulled 4 hour MACD above signal line. A temporary low is in place at 128.94 and intraday bias in EUR/JPY is turned neutral first. Near term outlook will remain bearish as long as 132.40 resistance holds. Break of 128.94 will extend the whole fall from 137.49 to 126.61 medium term fibonacci level next. Nonetheless, break of 132.40 should confirm short term bottoming and turn bias back to the upside for stronger rebound.
In the bigger picture, current development argues that rise from 109.03 (2016 low) has completed at 137.49, on bearish divergence condition in weekly MACD. Deeper fall should be seen to 38.2% retracement of 109.03 to 137.49 at 126.61 first. Sustained break there would pave the way to 61.8% retracement at 119.90. On the upside, break of 132.40 resistance will indicate that the pull back is completed and bring retest of 137.49. But still, break of 137.49 is needed to confirm medium term rise resumption. Otherwise, outlook is neutral at best for consolidations.
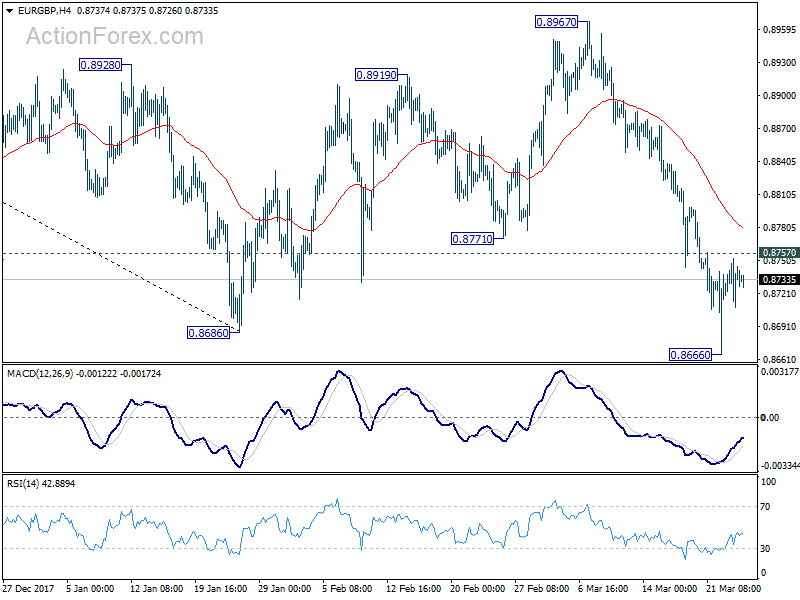
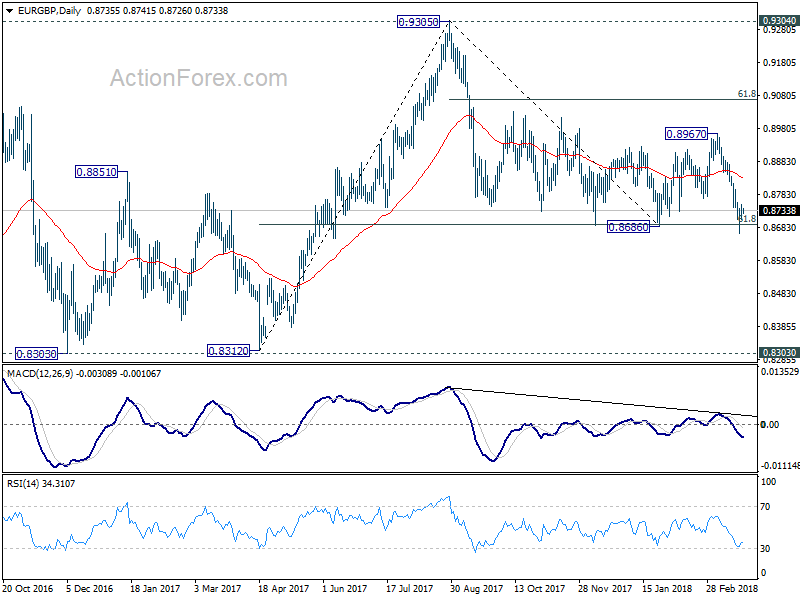
EUR/GBP Daily Outlook
Daily Pivots: (S1) 0.8713; (P) 0.8733; (R1) 0.8757; More...
Intraday bias in EUR/GBP remains neutral for the moment. On the upside, break of 0.8757 minor resistance will turn bias back to the upside to extend recent sideway pattern with another rebound, towards 0.8967. Nonetheless, break of 0.8666 again and sustained trading below 0.8686 will resume whole fall from 0.9305 and target 0.8303 key support next.
In the bigger picture, there are various ways to interpret price actions from 0.9304 high. But after all, firm break of 0.9304/5 is needed to confirm up trend resumption. Otherwise, range trading will continue with risk of deeper fall. And in that case, EUR/GBP could have a retest on 0.8303. But we'd expect strong support from 0.8116 cluster support (50% retracement of 0.6935 to 0.9304 at 0.8120) to contain downside.
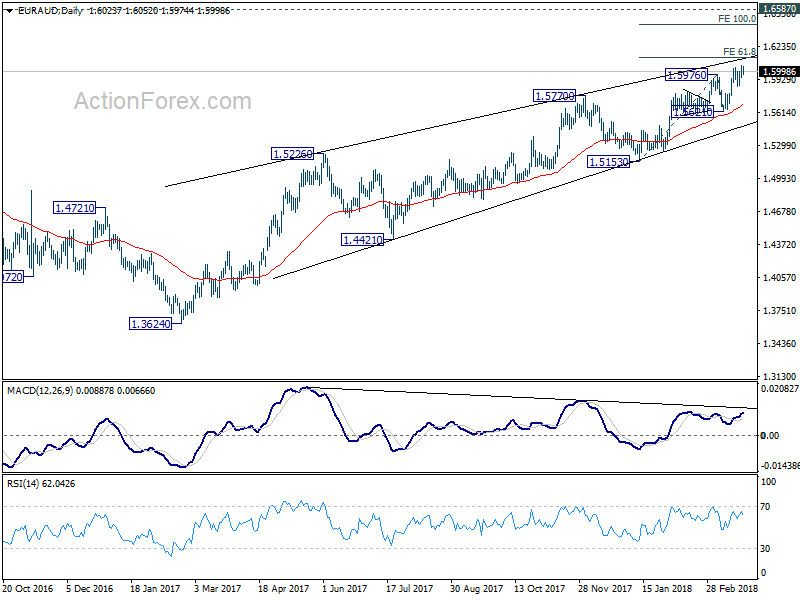
EUR/AUD Daily Outlook
Daily Pivots: (S1) 1.5973; (P) 1.6014; (R1) 1.6085; More....
Intraday bias in EUR/AUD remains on the upside for further rally. Current should target 61.8% projection of 1.5130 to 1.5976 from 1.5621 at 1.6130 first. Break there will target 100% projection at 1.6444 next. On the downside, break of 1.5857 support is needed to indicate short term topping. Otherwise, outlook will remain bullish in case of retreat.
In the bigger picture, current development suggests that rise from 1.3624 is not completed yet. And it's still in progress for 1.6587 key resistance level. We'd be cautious on strong resistance from there to limit upside, on bearish divergence condition in daily MACD. But for now, break of 1.5621 support is needed to be the first sign of medium term reversal. Otherwise, outlook will stays bullish even in case of deep pull back.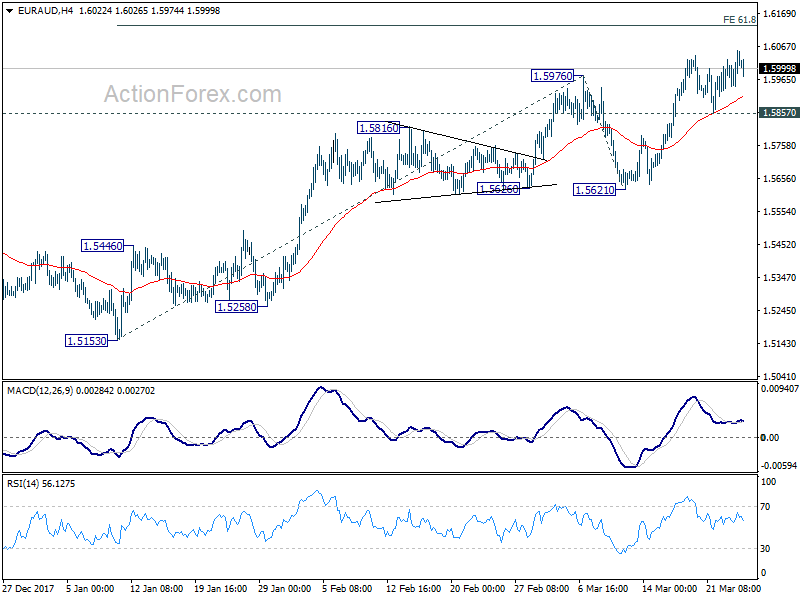
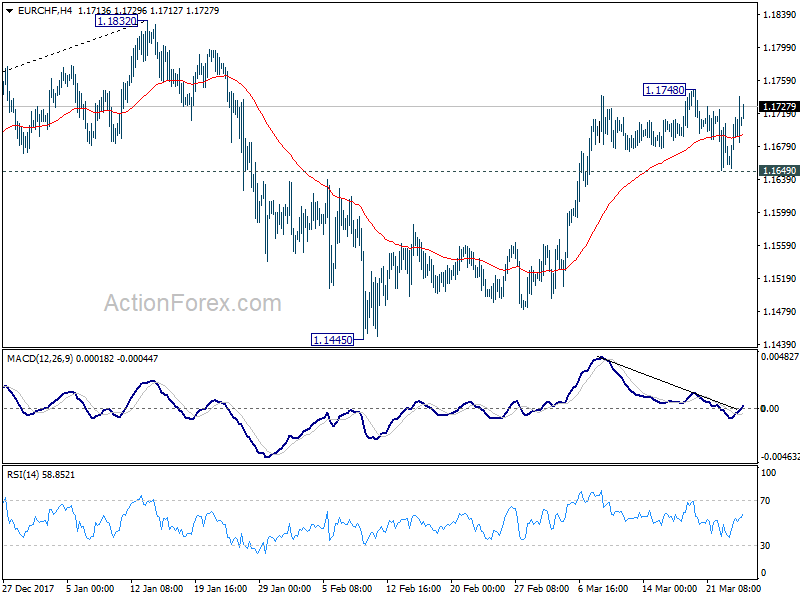
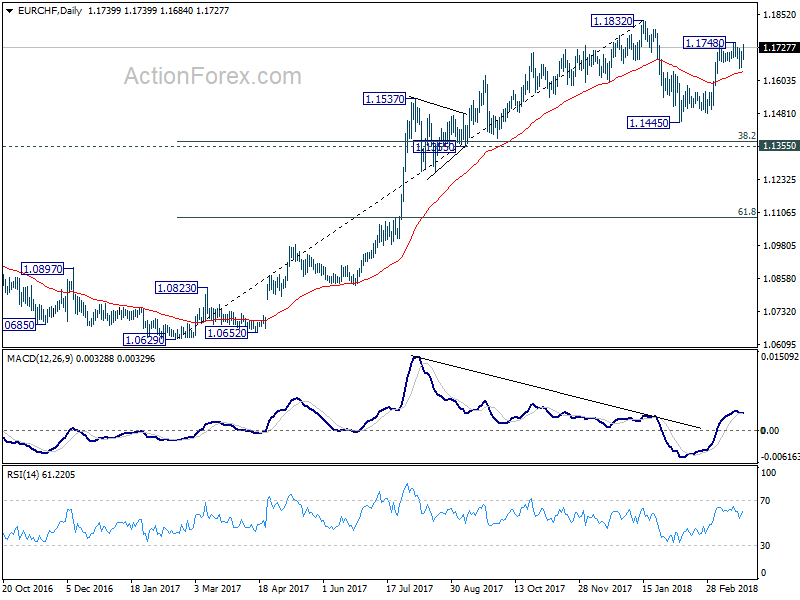
EUR/CHF Daily Outlook
Daily Pivots: (S1) 1.1660; (P) 1.1688; (R1) 1.1722; More...
Intraday bias in EUR/CHF remains neutral for the moment. On the upside, above 1.1748 will resume the rebound from 1.1445 to retest 1.1832 high. But we'd cautious on strong resistance from there to bring another fall to extend recent corrective pattern. On the downside, below 1.1649 minor support will affirm that case that corrective pattern from 1.1832 is extending with another falling leg. And, intraday bias will be turned to the downside for 55 day EMA (now at 1.1635). Sustained break will target 1.1445 support and possibly below. But we'd expect strong support from 1.1355 cluster support (38.2% retracement of 1.0629 to 1.1832 at 1.1372) to complete the correction and bring up trend resumption.
In the bigger picture, a medium term top should be in place at 1.1832 on bearish divergence condition in daily MACD. But there is no indication of long term reversal yet. As long as 1.1198 resistance turned support holds, we'd still expect another rise through prior SNB imposed floor at 1.2000.