Sample Category Title
USD/CHF Consolidation At 0.9475
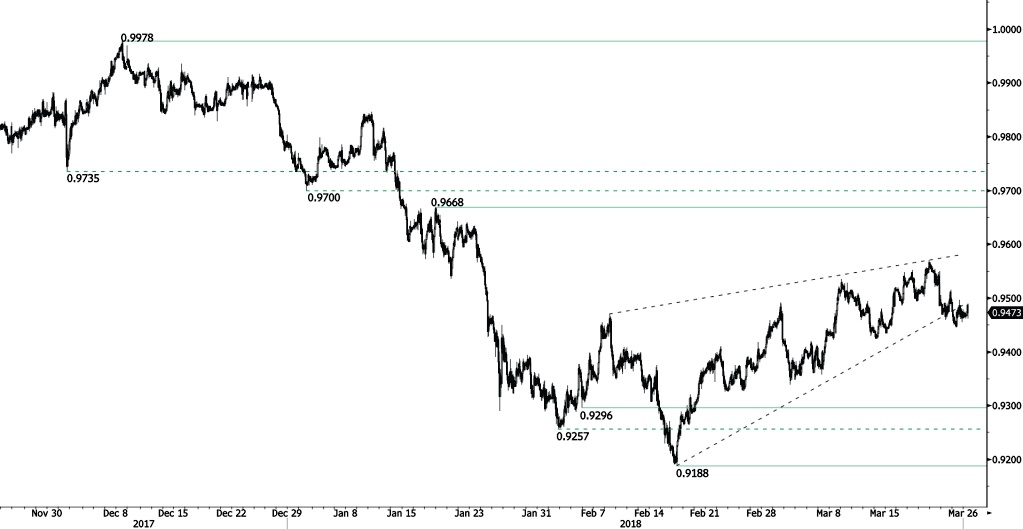
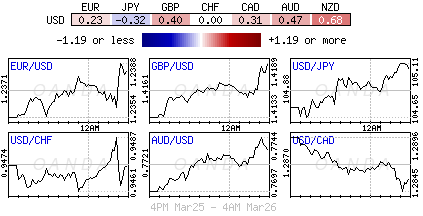
USD/CHF is starting a consolidation phase following recent decrease from 0.9515 high. The pair is heading along the 0.9460 range. The pair is contained between hourly support and resistance given at 0.9296 (05/02/2018 low) and 0.9668 (17/01/2018 high). The technical structure suggests short-term sideway moves.
In the long-term, the pair is still trading in range since 2011 despite some turmoil when the SNB unpegged the CHF. Key support lies at 0.9072 (07/05/2015 low) while resistance at 1.0344 (15/12/2016 high) is distanced. The technical structure favours a long term bullish bias since the unpeg in January 2015.
USD/JPY Losing Steam
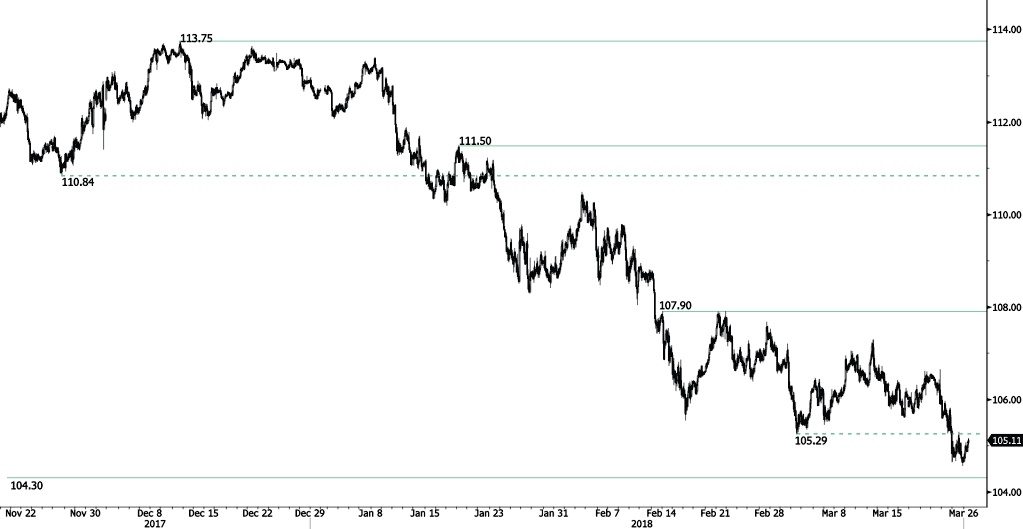
USD/JPY is weakening further following recent rise at 106.64, approaching hourly support given at 104.30 (08/11/2016 low). The pair is expected to head along the 104.50 range. The bearish pattern started in January 2018 is maintained. The short-term technical structure suggests short-term decrease.
We favor a long-term bearish bias. Support remains at 101.20 (09/11/2016 low). A gradual rise toward the major resistance at 125.86 (05/06/2015 high) seems unlikely. Expected to decline further support at 101.20 (09/11/2016 low). The pair trades largely below its 200 DMA.
GBP/USD Edging Higher
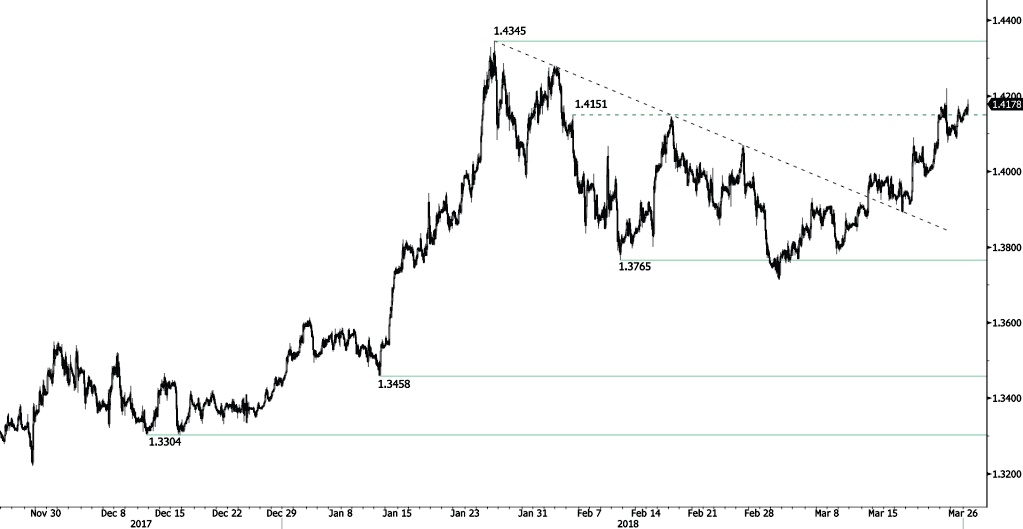
GBP/USD is bouncing off from 1.4076 low, approaching the 1.42 range and expected to maintain its short-term bullish trend started in March. The pair is contained between hourly support and resistance given at 1.3765 (09/02/2018 low) and 1.4345 (25/01/2018 high). The technical structure suggests short-term upward moves.
The long-term technical pattern is reversing. The Brexit vote had paved the way for further decline but the pair is moving to 2016 highs. Long-term support and resistance are given at 1.1841 (07/10/2017 low) and 1.5018 (24/06/2016 high).
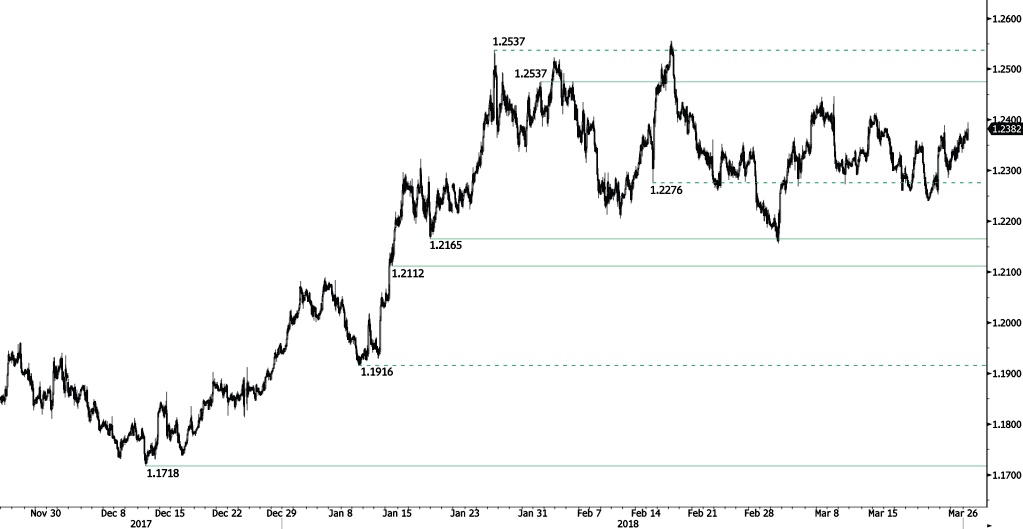
EUR/USD Grinding Higher
EUR/USD continues its rise from recent low at 1.2240 (20/03/2018), approaching the 1.24 range. Hourly support and resistance are given at 1.2165 (17/01/2018 low) and 1.2537 (31/01/2018 high). The technical structure suggests further short-term increase.
In the longer term, the momentum is turning largely positive. We favor a continued bullish bias. Key resistance is holding at 1.2886 (15/10/2014 high) while strong support lies at 1.1554 (08/11/2017 low).
Trade War Worries Ease As Risk Appetite Rebounds
There are some tentative signs that investor fears of an escalation of trade tensions are beginning to ease. A rebound in global equities overnight is offering the market some optimism of stabilization after last week's rout.
Global sovereign yields have also backed up, whilst the safe-haven yen (¥105.00) has slipped back from last weeks strongest print in more than 18-months and gold has trimmed some of last Friday's advance.
In this holiday shortened trading week there are a number of key releases with final Q4 GDP's being released in France, the U.K and the U.S.
Elsewhere, for February, Japan will post its industrial production (IP), unemployment, retail sales and consumer prices.
There are no central bank meetings scheduled for this week. In Europe, the March EC business and consumer confidence survey – important to the European Central Bank (ECB) – will be released.
Stateside on Thursday, U.S personal income and spending data for February are due to be released.
1. Global equities rebound
In Japan, stocks have rebounded from near-six-month intraday lows to finish strongly higher thanks to a roughly +0.5% pullback for the yen against some major global currencies. Overnight, the Nikkei finished at session highs in rising +0.7% – it was down -1.3% soon after the open. Despite concerns about US/China trade conflicts, buyers stepped in following the Nikkei's -4.5% collapse Friday.
Down-under, the Aussie ASX 200 closed at more than five-month low on Monday, down -0.5%, mirroring stateside losses amid lingering fears a potential U.S/China trade could hurt global growth and corporate earnings. In S. Korea, stocks rebounded strongly after first-hour weakness, with the market ultimately finishing at session highs. The Kospi rallied +0.8%, supported by chip firms Samsung and SK Hynix up +1.1%.
In Hong Kong, stocks reversed earlier losses to end higher overnight, as trade war worries eased after reports the U.S and China commenced talks to improve U.S access to Chinese markets. At close of trade, the Hang Seng index was up +0.79%, while the Hang Seng China Enterprises index rose +0.57%.
In China, a last-hour burst of buying in Chinese stocks, which had already rebounded from morning lows, helped the market look much better after Friday's trade-fuelled slide. The Shenzhen Composite finished with a +1.3% gain after falling -2.3% earlier. However, 'big caps' remained down for the day, with the Shanghai Composite falling for a fourth consecutive session, declining -0.6%.
In Europe, regional indices trade mostly higher across the board recovering from early weakness following a rebound in U.S Equity futures after a sharp selloff on Friday.
U.S stocks are set to open deep in the 'black' (+1.1%).
Indices: Stoxx600 +04% at 367.1, FTSE +0.4% at 6946, DAX +0.6% at 11955, CAC-40 +0.4% at 5113, IBEX-35 +0.1% at 9405, FTSE MIB -0.3% at 22226, SMI +0.8% at 8634, S&P 500 Futures +1.1%
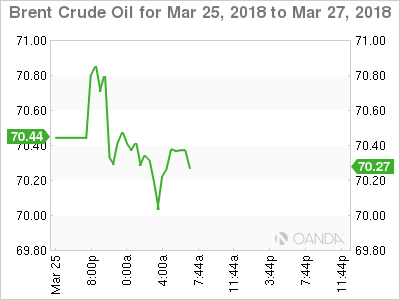
2. Oil prices fall as U.S/China trade dispute looms, gold lower
Crude oil futures have dipped early Monday on concerns of a looming trade dispute between the U.S/China weighed on global markets.
Brent crude futures are at +$70.18 per barrel, down -27c, or -0.4%, while West Texas Intermediate (WTI) crude futures are at +$65.49 a barrel, down -39c, or -0.6%, from Friday's close.
Baker Hughes data last week showed that crude prices have also been weighed down by a rise in the number of U.S rigs drilling for oil to a three-year high of 804, implying further rises in production – its already jumped by a quarter since mid-2016 to +10.4m bps.
Note: In Asia, Shanghai crude oil futures debuted strongly, both in terms of volume and prices, with front-month contracts soaring as much as +6% as investors bought into the world's newest financial oil trading instrument.
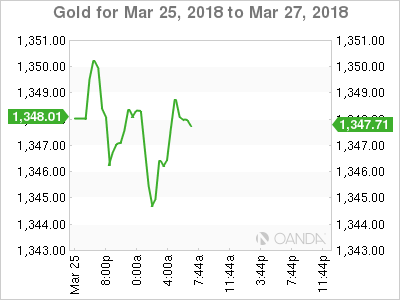
Ahead of the U.S open, gold prices have inched a tad lower from their five-week high hit earlier in the session, on profit-taking and as fears of a U.S/China trade war eased following reports of negotiations among two of the world's leading economies. Spot gold is down -0.1% at +$1,346.01 per ounce.
Note: Earlier in the session, gold prices climbed as much as +$1,350.76 per ounce, their highest since Feb. 19.
3. Yields back up as tension eases
News of the U.S/China negotiating a possible 'truce' ahead of the imposition of tariffs is giving capital markets some hope that a trade war between the U.S and China may not happen.
In light of heightened trade and geopolitical tensions, the 10-year German bund yields remain well below the psychological +0.60% print. Early Monday, the 10-year Bund yield is trading at +0.53%, little changed from Friday's closing level.
With very little supply pressure this week in the eurozone, and month-end looming, fixed income dealers do not anticipate Euro yields to rally too far from current levels.
Note: Today, Italy offers a total of up to +€5.5B in a new zero-coupon note and a new inflation-linked bond, while on Wednesday it offers up to +€7.5B in five- and 10-year conventional and seven-year floating-rate notes.
Stateside, the U.S Treasury is poised to bring to market this week its largest sale of debt ever – approximately +$294B of short-term paper. The yield on 10-year Treasuries has increased +3 bps to +2.85%.
Elsewhere, the U.K's 10-year yield has rallied +3 bps to +1.462%.
4. Dollar finds its second wind
Some of the recent risk aversion flow has retreated a tad in the overnight session, with dealers noting a “reduction” in the current phase of trade talks.
Weekend reports noted that U.S Treasury Secretary Mnuchin was more “optimistic” in reaching an agreement with China noted that recent conversations with China were “very productive”.
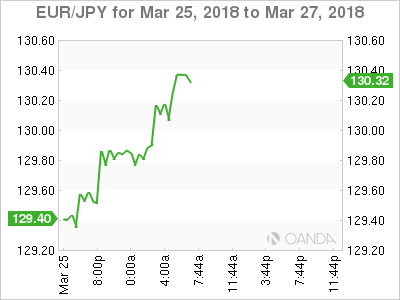
That has helped lift the mood among investors, softening the safe-haven yen (¥105.00) in the process. The yen is down roughly -0.4% against its major peers with the EUR (€1.2411) and the pound adding +0.7% (£1.4220) each. Sterling remains supported as Brexit optimism and expectations of monetary policy tightening by the BoE continue to fuel investors' demand for the currency.
Note: BoE member, Gertjan Vlieghe's, latest comments gave implicit support to the currently steeper U.K. rate curve.” Mr. Vlieghe said last week that there may be one or two rate hikes a year in this tightening cycle.
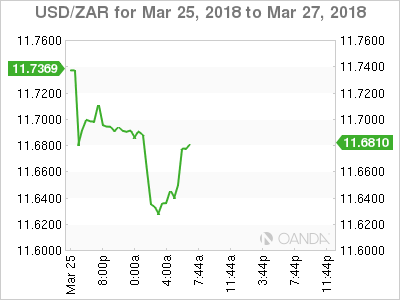
The South African rand (ZAR) continues to find support after Moody's kept South Africa's investment grade rating on Friday and upgraded the country's rating outlook from negative to stable. USD/ZAR ($11.6504) has fallen to a new one-month low.
5. Politics in Italy and Spain
Italy's 5-star and League parties are said to have reach an agreement on election of parliamentary speakers.
On Saturday, Mr. Di Maio and Mr. Salvini struck a deal to join forces in the parliamentary vote to elect speakers for the upper and lower houses — fuelling talk that they could team up to form a government in Rome. Roberto Fico was elected as President of the lower house and Forza Italia member Elisabetta Casellati as president of the Senate.
Italian President Mattarella formally asked PM Gentiloni to resign on Saturday, Mar 24th (as expected).
Note: An alliance between the populists Five-Star and the League, which is strongly Eurosceptic, is considered the worst scenario for E.U policymakers and investors. They fear it could lead to economic reforms introduced in recent years being reversed and defiance of Brussels on everything from budget rules to sanctions against Russia.
In Spanish politics, police officials in Germany detained former Catalonia leader, Carles Puigdemont, on the weekend – acting on an international arrest warrant issued by a judge in Spain.
Copper – Bears Extend And Look For Test Of Weekly Cloud Top
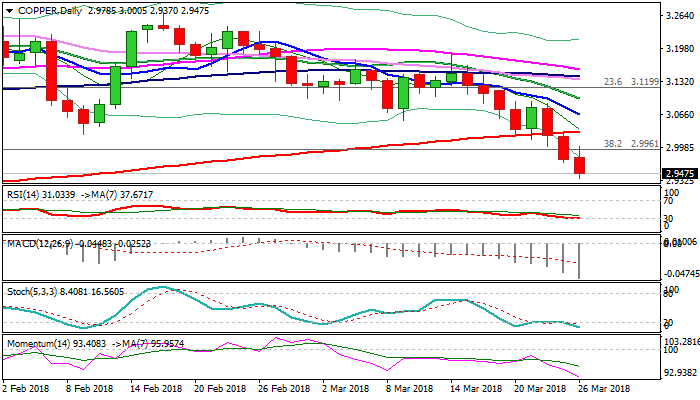
Copper remains firmly in red at the beginning of the week and slid to new multi-month low at $2.9370 (the lowest since late Sep 2017) on probes below key support at $2.9425 (05 Dec low).
The metal holds in strong bearish mode which resulted in strong bearish close last week and came under fresh pressure on Monday on sharp rise in copper inventories.
Strong concerns about possible trade war on US tariffs on imported metals from China could further depress metal’s price if current talks about finding solution did not result in positive outcome.
Close below $2.9425 will be strong bearish signal for test of the top of rising weekly cloud ($2.9212) and extension towards rising weekly 55SMA ($2.9234).
Break here would risk test of $2.8930 (17 Sep trough / near 50% of $2.4720/$3.3200 rally).
Strongly oversold conditions of daily slow stochastic have so far been ignored, but some corrective action in coming sessions could be anticipated, as bears may also show hesitation on approach to rising thick weekly Ichimoku cloud.
Res: 3.0000, 3.0250, 3.0322, 3.0540
Sup: 2.9370, 2.9212, 2.9000, 2.8930
Spot Gold Bull On Hold On Monday, Eye US-China Talks
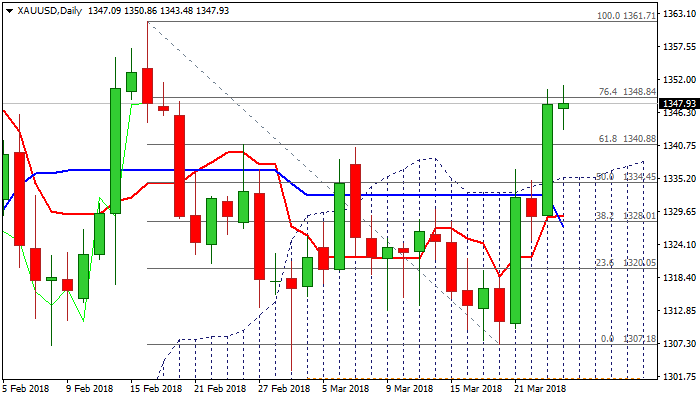
Spot Gold holds within narrow consolidation under fresh five-week high ay $1350 and holding firm tone after strong rally last Friday and strong bullish close of the last week.
The yellow metal benefited on increased safe-haven demand on global trade war fears and extended strong recovery from $1307 (20Mar low).
Bulls eye recent peaks of 16 Feb and 25 Jan at $1361 and $1366 respectively, however, bulls may hold in extended consolidation before final push higher.
Overbought slow stochastic and talks between the US and China over new tariffs may ease persisting fears of global trade war on positive outcome.
Current consolidation was so far limited and keeps intact initial support at $1340 (former high (Fibo 23.6% of $1307/$1350 recovery), loss of which would expose key near-term support at $1335 (daily cloud top / Fibo 38.2%).
Res: 1350, 1355, 1357, 1361
Sup: 1343, 1340, 1335, 1330
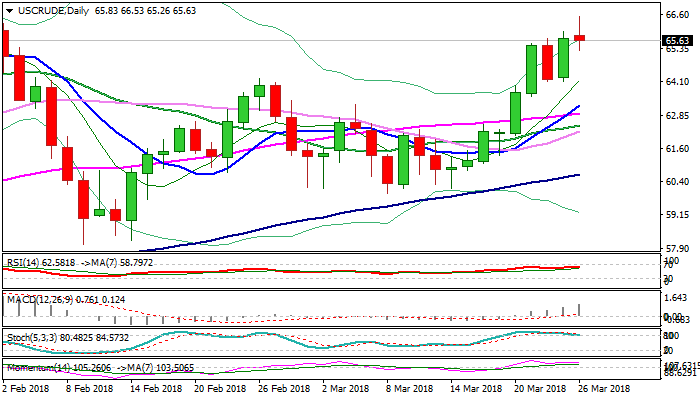
WTI OIL – Bulls Are Taking A Breather Ahead Of Key $66.64 Barrier
WTI oil trades lower in mid-European session after hitting new two-month high at $66.53 in early Monday’s trading.
Fresh extension of Friday’s strong rally showed signs of stall just ticks ahead of 25 Jan recovery high at $66.64 (the highest since Nov 2014), signaling that bulls may enter consolidative / corrective phase before resuming.
The notion is supported by overbought daily slow stochastic which is attempting to emerge from overbought territory and generate firmer bearish signal.
Initial support lies at $65.01 (Fibo 23.6% of $60.11/$66.53 rally) which should ideally hold, however, deeper dips towards strong supports at $64.22/08 (26 Feb former high / Fibo 38.2%) cannot be ruled out.
Caution on break below $64.22/08 pivots, which could signal deeper correction and sideline immediate bulls.
Overall bullish structure favors further upside, with firm break above $66.64 required to confirm an end of $66.64/$58.06 corrective phase and signal continuation of broader recovery from $26.04 (2016 low).
Concerns about global trade war weighs on oil bulls, along with rising US oil production after the latest data showed the number of rigs drilling for oil rose to the highest in three years.
On the other side, long bullish weekly candle of last week, underpins, as oil price is on track for bullish monthly close which could further boost bulls on formation of monthly bullish engulfing.
Res: 65.98, 66.53, 66.64, 67.00
Sup: 65.26, 65.01, 64.22, 64.08
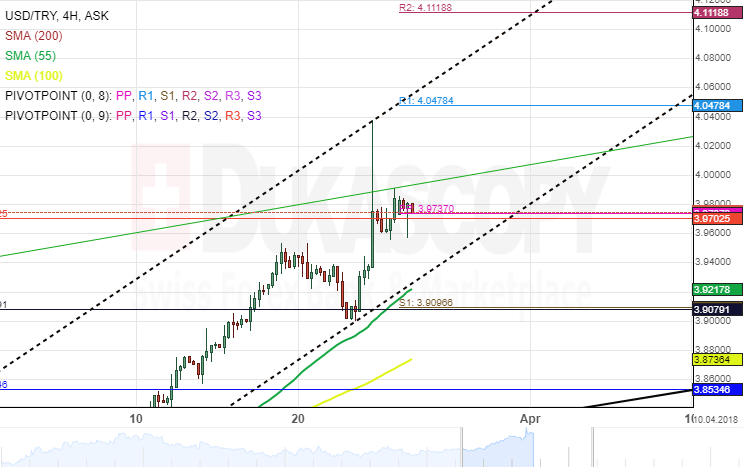
USD/TRY 4H Chart: Moving Towards Target
The US Dollar has appreciated substantially against the Turkish Lira during the past few months. The bullish momentum has been steered by an ascending channel since September 12, 2017.
The USD/TRY exchange rate has breached a resistance cluster set by the weekly and the monthly pivot points near 3.9737 where the upper trend-line is located.
Everything being equal, analysts project the target for the currency exchange rate is likely to be the weekly R1 at 4.0478. However, a corrective move south is expected during the following trading sessions. Meanwhile, technical indicators suggest the rally could continue until the pair reaches the aforementioned resistance.
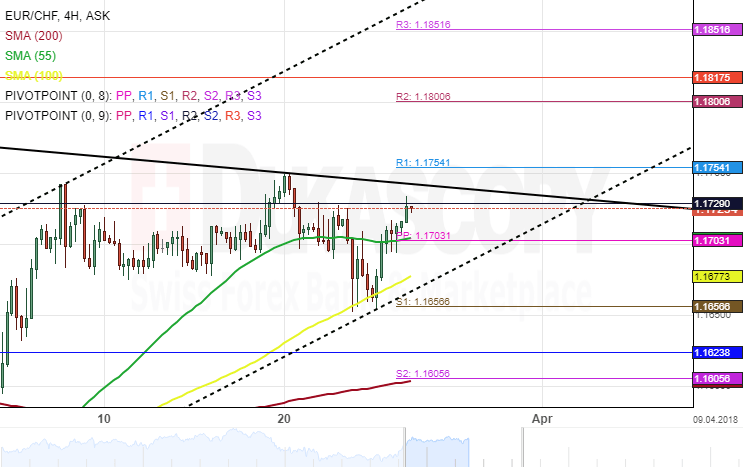
EUR/CHF 4H Chart: Increases Trading Range
The common European currency has been constrained in an ascending channel against the Swiss Franc. The rate bounced off the lower boundary of a junior channel and has since remained bullish.
In the four-hour time frame, the EUR/CHF is trading in a medium-scale triangle. A support cluster set by the weekly pivot point and the 55– hour simple moving average near 1.1703 was providing support for the currency pair.
If the aforementioned support cluster holds, a breakout through the upper boundary of the triangle is likely to occur during the following trading sessions. In addition, technical indicators are in favour for bulls to continues their presence in the short term.