Sample Category Title
Forex Technical Analysis: EUR/USD, USD/JPY, GBP/USD
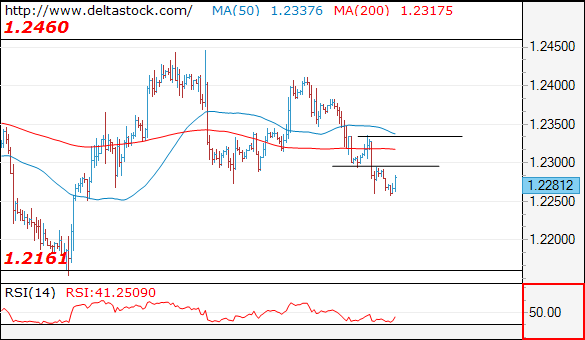
EUR/USD
Current level - 1.2281
I favor a reversal around current levels, for a break through the crucial 1.2340, towards 1.2460.
| Resistance | Support | ||
| intraday | intraweek | intraday | intraweek |
| 1.2290 | 1.2460 | 1.2260 | 1.2160 |
| 1.2460 | 1.2560 | 1.2160 | 1.2090 |
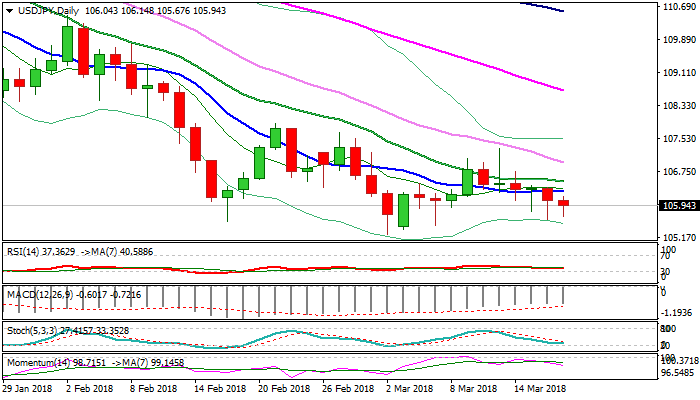
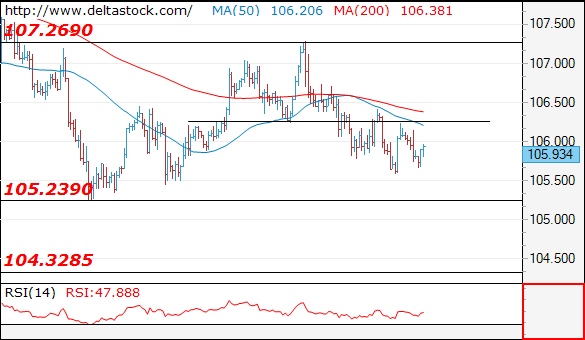
 USD/JPY
Current level - 105.93
Expect a reversal above 105.20 to initiate another leg upwards, to 107.30 area.
| Resistance | Support | ||
| intraday | intraweek | intraday | intraweek |
| 106.40 | 108.30 | 105.20 | 105.20 |
| 108.00 | 110.40 | 105.20 | 102.40 |
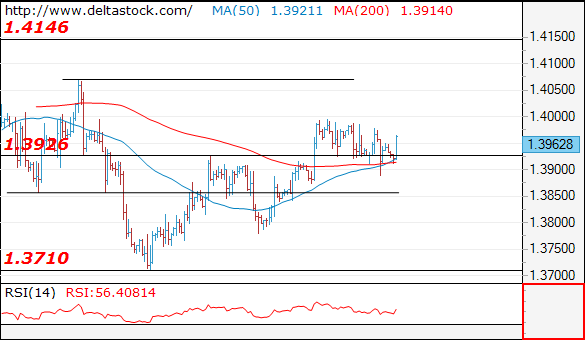
GBP/USD
Current level - 1.3962
My outlook is bullish, for a break through 1.4000, towards 1.4150 area.
| Resistance | Support | ||
| intraday | intraweek | intraday | intraweek |
| 1.4000 | 1.4150 | 1.3870 | 1.3710 |
| 1.4150 | 1.4280 | 1.3830 | 1.3620 |
Gold Analysis: Approaches 2018 Low
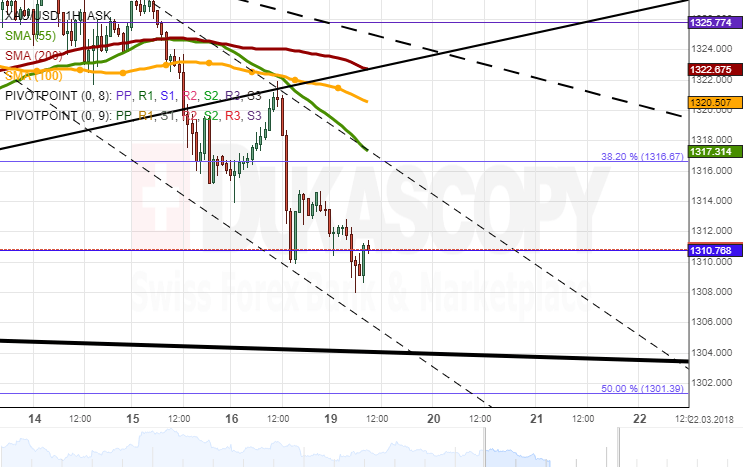
Bears continue dominating the market for the third consecutive session. A period of recovery early was disrupted by the combined resistance of the 55– and 100-hour SMA on Friday. The subsequent fall was caused by stronger US Dollar which pushed the rate down to the 1,310.00 mark.
Thus, the yellow metal is moving closer to the 2018 low of 1,305.00—a level which coincides with the bottom boundary of a medium-term channel. It is likely that this area is reached during this session; however, technical indicators being at generally low levels do suggest that a recovery should follow.
The northern barrier is guarded by the 55-, 100– and 200-hour SMAs. In case no fundamental event shake the market, this resistance might not be reached today.
USDJPY Analysis: Fails To Overcome 55-Hour SMA
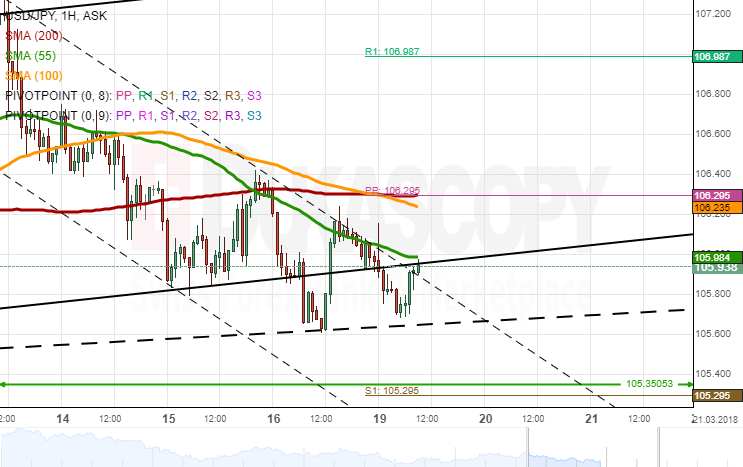
The US Dollar continues to weaken against the Yen for the fourth consecutive session. Some upside potential was apparent mid-Friday when bulls responded positively to US fundamentals.
This appreciation, however, was stopped by the 55-hour SMA near 106.20 which continued to guide the pair during the following hours. As a result, the Greenback breached a two-week channel up and was located near a trend-line early today.
Technical indicators are bearish. This means that the 2017/2018 low of 105.35 could occur soon. A further fall is unlikely, given that this area is likewise supported by the weekly S1.
In terms of upside potential, the ultimate high in this session should be the 100– and 200-hour SMAs and the weekly PP if no positive developments add some additional strength to bulls.
GBPUSD Analysiss: Returns To 1.39
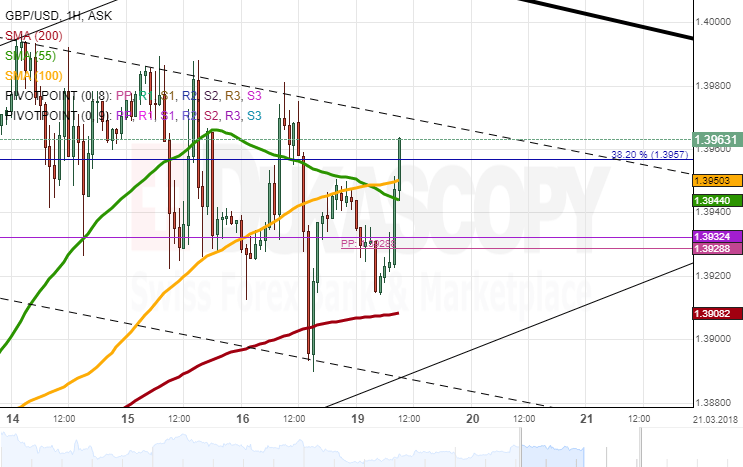
The GBP/USD exchange rate showed high volatility on Friday. It began the day with minor appreciation prior to falling 0.56% after a US data release mid-session. This three-hour decline was stopped by the 200-hour SMA near the 1.39 mark. The Pound's subsequent movement was stranded between this moving average and the 55– and 100-hour SMAs.
The rate might still edge lower down to the bottom boundary of a three-week channel. A subsequent fall is expected to be limited by the 200-hour SMA at 1.39.
Technical indicators are generally bullish for the following trading session, thus favouring a price increase towards the 1.40 area where the senior channel is located.
Meanwhile, G20 meetings are to dominate the political and economic environment during the following two days.
EURUSD Analysis: Tests Senior Channel
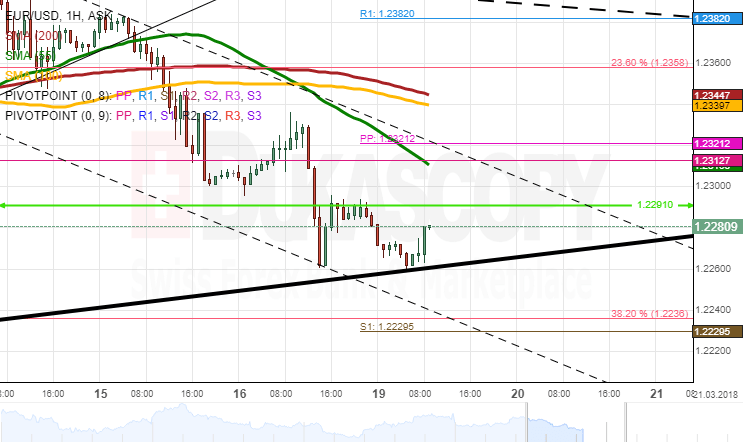
The Euro was appreciating steadily against the Greenback on Friday morning. The pair, however, was unable to reach the combined resistance of the 55-, 100– and 200-hour SMAs, as it started falling substantially mid-session. The rate plunged 70 pips within three hours prior to consolidating around 1.2280.
As apparent on the chart, the Euro was testing the bottom boundary of a six-month channel up and the weekly S1 on Monday morning. The pair might still edge slightly lower down to the 38.20% Fibonacci line at 1.2240 prior to bouncing off this long-term pattern. It is expected that the pair hinders near 1.23 for a few hours prior to targeting the 1.2340 area.
Even though no data releases are scheduled for today, political events in the G20 summit might cause some turbulence during the following two days.
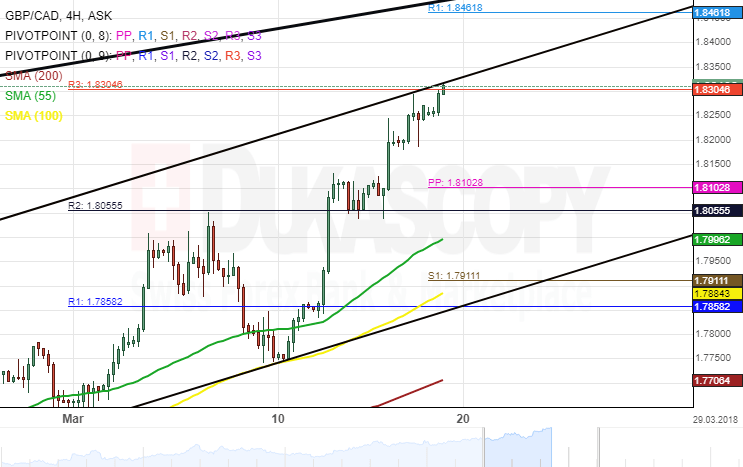
GBP/CAD 4H Chart: Reaches Nine-Month High
The British Pound has been trading in a long-term ascending channel against the Canadian Dollar. The rate bounced off the bottom boundary of a dominant pattern on September 8, 2017, and has since reached a nine-month high at 1.8294.
Given that the exchange rate is moving towards the upper border of a secondary channel, a breakout is likely to occur during the following trading sessions. However, a resistance set by the monthly R3 at 1.8304 could force the currency pair to retrace south.
Technical indicators suggest that the GBP/CAD exchange rate could continue trading upside. Nevertheless, a retracement south is likely within the next 72 hours.
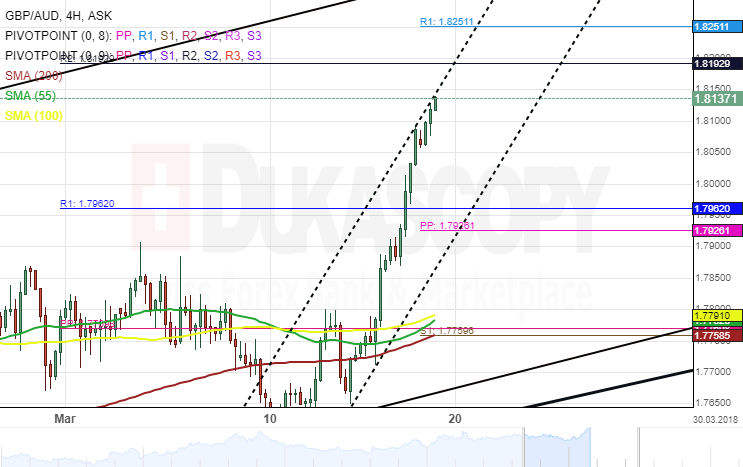
GBP/AUD 4H Chart: Moving Towards Target
The Pound Sterling has been strengthening in an ascending channel against the Australian Dollar. The pair has remained trading in several ascending channels and as a result, reached a four-month high.
The currency pair has moved closer to the border of a junior pattern and a breakout could be expected through the upper boundary during the following trading sessions.
The closest upside target is the weekly R1 at 1.8251, however, from a theoretical point of view, the exchange rate has to make a corrective move south for a re-test of the monthly PP at 1.7962.
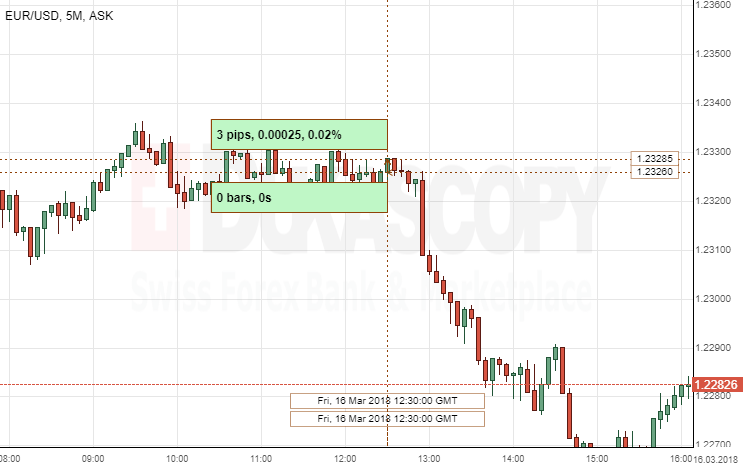
EUR/USD: US Building Permits
The Greenback weakened against the European single currency, following the release of the US building permits report. The EUR/USD currency pair gained only three base points, or 0.02%, reaching the 1.2328 level.
The US Census Bureau revealed on Friday that the US building permits data did not meet expectations, showing the growth pace of only 1.30M units in February, following the downwardly revised 1.38M reading in the prior month. The stronger-than-expected fall in the US homebuilding was caused by a plunge in the multi-family housing construction offseting a rise in single-family projects for the second month in succession.
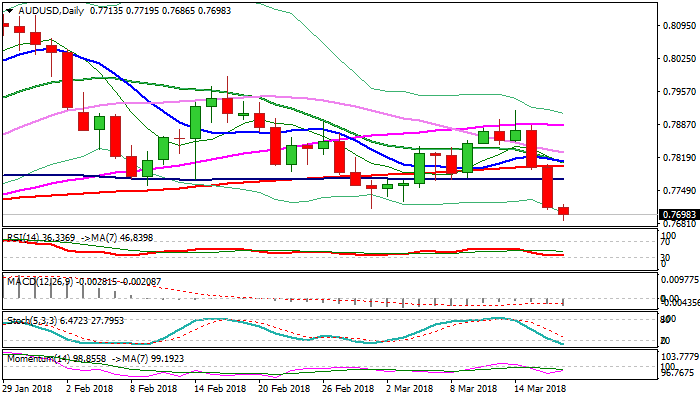
Technical Outlook: AUDUSD – Bears Look For Extension Of Last Week’s Strong Fall
The Australian dollar stays in red at the beginning of the week and extends below key support at 0.7712 (01 Mar former low).
Extension of last Thu/Fri sharp fall eyes Fibo 123.6% projection at 0.7664 and could stretch to test weekly cloud base at 0.7641, break of which would generate next strong bearish signal.
Last week's bearish engulfing was negative signal, with firmly bearish daily techs favoring further weakness, as concerns about trade war keeps the Aussie pressured.
Bears may take a breather in coming sessions as slow stochastic is oversold on daily chart, but so far lacking signal.
Broken former low at 0.7712 now acts as initial resistance with stronger upticks to be ideally capped by broken 100SMA (0.7773).
Res: 0.7712, 0.7773, 0.7800, 0.7817
Sup: 0.7664, 0.7641, 0.7600, 0.7586
Technical Outlook: USDJPY – Bears Remain Firmly In Play But Stronger Action Could Be On Hold Until FOMC
The pair holds in red on Monday and probes again through 106 support (Fibo 61.8% of 105.24/107.29 upleg), following last Friday’s short-lived dip to 105.60, two-week low).
Negative daily techs maintain pressure as last week’s strong upside rejection under falling 30SMA weighs.
Bears eye lower 20-d Bollinger band (105.50) as the last obstacle en-route to 105.24 (02 Mar low) and psychological 105 support, break of which would spark fresh bearish acceleration, on triggering a number of stops below.
The notion is supported by strong risk aversion which keeps yen supported, however, the pair may stay on hold until FOMC decision on Wednesday which could generate stronger direction signal.
Broken 10SMA marks initial resistance at 106.26, followed by 20SMA at 106.51, firm break of which would sideline immediate downside threats, while lift above falling 30SMA (106.97) is needed to neutralize and shift focus higher.
Res: 106.15, 106.26, 106.51, 106.97
Sup: 105.60, 105.50, 105.24, 105.00