Sample Category Title
Dow Jones (DJIA) Holds Support: Tariffs, Data & US Auto Tariff Exemption
- US stock markets (Dow Jones, S&P 500) are experiencing volatility due to Trump administration tariffs.
- A one-month tariff exemption for US automakers has temporarily eased market pressure, but the long-term sustainability of this is uncertain.
- US economic data is mixed, with a services PMI showing growth but rising input costs.
- Technically, the Dow Jones is in a bearish trend but holding key support levels.
Wall Street Indexes remain under pressure today but have held above the lows we saw on Tuesday as the Trump administration tariffs came into force. The announcement of tariffs on Mexico, Canada and China was met with retaliatory tariffs by Canada and China with Mexico expected to announce tariffs on Sunday.
However, US Commerce Secretary Lutnick yesterday stated that President Trump could relax some tariffs after talks with his Mexican and Canadian counterparts which has arrested the slide in Wall Street indexes for now.
A recent update from the White House revealed ongoing discussions between President Trump and Canadian Prime Minister Justin Trudeau. However, these talks have yet to yield any significant breakthroughs. Despite the lack of progress, market sentiment remains cautiously optimistic. The absence of fresh lows on U.S. indexes suggests that investors still believe in the possibility of a repeal or rollback of certain tariffs.
SPX 500 Heatmap
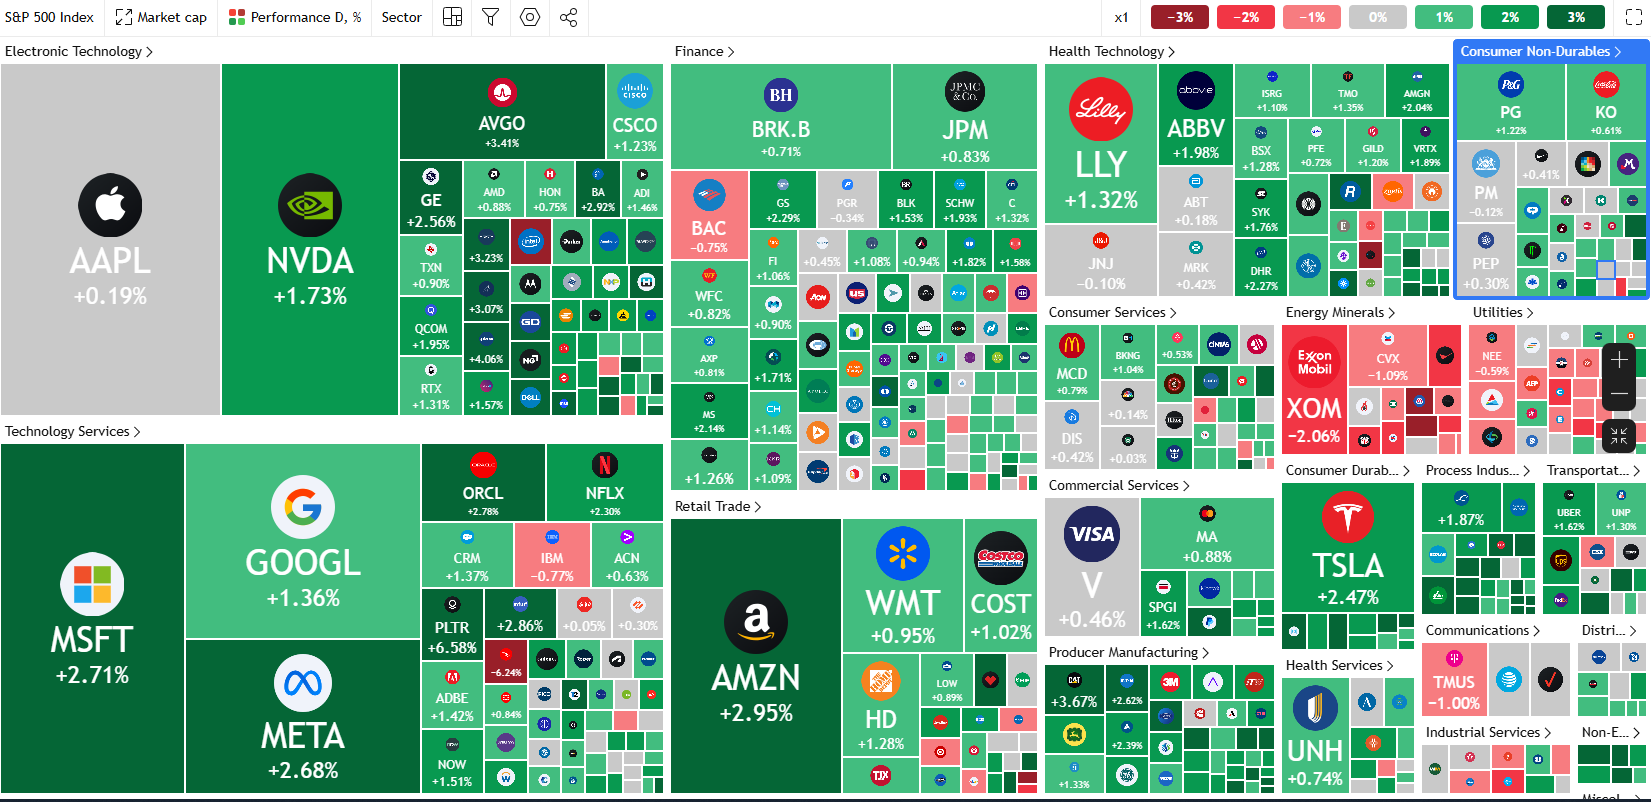
Source: TradingView
US indexes were helped a short while ago as the White House announced a one-month tariff exemption for automakers General Motors, Stellantis, and Ford on Wednesday afternoon.
“We are going to grant a one-month exemption on any autos passing through the USMCA [United States–Mexico–Canada Agreement],” a spokesperson stated during a press briefing. They added, “Reciprocal tariffs will still take effect on April 2, but at the request of companies associated with USMCA, the President is allowing this exemption to prevent any economic disadvantage.”
This move should not come as a surprise as automakers warned that tariffs could lead to significant price increases for consumers due to tariffs. The question however is whether such gains will remain sustainable moving forward or just temporary, as risk and uncertainty remain in play.
US Data continues to throw up warning signs however with a mixed US services PMI data print earlier in the day. February data revealed an unexpected uptick in growth within the services sector. However, optimism was moderated by emerging signs of rising input costs.
A sign that market participants remain concerned about future developments is reflected in the systematic equity positioning chart below. As you can see, systematic equity positioning is in the 60th percentile which indicates that it is not far from a neutral position and does not exhibit a strong bias towards either bullish or bearish positions, a sign of the markets uncertainty.
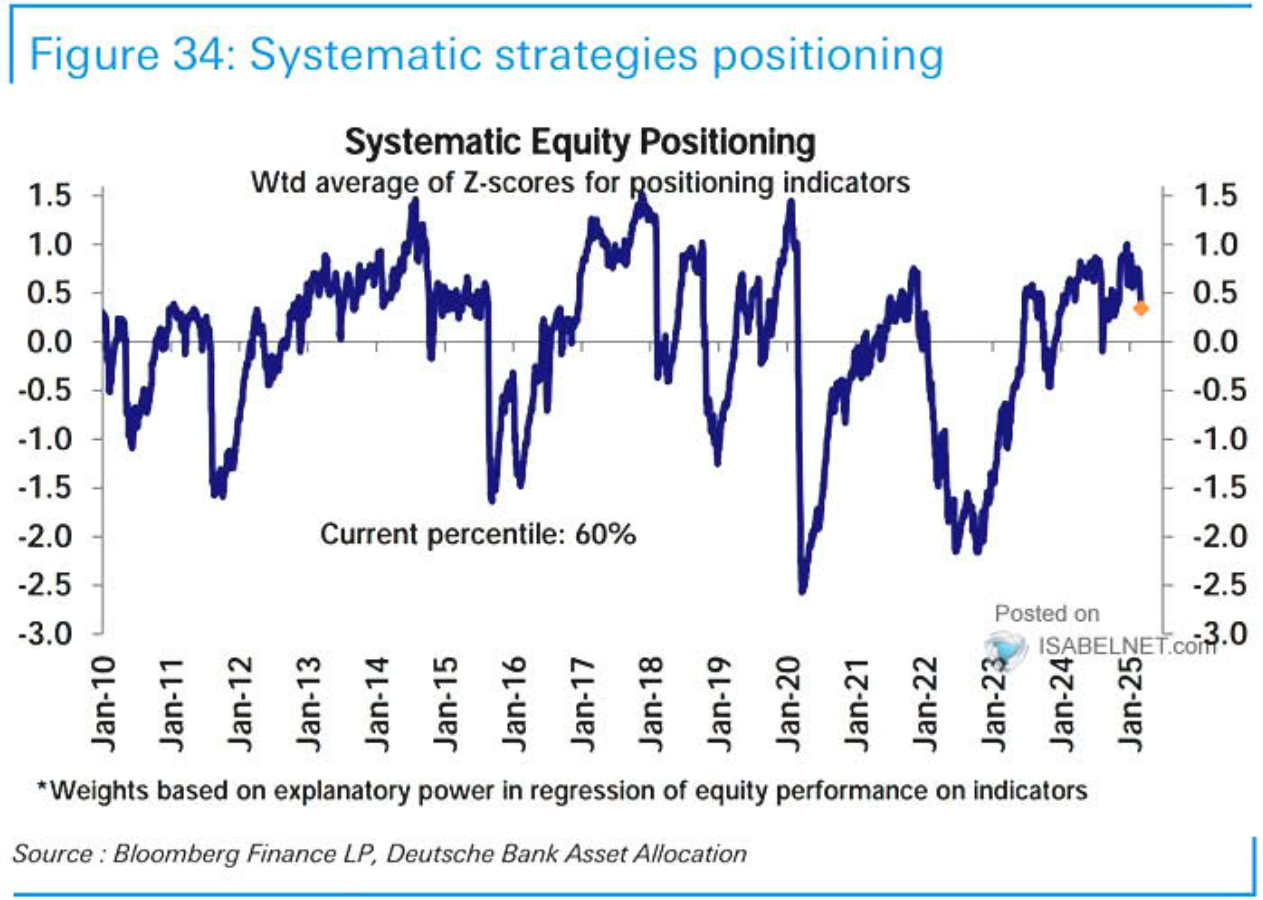
Source: Isablenet (click to enlarge)
US Data Ahead
US jobs payroll data still lies ahead on Friday and it should prove to be an interesting one.
New data from ADP showed the private sector added 77,000 jobs in February, much lower than the expected 140,000 jobs. This number is also far below the 186,000 jobs added in January, which was revised up from the earlier estimate of 183,000.
Tomorrow market participants will get a glance at initial jobless claims data before the all important NFP print on Friday.
Technical Analysis
Dow Jones
From a technical standpoint, the Dow Jones remains in a bearish trend but has shown some resilience holding above key support levels for now.
The index is trading at a confluence level as it hovers in the 61.8%-78.6% fibonacci retracement zone and between two key levels of 42764 and 42446. The longer price holds these levels the greater the probability of a recovery as we are seeing today.
The question is how far can a potential recovery run and a lot of this will depend on tariff development over the coming days.
Immediate resistance rests at 43402 and 43800 with a daily candle close above the 43800 leading to a change in structure. This would put bulls back in control from a technical analysis standpoint.
Immediate support rests at 42764 and 42446 before the 42000 handle comes back into focus.
Dow Jones (US30) Daily Chart, March 5, 2025
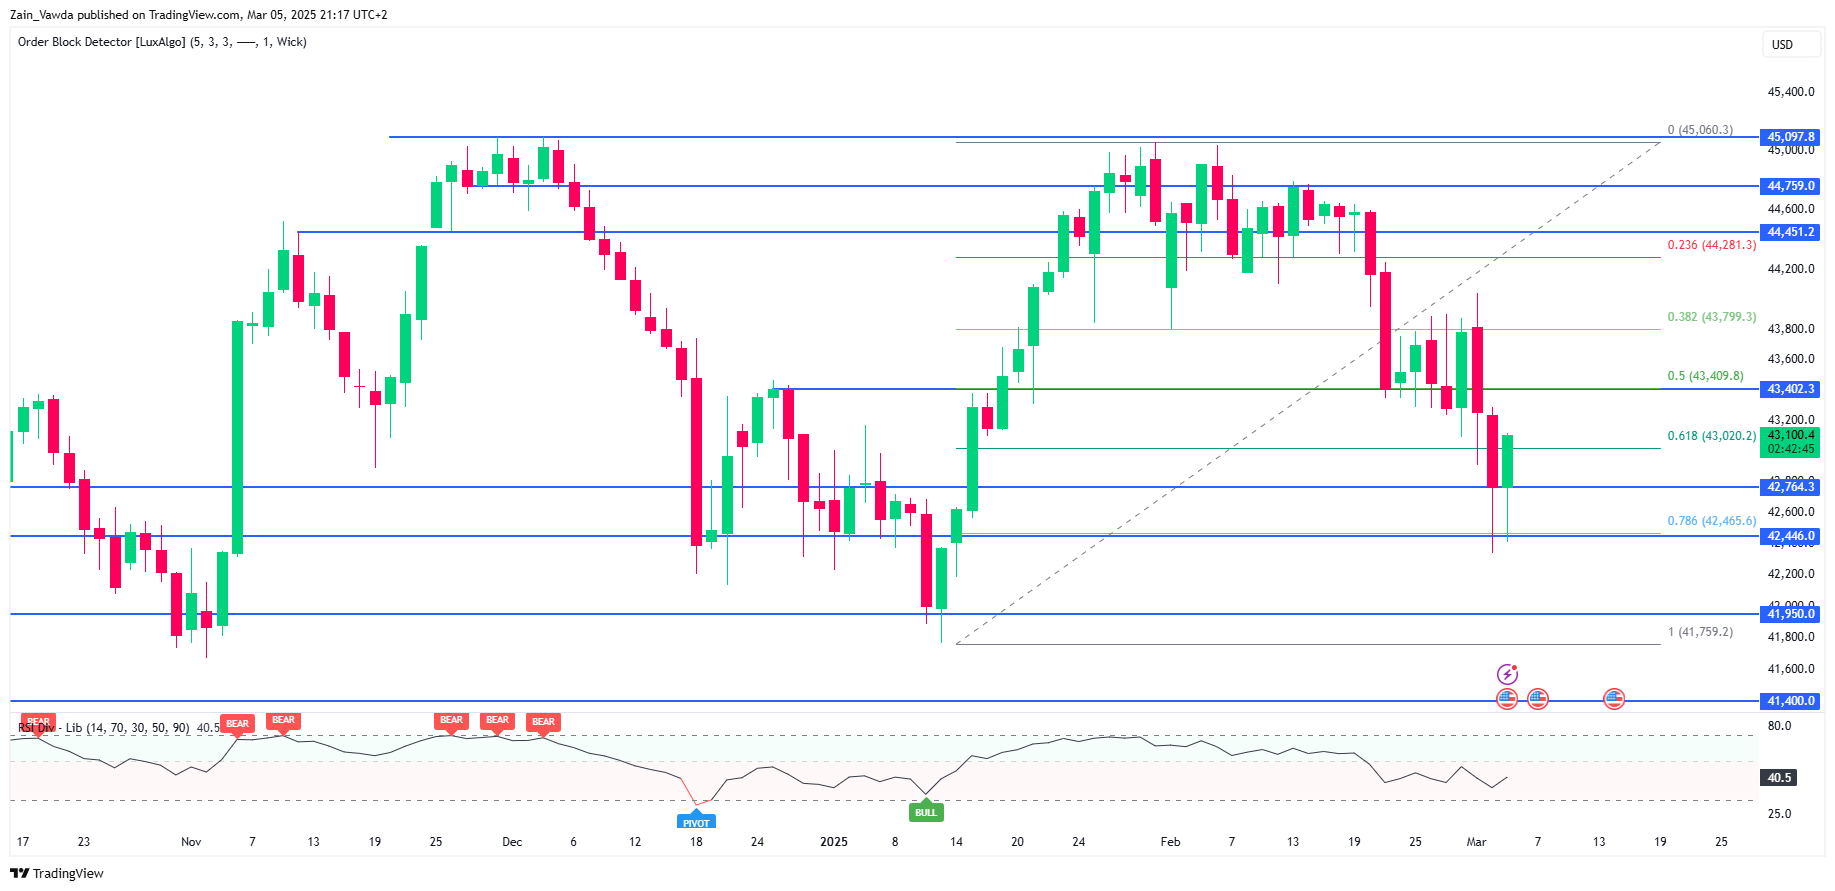
Source: TradingView (click to enlarge)
Support
- 42764
- 42446
- 42000
Resistance
- 43402
- 43800
- 44451
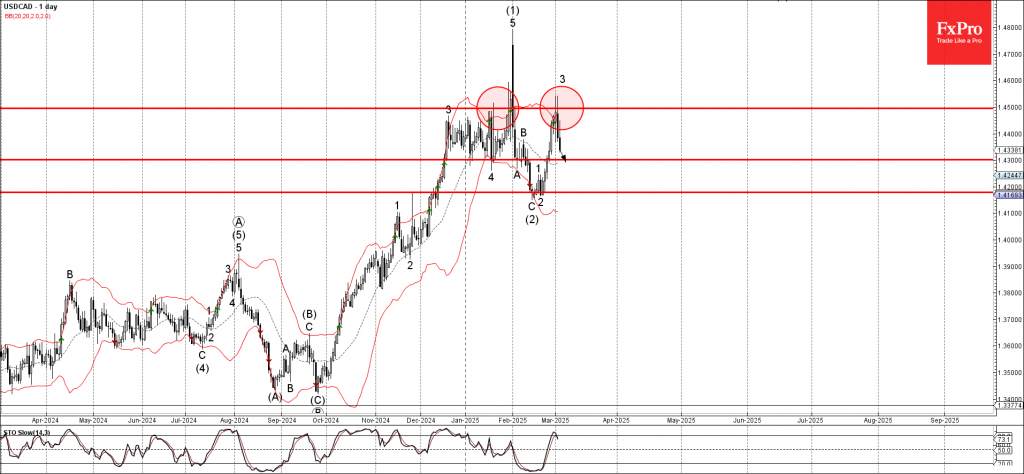
USDCAD Wave Analysis
- USDCAD reversed from the resistance zone
- Likely to fall to support level 1.4300
USDCAD recently reversed down from the resistance zone between the resistance level 1.4500 (which has been reversing the price from January) and the upper daily Bollinger Band.
The downward reversal from this resistance zone created the daily Japanese candlesticks reversal pattern Bearish Engulfing – which stopped the earlier impulse wave 3.
Given the strength of the resistance level 1.4500, USDCAD can be expected to fall to the next support level 1.4300.
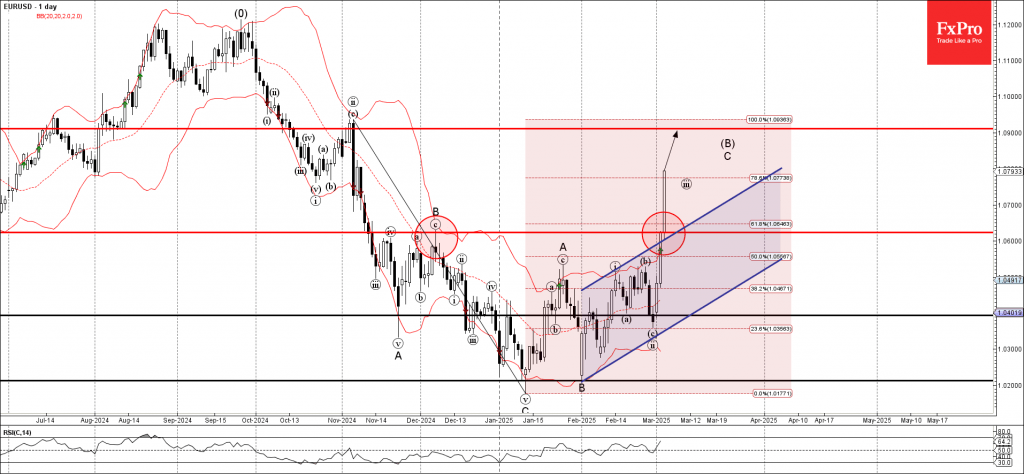
EURUSD Wave Analysis
- EURUSD broke the resistance zone
- Likely to rise to resistance level 1.0900
EURUSD currency pair recently broke the resistance zone between the resistance level 1.0625 (former monthly high from December), 61.8% Fibonacci correction of the downward impulse from November and the resistance trendline of the daily up channel from January.
The breakup of this resistance zone accelerated the active impulse wave C of the medium-term ABC correction B from January.
Given the strongly bearish US dollar sentiment, EURUSD can be expected to rise toward the next resistance level 1.0900, the target price for the completion of the active impulse wave C.
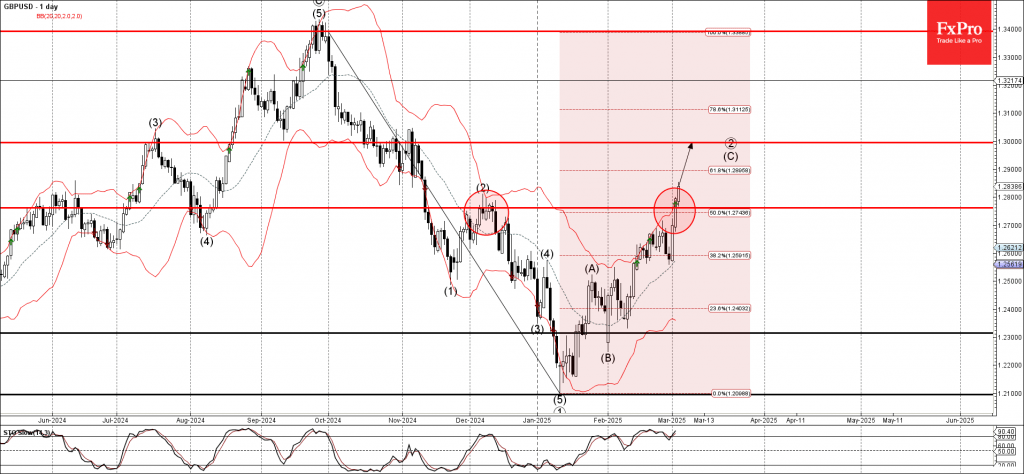
GBPUSD Wave Analysis
- GBPUSD broke the resistance zone
- Likely to rise to resistance level 1.3000
GBPUSD currency pair recently broke the resistance zone between the resistance level 1.2760 (which stopped wave (2) in December) and the 50% Fibonacci correction of the downward ABC correction from September.
The breakup of this resistance zone accelerated the active impulse wave (C) which belongs to the primary ABC correction 2 from January.
GBPUSD can be expected to rise toward the next resistance level 1.3000, the target price for the completion of the active impulse wave (C).
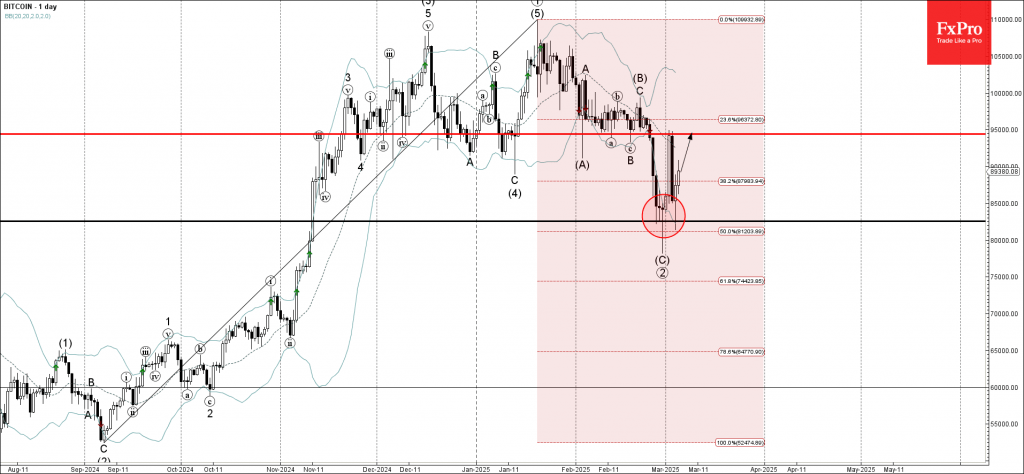
Bitcoin Wave Analysis
- Bitcoin reversed from support zone
- Likely to rise to resistance level 95000.00
Bitcoin recently reversed up multiple times from the support zone located between the key support level 82550.00 standing near the lower daily Bollinger Band and the 50% Fibonacci correction of the upward impulse from September.
The upward reversal from this support zone created the daily Japanese candlesticks reversal pattern Hammer Doji.
Bitcoin can be expected to rise toward the next resistance level 95000.00, which reversed the price sharply earlier this month.
Sunset Market Commentary
Markets
“Whatever it takes.” These words by former ECB president Draghi in July 2012 are widely considered the turnaround in the sovereign debt crisis that had the euro (area) staring into the abyss. Germany’s upcoming chancellor Merz used them again to announce a similar seismic shift on a fiscal level. With a €500bn infrastructure investment fund and essentially unlimited defense spending (exempted from the debt brake) the country addresses two of the most pressing challenges. As a welcome side-effect it could give a cyclical boost to the ailing economy in general. The way Germany’s upcoming government coalition partners struck the agreement – in the dying days of parliament to avoid blocking minorities in the new one – only adds to its already historical status. For it to be approved with the necessary two-thirds majority, the CDU/CSU & SPD still need the support of the Greens, though. In another sign of how the tides have turned, Germany is now urging the EU to ease the fiscal rules quickly. A temporary suspension of the 3% deficit limit rule was one of the options presented by EC president von der Leyen yesterday ahead of tomorrow’s special EU defense summit. Germany’s big and bold move triggers a “Make Europe Great Again” wave of optimism. Stocks in the region add 2.5% (EuroStoxx50) with Germany (+3.3%) outperforming lead by defense, infrastructure and cars. German yields sear up to 25 bps (!). The 30-yr topped 3% again and its 10-yr yield moves beyond the 2024 high. Bund vs swap (10-yr) spread moved to its highest ever (14 bps). The common currency surges for a third day straight, taking out the EUR/USD 1.0533 and 1.0677 resistance levels in the process. Next up is 1.0804.
We see opposite dynamics playing out in the US again. The stagflationary genie is out of the bottle, set free by ruthless DOGE department and a raft of tariff announcements, regardless the chance of being watered down in the Canadian and Mexican case – as Commerce Secretary Lutnick suggested. US Treasuries greatly outperformed Bunds with much weaker than expected ADP job growth adding to the spread. Coming in at about half of the 140k expected, the US 2-yr yield fell 8 bps to intraday lows. The long end slips 2.5-4.5 bps. The dollar trades at the backfoot, against the euro in the first place, but against all global peers in a broader perspective. DXY (trade-weighted) breaks below 105.17 support (50% retracement on the Sep-Jan rally) to slip to a four-month low. The next reference from the current 104.7 is 103.94/104.
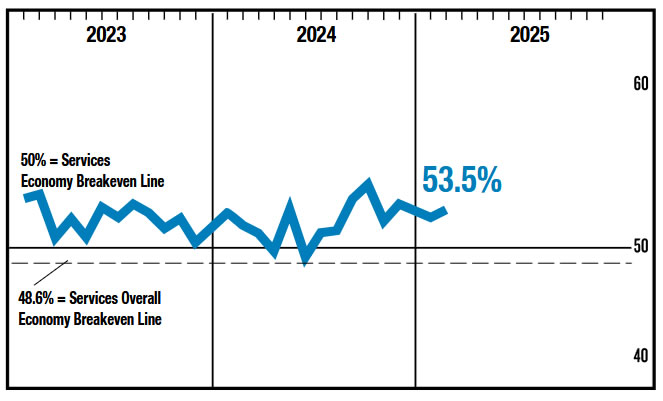
The US services ISM, released when wrapping up this report, came in better than expected. The headline figure in February improved from 52.8 to 53.5 with details printing stronger as well. New orders rose to 52.2 and employment to 53.9. Prices paid ticked higher to 62.6. US yields and the dollar pared some of their previous losses but remain down for the day.
News & Views
Czech inflation rose by 0.2% M/M, matching consensus. On an annual basis, inflation moderated from 2.8% to 2.7%. Inflation remains slightly above the CNB's staff estimate (2.6%) and will not see significant changes in March. There may be a more visible slowdown due to a negative base effect in April. The CNB should have this number at its May meeting with a new staff forecast. Recall that we expect a another rate cut at that meeting. Core CPI, excluding energy, food, alcohol and tobacco rose by 0.6% M/M (3.2% Y/Y from 3.1%). Details also showed services prices rising by 0.7% M/M and stabilizing at 4.7% Y/Y with goods prices falling by 0.2% M/M to be up 1.4% Y/Y (from 1.7%). The Czech koruna obviously didn’t respond to the data. EUR-strength is pushing EUR/CZK away from the 25 support zone.
Swiss inflation accelerated to 0.6% M/M in February to be up 0.3% Y/Y (from 0.4% in January). The monthly increase is due to several factors including rising prices for housing rentals and for air transport. International package holidays also recorded a price increase. In contrast, prices for hotels decreased, as did those for berries and second-hand cars. Details showed overall goods prices rising by 0.2% M/M to be down 1.8% Y/Y while services inflation increased by 0.8% M/M to be 1.7% higher Y/Y. Euro strength is the key driver in EUR/CHF as well with the pair taking out the previous YtD high at 0.9518 today.
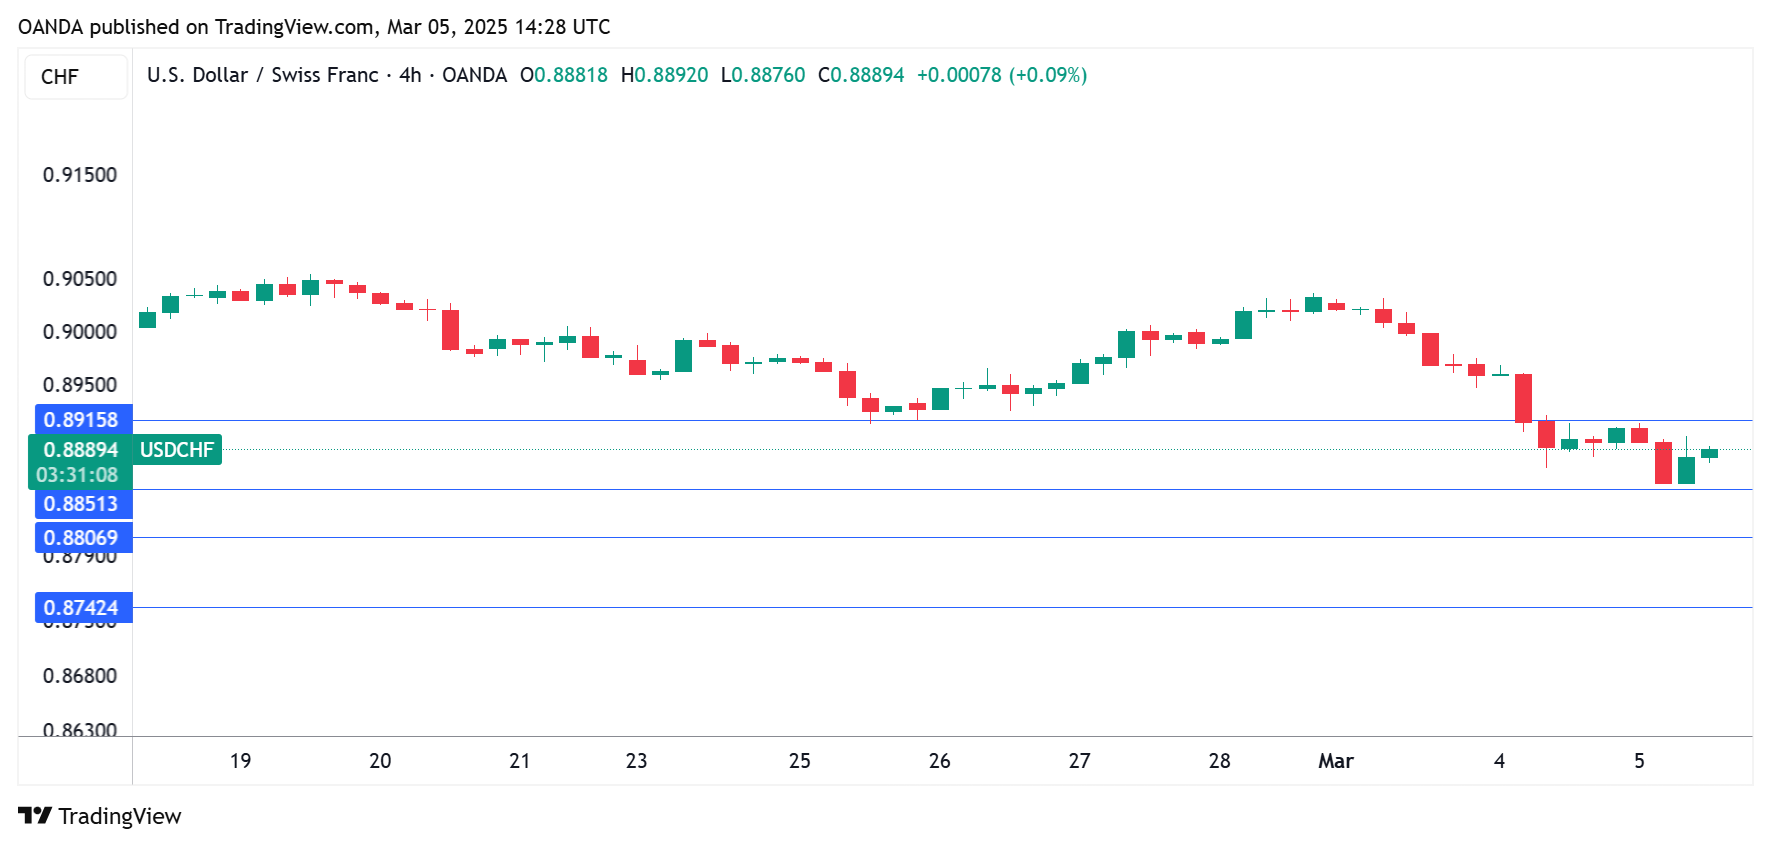
Swiss Franc Hits New 2025 High as Inflation Continues to Fall
The Swiss franc has rallied for a third straight trading day. In the North American session, USD/CHF is trading at 0.8884, down 0.12% on the day. The Swiss franc has jumped 1.6% this week and earlier strengthened to 0.8856, its best level this year.
Switzerland’s inflation falls to lowest in nearly four years
Swiss inflation has been falling and the trend continued in February. Headline CPI rose 0.3% y/y, down from 0.4% in January and above the market estimate of 0.2%. This was the lowest level since April 2021. The decrease was driven by lower prices for food and energy. Core inflation, which removes volatile items such as food and energy, remained steady at 0.9% y/y.
The inflation report confirms the trend of falling inflation and has likely cemented a rate cut when the Swiss National Bank meets on March 20. The markets have priced in a 25 basis point rate cut at around 90%. The SNB chopped rates in December by 50 basis points, bringing the cash rate to 0.5%.
Governor Martin Schlegel has said that the central bank will lower rates into negative territory if needed. The SNB maintained rates in negative territory until 2022, when a coordinated move by the major central banks boosted Swiss rates as high as 1.75%.
In addition to falling inflation, there are other factors supp0rting the case for a rate cut at this month’s meeting. The Swiss economy slowed to 0.2% q/q in the fourth quarter of 2024, down from 0.4% in Q3, its weakest expansion since Q2 2023. As well, a rate cut could cool the rising Swiss franc. The SNB doesn’t want the Swiss franc to continue rising as that hurts Swiss exports.
The US releases ISM Services PMI later today. The services sector continues to expand and is carrrying the US economy on its back, as manufacturing has been in a recession. The market estimate f0r the services PMI stands at 52.6 for February, down slightly from 52.8 in January.
USD/CHF Technical
- There is resistance at 0.8916 and 0.8960
- 0.8851 and 0.8807 are providing support
US ISM services rises to 53.5, growth across key subcomponents
US ISM Services PMI climbed to 53.5 in February, up from 52.8 in January and exceeding expectations of 53.0. The data signaled continued expansion in the services sector, with growth seen across key subcomponents.
Business activity showed only a marginal decline from 54.5 to 54.4. New orders ticked up from 51.3 to 52.2, while employment rose from 52.3 to 53.9. Price pressures remain a concern, as the prices subindex jumped from 60.4 to 62.6, reinforcing worries about inflation persistence.
While the services sector continues to grow, ISM noted that businesses remain anxious over the impact of tariffs, while some respondents cited federal budget reductions as negatively affecting their outlook.
Despite these uncertainties, ISM pointed out that February marked the third consecutive month where all four major subindexes—business activity, new orders, employment, and supplier deliveries—remained in expansion territory, a first since May 2022.
The report also indicated that the current level of services activity corresponds to a 1.6% increase in annualized GDP.
EUR/CHF Mid-Day Outlook
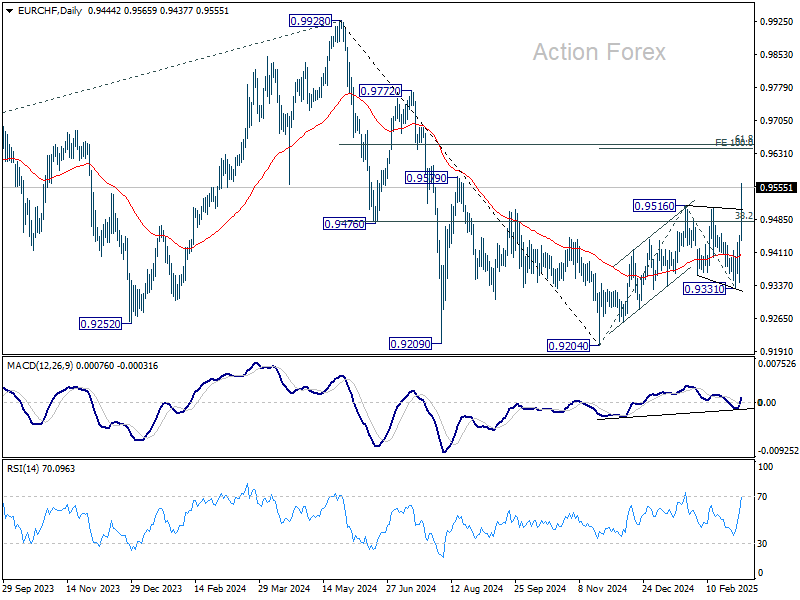
Daily Pivots: (S1) 0.9381; (P) 0.9417; (R1) 0.9489; More....
EUR/CHF's strong break of 0.9516 resistance confirms resumption of whole rally from 0.9204. Intraday bias is back on the upside for 100% projection of 0.8204 to 0.9516 from 0.9331 at 0.9643. On the downside, below 0.9502 minor support will turn intraday bias neutral and bring consolidations first, before staging another rally.
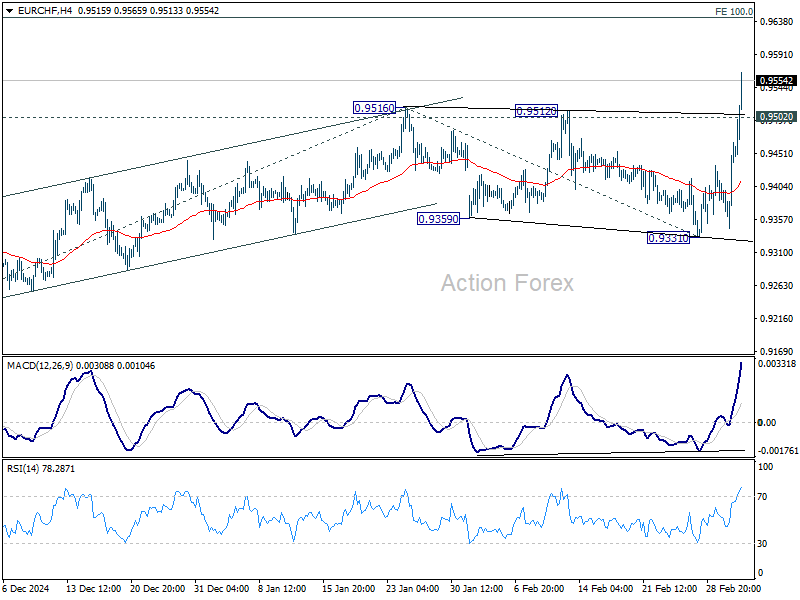
In the bigger picture, sustained trading above 38.2% retracement of 0.9928 to 0.9204 at 0.9481 should now confirm that whole fall from 0.9928 (2024 high) has completed at 0.9204. Further rally should then be seen back to 61.8% retracement at 0.9651 and possibly further this retest 0.9928 key structural resistance (2024 high).