Sample Category Title
GOLD – Threatening Further Upside Pressure
GOLD - The commodity saw price rally on Wednesday leaving risk higher. On the downside, support comes in at the 1,340.00 level where a break will turn attention to the 1,330.00 level. Further down, a cut through here will open the door for a move lower towards the 1,320.00 level. Below here if seen could trigger further downside pressure towards the 1,210.00 level. Conversely, resistance resides at the 1,360.00 level where a break will aim at the 1,370.00 level. A turn above there will expose the 1,380.00 level. Further out, resistance stands at the 1,390.00 level. All in all, GOLD looks to strengthen further.
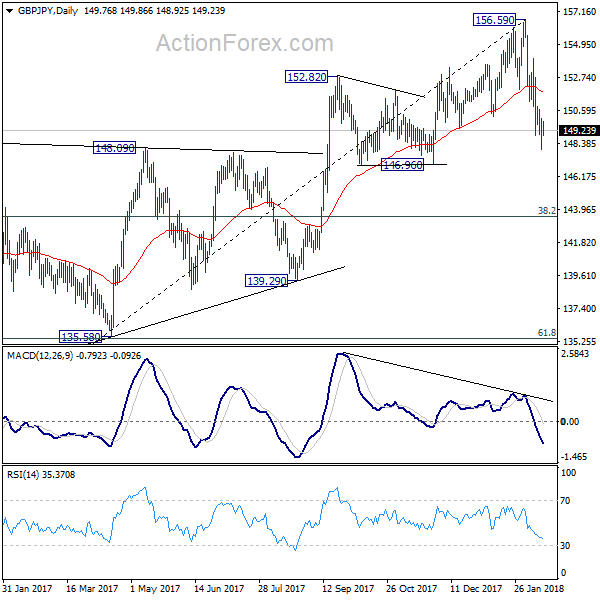
GBP/JPY Daily Outlook
Daily Pivots: (S1) 148.95; (P) 149.78; (R1) 150.59; More...
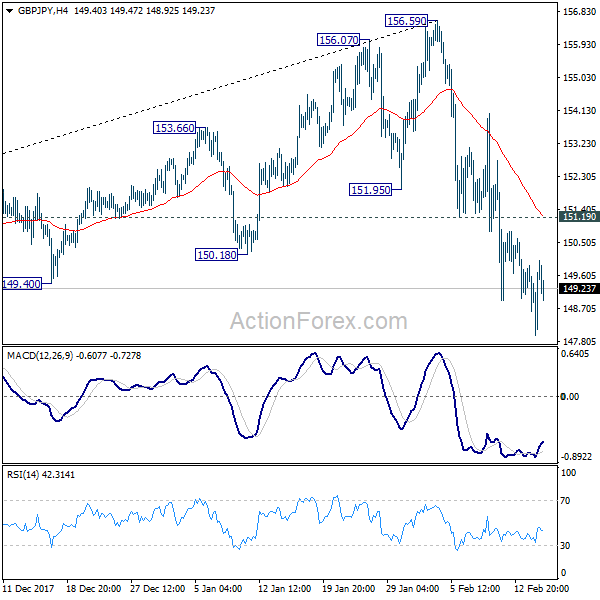
Intraday bias in GBP/JPY remains on the downside as fall from 156.59 is in progress for 146.96 support. Considering bearish divergence condition in daily MACD, firm break of 146.96 will be another sign of medium term trend reversal. On the upside, break of 151.19 is needed to be the first sign of short term bottoming. Otherwise, outlook will remain cautiously bearish even in case of recovery.
In the bigger picture, as long as 146.96 key support holds, medium term outlook remains bullish. Rise from 122.36 is in favor to extend to 61.8% retracement of 195.86 to 122.36 at 167.78. However, break of 146.96 support will indicate trend reversal after rejection by 55 month EMA. In that case, deeper fall would be seen to 38.2% retracement of 122.36 to 156.59 at 143.51 and then 61.8% retracement at 135.43.
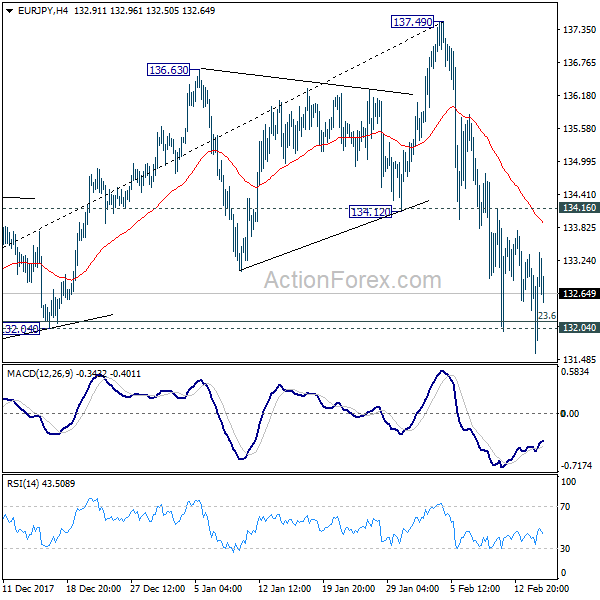
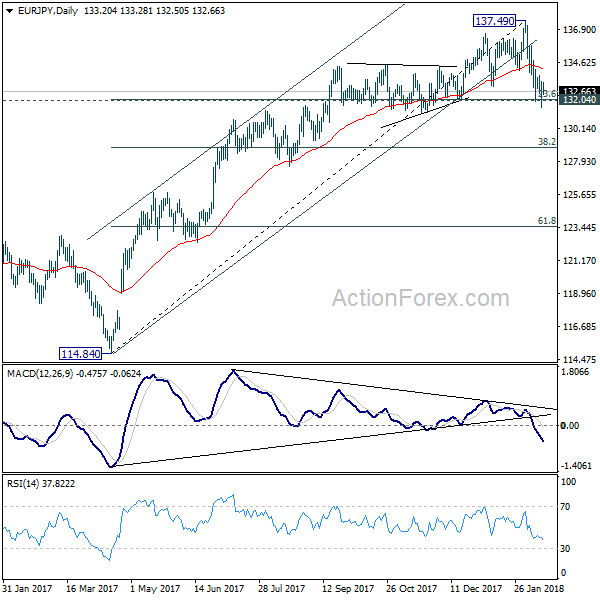
EUR/JPY Daily Outlook
Daily Pivots: (S1) 132.52; (P) 133.15; (R1) 133.79; More....
At this point, EUR/JPY cannot sustain below 132.04 cluster support (23.6% retracement of 114.84 to 137.49 at 132.14) yet. Intraday bias remains neutral first. Deeper fall is still expected with 134.16 resistance intact. Decisive break of 132.04/14 will indicate larger trend reversal on bearish divergence condition in daily MACD. In such case, outlook will be turned bearish for 38.2% retracement at 128.38 first. Nonetheless, rebound from 132.04 will retain near term bullishness. Break of 134.16 minor resistance will bring retest of 137.49 high instead.
In the bigger picture, bearish divergence condition in week EMA indicates lost up medium term up trend momentum. But there is no clear sign of completion of up trend from 109.03 yet. Break of 137.49 will target 141.04/149.76 resistance zone. However, sustained break of 132.04 will be the early sign of long term reversal and should bring deeper fall back to retest 124.08 key support level.
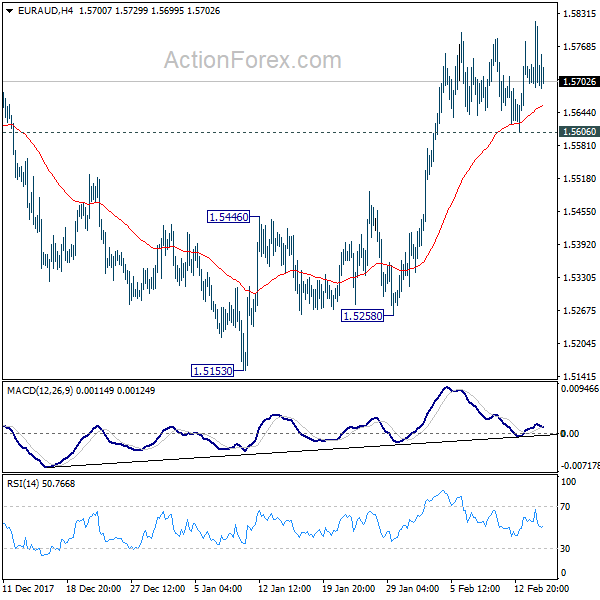
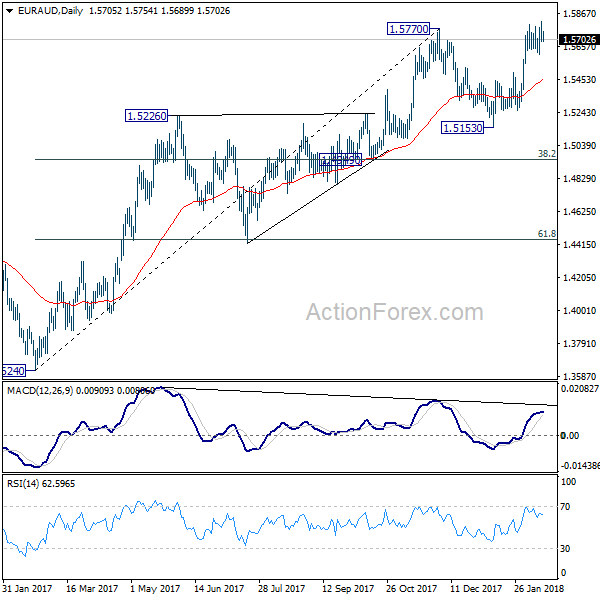
EUR/AUD Daily Outlook
Daily Pivots: (S1) 1.5660; (P) 1.5738; (R1) 1.5785; More....
EUR/AUD edged higher to 1.5816 but quickly retreated. But after all, as long as 1.5606 support holds, further rally is expected. Sustained break of 1.5770 resistance will confirm resumption of medium term rise from 1.3264. In that case, EUR/AUD should target 1.6587 key long term resistance. However, below 1.5606 minor support minor support will dampen this bullish case and turn bias to the downside.
In the bigger picture, medium term rise from 1.3624 is not completed yet. Break of 1.5770 will extend the rise to retest 1.6587 (2015 high). However, considering bearish divergence condition in daily MACD, sustained break of 1.4949 cluster support (38.2% retracement of 1.3624 to 1.5770 at 1.4950) will indicate medium term reversal. And there is prospect of retesting 1.3624 low in that bearish case.
Gold Price Back In Bullish Zone Post US CPI
Key Highlights
- Gold price traded higher recently and succeeded in breaking the $1,335 resistance against the US Dollar.
- A crucial bearish trend line with resistance at $1,330 was breached on the 4-hours chart of XAU/USD.
- The US Consumer Price Index increased 0.5% in Jan 2018, more than the forecast of 0.3% (MoM).
- The US Retail Sales declined 0.3% in Jan 2018, compared with the forecast of +0.2% (MoM).
Gold Price Technical Analysis
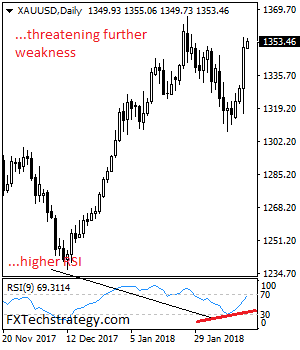
There was a bullish price action in Gold price earlier this week above $1,325 against the US Dollar. Later, the price gained upside momentum and broke a major resistance at $1,335.
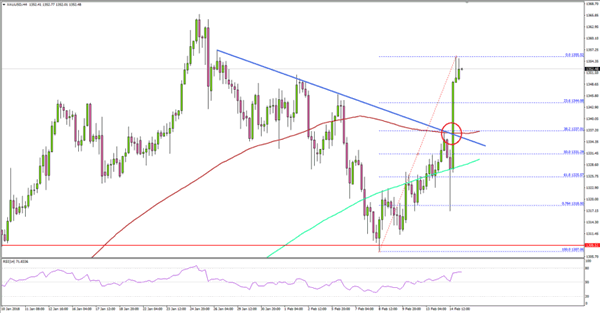
More importantly, there was a break above a crucial bearish trend line with resistance at $1,330 on the 4-hours chart of XAU/USD. The trend line resistance was also near the 100 simple moving average (red, 4-hours).
Therefore, the $1,335 level break holds a lot of significance. The price traded as high as $1,355 recently. On the downside, an initial support is around the 23.6% Fib retracement level of the last wave from the $1,307 low to $1,355 high.
However, the most important support is near $1,335 (previous resistance). It is also near the 38.2% Fib retracement level of the last wave from the $1,307 low to $1,355 high.
In the short term, the price may consolidate above $1,345, with supports at $1,340 and $1,335. On the upside, a break above $1,355 could push the price towards $1,365.
US CPI and Retail Sales
Recently, the US saw two important releases. First, the Consumer Price Index for Jan 2018 by the US Bureau of Labor Statistics. The market was looking for a rise of 0.3% in the CPI compared with the previous month.
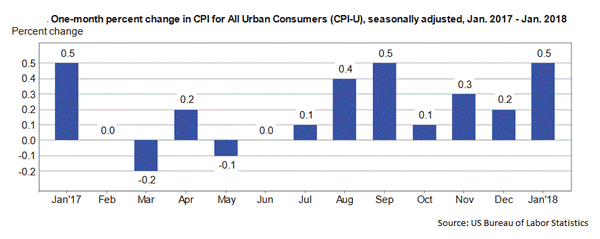
The actual result was better, as there was a 0.5% rise in the CPI (MoM). The yearly change came in at 2.1%, more than the forecast of 1.9%, but similar to the last. The report added that:
The seasonally adjusted increase in the all items index was broad-based, with increases in the indexes for gasoline, shelter, apparel, medical care, and food all contributing. The energy index rose 3.0 percent in January, with the increase in the gasoline index more than offsetting declines in other energy component indexes. The food index rose 0.2 percent with the indexes for food at home and food away from home both rising.
The second release was the Retail Sales for Jan 2018 by the US Census Bureau. The result was disappointing, as there was a 0.3% decline in sales compared with the previous month, whereas the market was looking for a 0.2% rise.
The US Dollar gained initially after the release, but it later declined heavily. EUR/USD jumped from 1.2280 to 1.2450 and GBP/USD moved above 1.4000. However, there was a no relief for the USD/JPY buyers, as the pair tumbled to a new 15-month low and traded below 107.00.
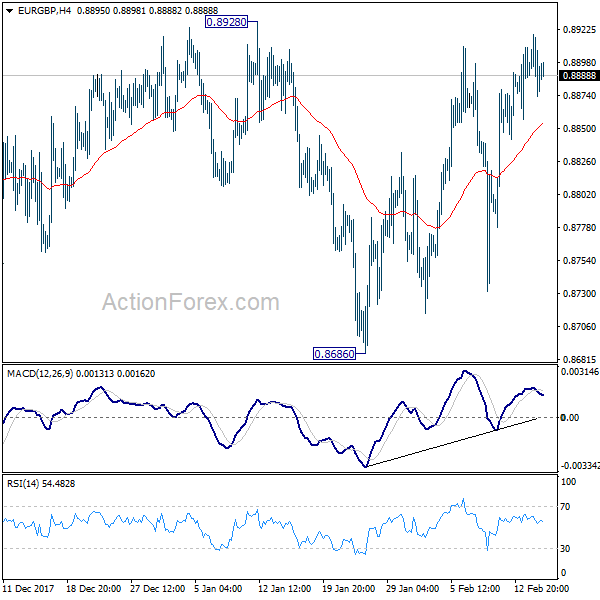
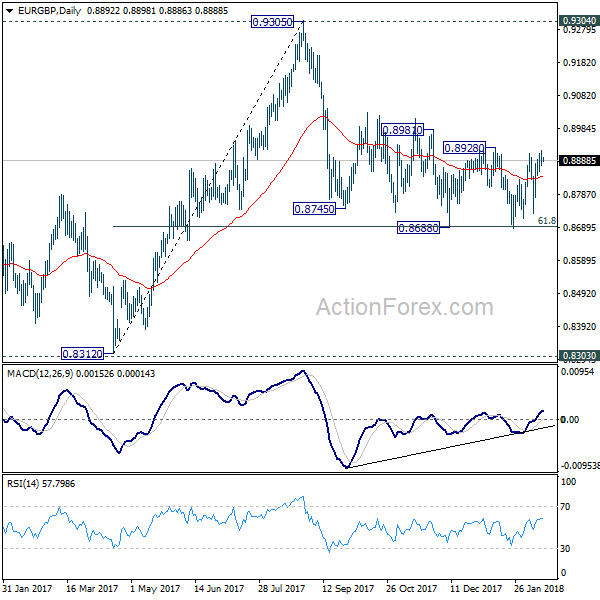
EUR/GBP Daily Outlook
Daily Pivots: (S1) 0.8872; (P) 0.8895; (R1) 0.8917; More...
Range trading continues in EUR/GBP, inside 0.8686/8928. Intraday bias remains neutral. Near term outlook will remain mildly bearish as long as 0.8928 resistance holds. On the downside, firm break of 0.8686 will resume whole decline from 0.9305. As 61.8% retracement of 0.8312 to 0.9305 should then be taken out too. Deeper decline would be seen to retest 0.8303/8312 support zone. Nonetheless, on the upside, break of 0.8928 will indicate near term reversal and turn outlook bullish for 0.9304 resistance.
In the bigger picture, there are various ways to interpret price actions from 0.9304 high. But after all, firm break of 0.9304/5 is needed to confirm up trend resumption. Otherwise, range trading will continue with risk of deeper fall. And in that case, EUR/GBP could have a retest on 0.8303. But we'd expect strong support from 0.8116 cluster support (50% retracement of 0.6935 to 0.9304 at 0.8120) to contain downside.
Market Morning Briefing: Strong Rise In Euro
STOCKS
Dow (24893.49, +1.03%) has recovered well and looking bullish in the near term after a break of 24500 on the upside. Immediate target on the upside is 25000-25200 levels.
Dax (12339.16, +1.17%) is likely to range in the 12400-12000 region in the coming sessions. A break above 12400, if seen could take the price towards 12600 which is also a decent resistance. Overall while the index remains below 12600, view remains sideways to bearish.
Nikkei (21434.63, +1.33%) is up slightly and remains above 21000 support. We prefer support near 21000 to hold in the medium term, thus pushing the index towards 22200 or a little higher in the coming sessions. A break below 21000, if seen could make the index vulnerable to a sharp fall in the longer run.
Shanghai (3199.16, +0.45%) is trading a bit higher today, trying to recover from levels near 3050. Now the earlier support turned resistance near 3260 is important and while the index remains below 3260, near term is likely to remain bearish with a possibility of another fall from levels near 3230. Only a sustained rise above 3260 can take the index back to higher levels in the long term.
Nifty (10500.90, -0.37%) is holding well above 10380-10400 levels and while that holds, the prices may attempt to move up towards 10800 or even higher in the medium term. Sensex (34155.95, -0.42%) also has similar support near 33750 which is likely to hold and keep the price stable for now.
COMMODITIES
Brent (64.86) has moved up well from 62. Support as mentioned yesterday. 65 is an important levels for the near term. A sustained break above 65 is needed to move higher towards 67 in the medium term; else the price is likely to remain ranged in the 63-65 region for some time.
WTI (61.24) has moved up from the upper limit of the support region 57.30-58.00 as mentioned yesterday and is trading higher as expected. A test of 62 is possible in the coming sessions. A sustained rise above 62 is needed o confirm the possibility of further upside just now. Else another fall towards 59-58 could be possible.
Gold (1353.66) has also moved up as expected. A test of 1360 is possible over the next 1-2 sessions. Break above 1360 could take it higher towards 1375-1380 levels.
Copper (3.24) is trading higher and is likely to come off from resistance at 3.25. Near term looks bearish
FOREX
Strong rise in Euro (1.2458) overnight to test the Resistance on the Weekly Line chart, as mentioned yesterday. The previous high of 1.2537 (25-Jan) is the next Resistance to look at. If this also breaks, then we would look at 1.2600 and 1.2670. Having said that there are some chances of a dip from 1.2537. We will have to assess that.
Our target of 106.50 has also been met exactly on Dollar-Yen (106.50). There is some immediate Support at 106.00 and then deeper Support at 105.50, which we should give some respect to. Beware, however, that a break below 105.50 could be very bearish.
The Euro-Yen (132.67) has seen a low of 132.35, just above the target of 132 mentioned yesterday. It could take on more bearishness while below 133 and 134, but confirmation is needed in form of a break below 132.00-131.50.
Dollar-Rupee (64.09) trades at 63.95 on the NDF. We see Supports in the 63.90-85 region.
INTEREST RATES
US 10 Year Yield (2.91), US 30 year Yield (3.16), US 5 year yield (2.66), US 2 year yield (2.18) : Higher than expected inflation in Jan’18 has spooked bond investors globally, increasing the likelihood of a string of rate hikes by the US Fed this year. This is leading to a sell-off, thereby depressing bond prices and increasing yields. The near end yields have seen a rise of almost 15-17 bps in one day while the far end yields have seen a rise of 7-10 bps. As previously stated, our expectation was for yields to respect their long term resistance levels (2.85-2.90, 3.20, 2.7 and 2.2 respectively) in this month. We will have to see if renewed bearishness in the bond market proves us wrong. For now, the channels on short term charts show resistances near 2.9 and 3.16 for 10 year and 30 year respectively which sync well with the long term resistance view.
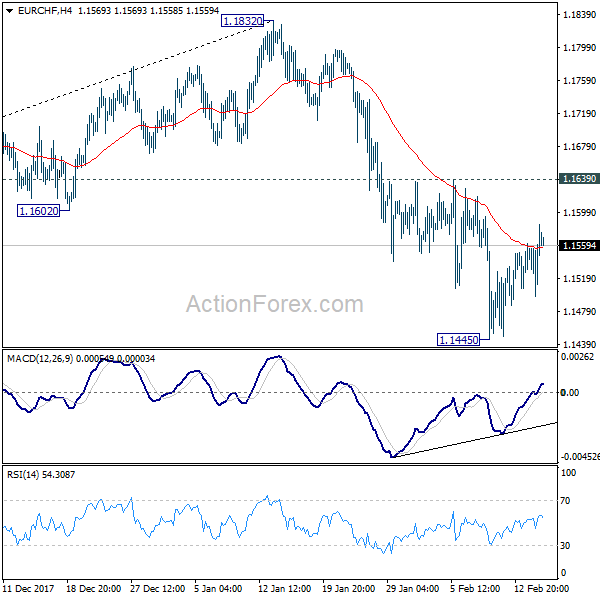
EUR/CHF Daily Outlook
Daily Pivots: (S1) 1.1515; (P) 1.1550; (R1) 1.1602; More...
Intraday bias in EUR/CHF remains neutral as consolidation from 1.1445 is extending. With 1.1639 resistance intact, further decline is expected. Below 1.1445 will extend the corrective fall from 1.1832 to 1.1355 cluster support (38.2% retracement of 1.0629 to 1.1832 at 1.1372.) At this point, we'd expect strong support from there to contain downside and bring rebound.
In the bigger picture, a medium term top should be in place at 1.1832 on bearish divergence condition in daily MACD. But there is no indication of long term reversal yet. As long as 1.1198 resistance turned support holds, we'd still expect another rise through prior SNB imposed floor at 1.2000.
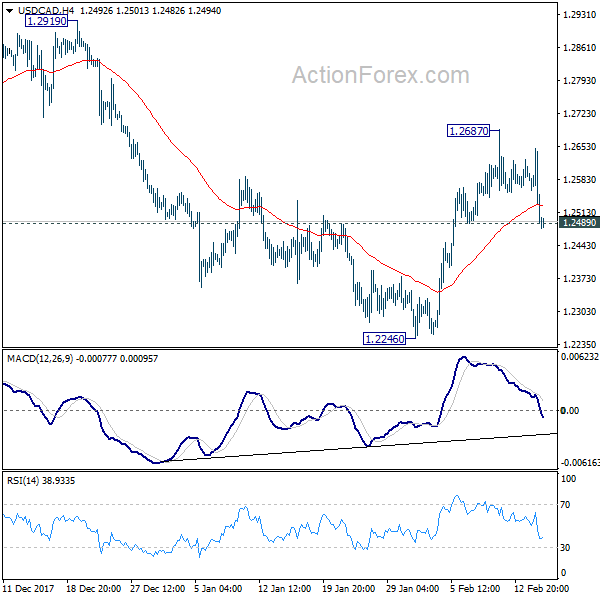
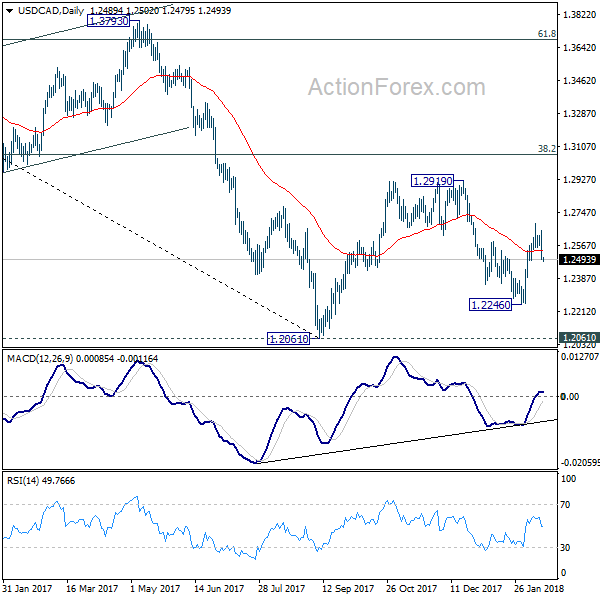
USD/CAD Daily Outlook
Daily Pivots: (S1) 1.2438; (P) 1.2543; (R1) 1.2596; More....
Break of 1.2489 minor support argues that rebound from 1.2246 has completed at 1.2687 already. Intraday bias is turned back to the downside for retesting 1.2246 low. Break will resume the fall from 1.2919 and target key support level at 1.2061.
In the bigger picture, the rebound from 1.2246 is mixing up the medium term outlook. Nonetheless, USD/CAD is staying below falling 55 week EMA, hence, the bearish case is in favor. That is, fall from 1.4689 is not completed yet. Sustained break of 1.2061 key support will carry larger bearish implication and target 61.8% retracement of 0.9406 to 1.4689 at 1.1424. However, firm break of 1.2919 will revive the case of medium term reversal and turn outlook bullish.
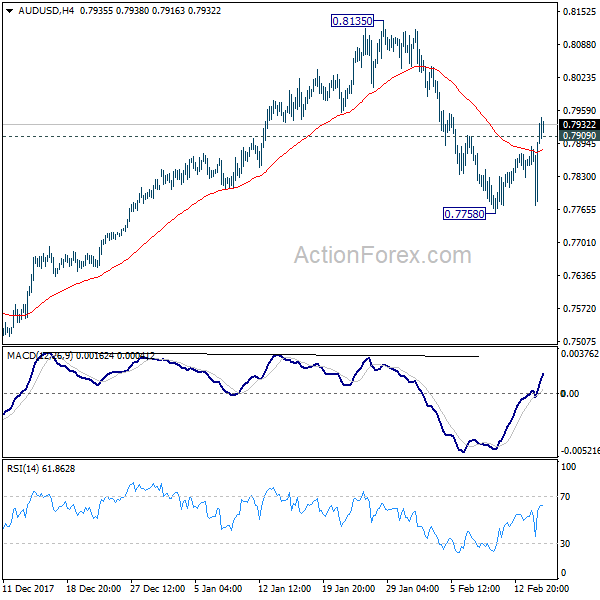
AUD/USD Daily Outlook
Daily Pivots: (S1) 0.7820; (P) 0.7877; (R1) 0.7982; More...
AUD/USD's break of 0.7909 minor resistance argues that fall from 0.8135 has completed at 0.7758 already. Intraday bias is turned back to the upside for retesting 0.8135 resistance first. Break will resume medium term up trend for 0.8451 fibonacci level. On the downside, below 0.7758 will resume the fall towards 0.7500 key support. We'd look for strong support from 0.7500 to contain downside and bring rebound.
In the bigger picture, medium term rebound from 0.6826 is seen as a corrective move. It might still extend higher but we'd expect strong resistance from 38.2% retracement of 1.1079 to 0.6826 at 0.8451 to limit upside to bring long term down trend resumption. On the downside, break of 0.7500 support will now be an important signal that such corrective rebound is completed.